ARMCO’s Mortgage QC Industry Trends Report represents an analysis of nationwide quality control findings based on data derived from the ACES Analytics benchmarking software.
Executive Summary
QC Industry Trends – Overview
QC Industry Trends – by Category
QC Industry Trends – by Loan Purpose
QC Industry Trends – by Loan Type
Conclusion
About this Report
Executive Summary
This report represents an analysis of post-closing quality control data derived from loan files analyzed by the ACES Analytics benchmarking system during the first quarter of 2019 (Q1 2019). The analysis and commentary include prior quarter data and prior year data.
Findings for the Q1 2019 Trends Report are based on post-closing quality control data from over 90,000 unique loans. All reviews and defect data that were evaluated for this report were based on loan audits selected by lenders for full file review.
Defects are categorized using the Fannie Mae loan defect taxonomy. Data for any given calendar quarter is analyzed no earlier than 90 days after the end of the quarter to allow sufficient time for lenders to complete the post-closing quality control cycle. Hence, ARMCO releases analyses for Q1 2019 in Q3 2019.
NOTE: A critical defect is defined as a defect that would result in the loan being uninsurable or ineligible for sale. The critical defect rate reflects the percentage of loans reviewed for which at least one critical defect was identified during the post-closing quality control review and all reported defects are net defects.
Summary of Findings
In Q1 2019, the critical defect rate decreased from the previous three quarters and is now within range of the critical defect rate for calendar year (CY) 2018.
Report highlights include the following findings for Q1 2019:
- The critical defect rate fell 6%, from 1.93% in Q4 2018 to 1.82% in Q1 2019.
- Defects related to core underwriting and eligibility functions continued to increase, with more defects attributed to Income/Employment than any other category.
- Critical defects attributed to missing, expired and/or incorrect documentation continued to be volatile (24% in Q3 ’18, 16% in Q4 ’18, and 24% this quarter) and noted a substantial increase from the prior quarter.
- Compliance-related critical defects fell to their lowest level since Q1 2016, likely the result of greater lender Investment in compliance technologies.
- Defects related to Property and Appraisal increased noticeably from the previous quarter but remained low overall.
- Government-insured loans accounted for a slightly higher share of all loans in the benchmark with FHA, VA and USDA loans comprising 41% of all loans reviewed.
QC Industry Trends – Overview
Interest rates fell during Q1 2019, leading to an increase in refinance transactions and overall lending volume. By the end of Q1 2019, the average 30-year fixed rate was 4.27%, a drop of over one-quarter of a point from the previous quarter’s ending rate of 4.55% and over five-eighths of a point lower than the 2018 peak of 4.94%.
The big question in evaluating loan quality for Q1 2019 was whether defect rates would improve when the lending environment improved. The previous two quarters—the latter half of 2018–were marked by higher rates, fewer refinance transactions and lower overall volume. Lenders adjusted their products and staff to adapt to the dip in volume. Unsurprisingly, with the unfamiliarity of new products, challenges brought about by staff layoffs and consolidation, and the greater amounts of documentation per file, as required for purchase transactions, defect rates rose.
In Q1 2019, the lending environment improved. Critical defect rates re-aligned with the lower defect rates seen earlier in 2018, before defect rates spiked in Q3 and Q4 2018. In Q1 2019, the overall defect rate dropped 6%, from 1.93% in Q4 2018 to 1.82% in Q1 2019, which is very close to the average defect rate for CY 2018 (1.83%). Critical defect rates in the first two quarters of 2018 were in the 1.71% range.
With the 30-year fixed rate lower today than it has been since Spring 2016, economists and industry analysts believe that a significant portion of loans closed in the last three years are now in a position where refinancing could make sense for those borrowers. Going forward, with a refinance market that fuels higher volume, we can expect critical defect rates to continue their decline, and fall lower than Q1 2019 levels. If the lending environment continues to improve, it is reasonable to anticipate a return to this range in future quarters.
Figure 1 displays critical defect rates—the number of loans containing at least one critical defect as a percentage of the total closed loans reviewed—for the past four calendar quarters. All loans reviewed are part of a lenders’ monthly random post-closing quality control review.
Critical Defect Rate by Quarter: Q2 2018 – Q1 2019

Figure 1: Percentage of loans with critical defects, by quarter. Figures reflect the number of loans containing at least one critical defect as a percentage of the total closed loans reviewed.
QC Industry Trends by Defect Category
The distribution of critical defects and activity within specific defect categories can reveal a lot about the state of the market.
As with the previous quarter, in Q1 2019, defects related to Income/Employment were the most frequently occurring. Loans with these issues comprised 28% of all loans with a critical defect. The second most frequently occurring defect category was Loan Package Documentation. Credit was the third most frequently occurring defect category, falling from the second place in Q4 2018. Documentation-related defects tend to fluctuate from quarter-to-quarter more than any other category. The four most frequently occurring defect categories comprised 82% of all defects.
Figure 2 shows net critical defects sorted according to Fannie Mae defect category for Q1 2019.
Critical Defects by Fannie Mae Category: Q1 2019
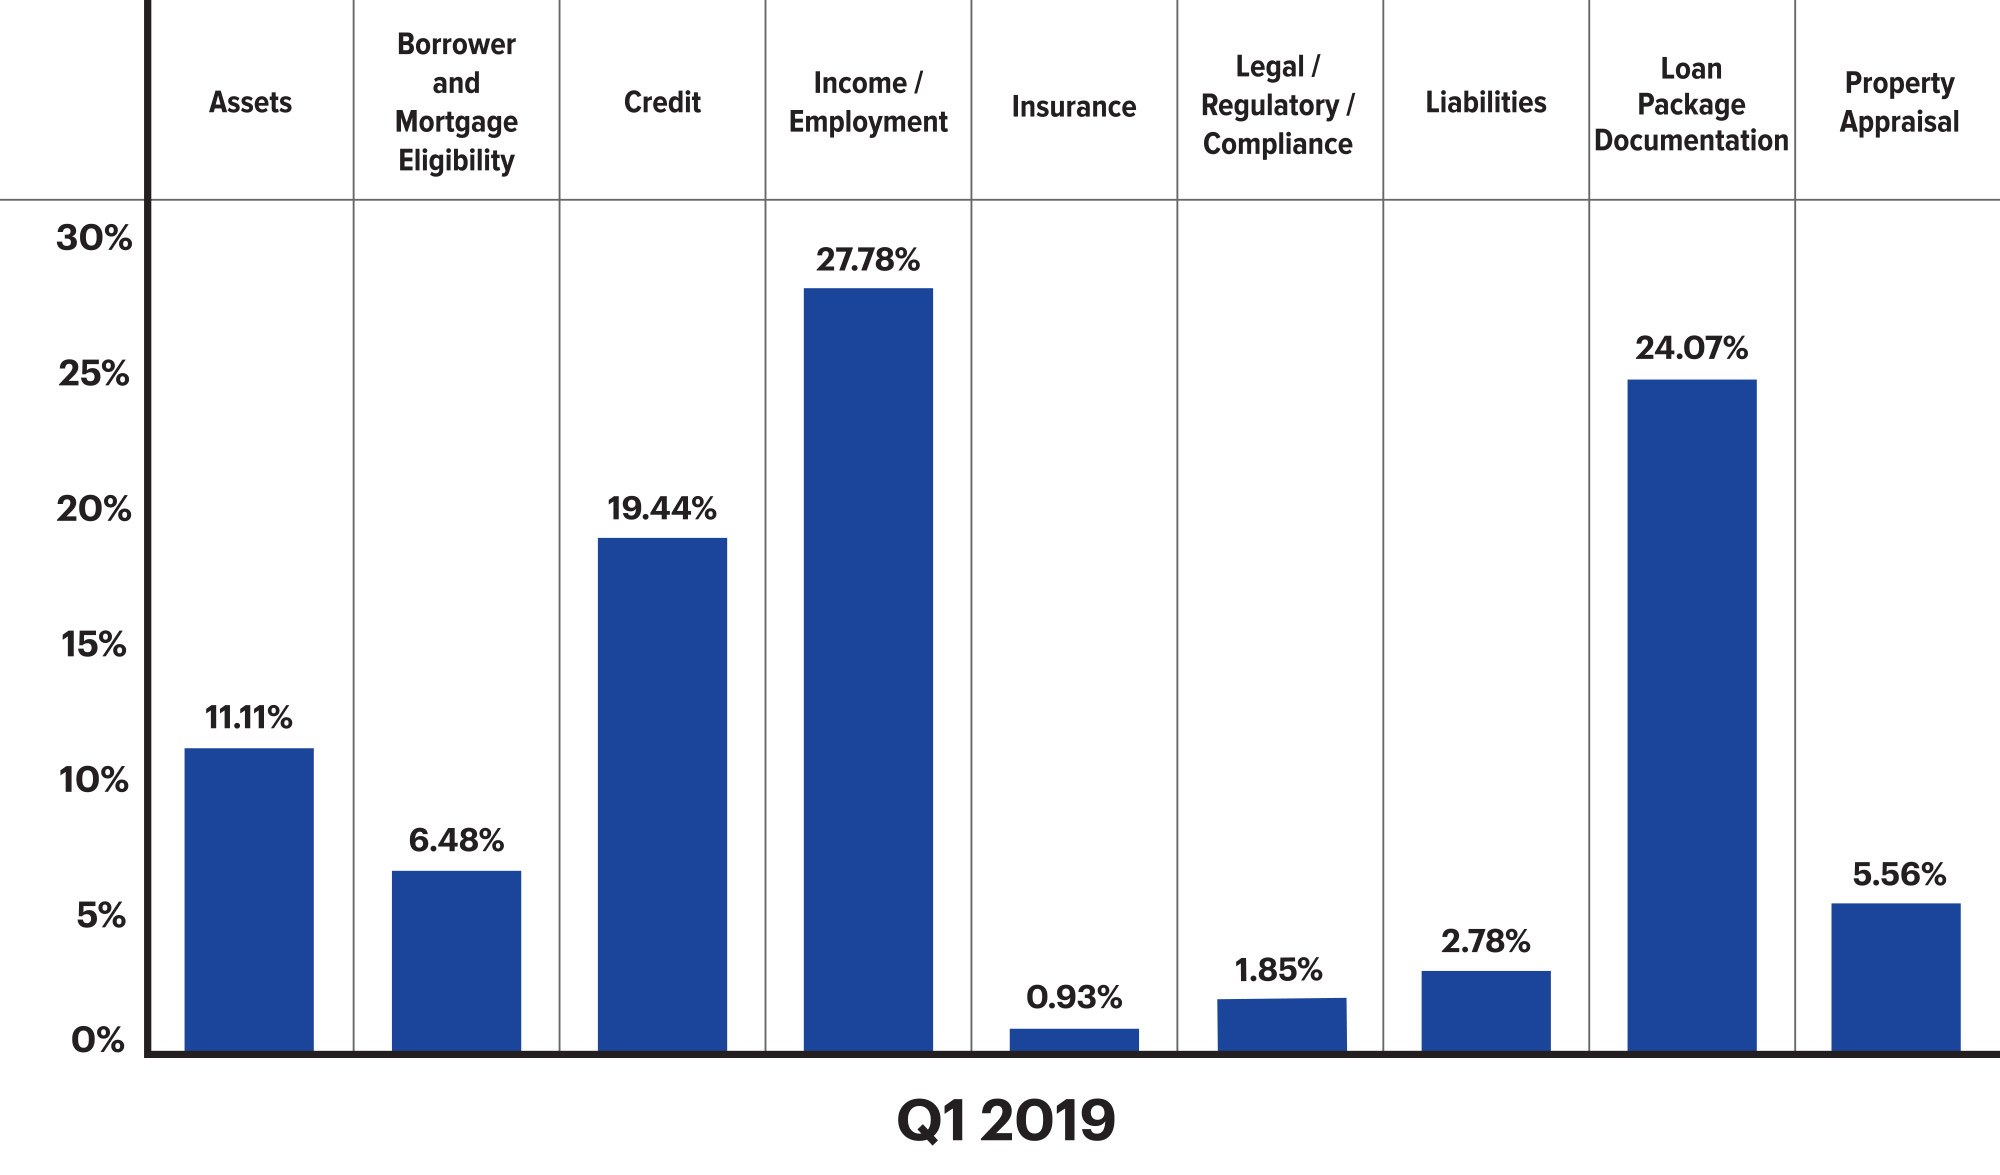
Figure 2: Q1 2019 net critical defects as a percentage of all critical defects, segmented according to Fannie Mae defect category
Within the Income/Employment category, defects related to Income Documentation (aged/missing/unsatisfactory income documents) were the largest contributors. In the Loan Package Documentation category, defects related to Closing/Title documents were the greatest contributors and likely the primary culprit behind the category’s rise to the second highest defect category in Q1 2019. In the Credit category, Credit Eligibility (minimum credit score, open collections, significant derogatory credit, unacceptable mortgage history, outstanding liens/judgments) comprised the majority of defects.
Taking a more granular look at the data and understanding the specific defect area can inform a lender’s discretionary sampling going forward and, in some cases, where systemic issues are noted, help inform corrective action plans when necessary.
Figure 3 shows the leading sub-categories for the top three defect categories.
Critical Defects by Fannie Mae, by sub-categories: Q1 2019
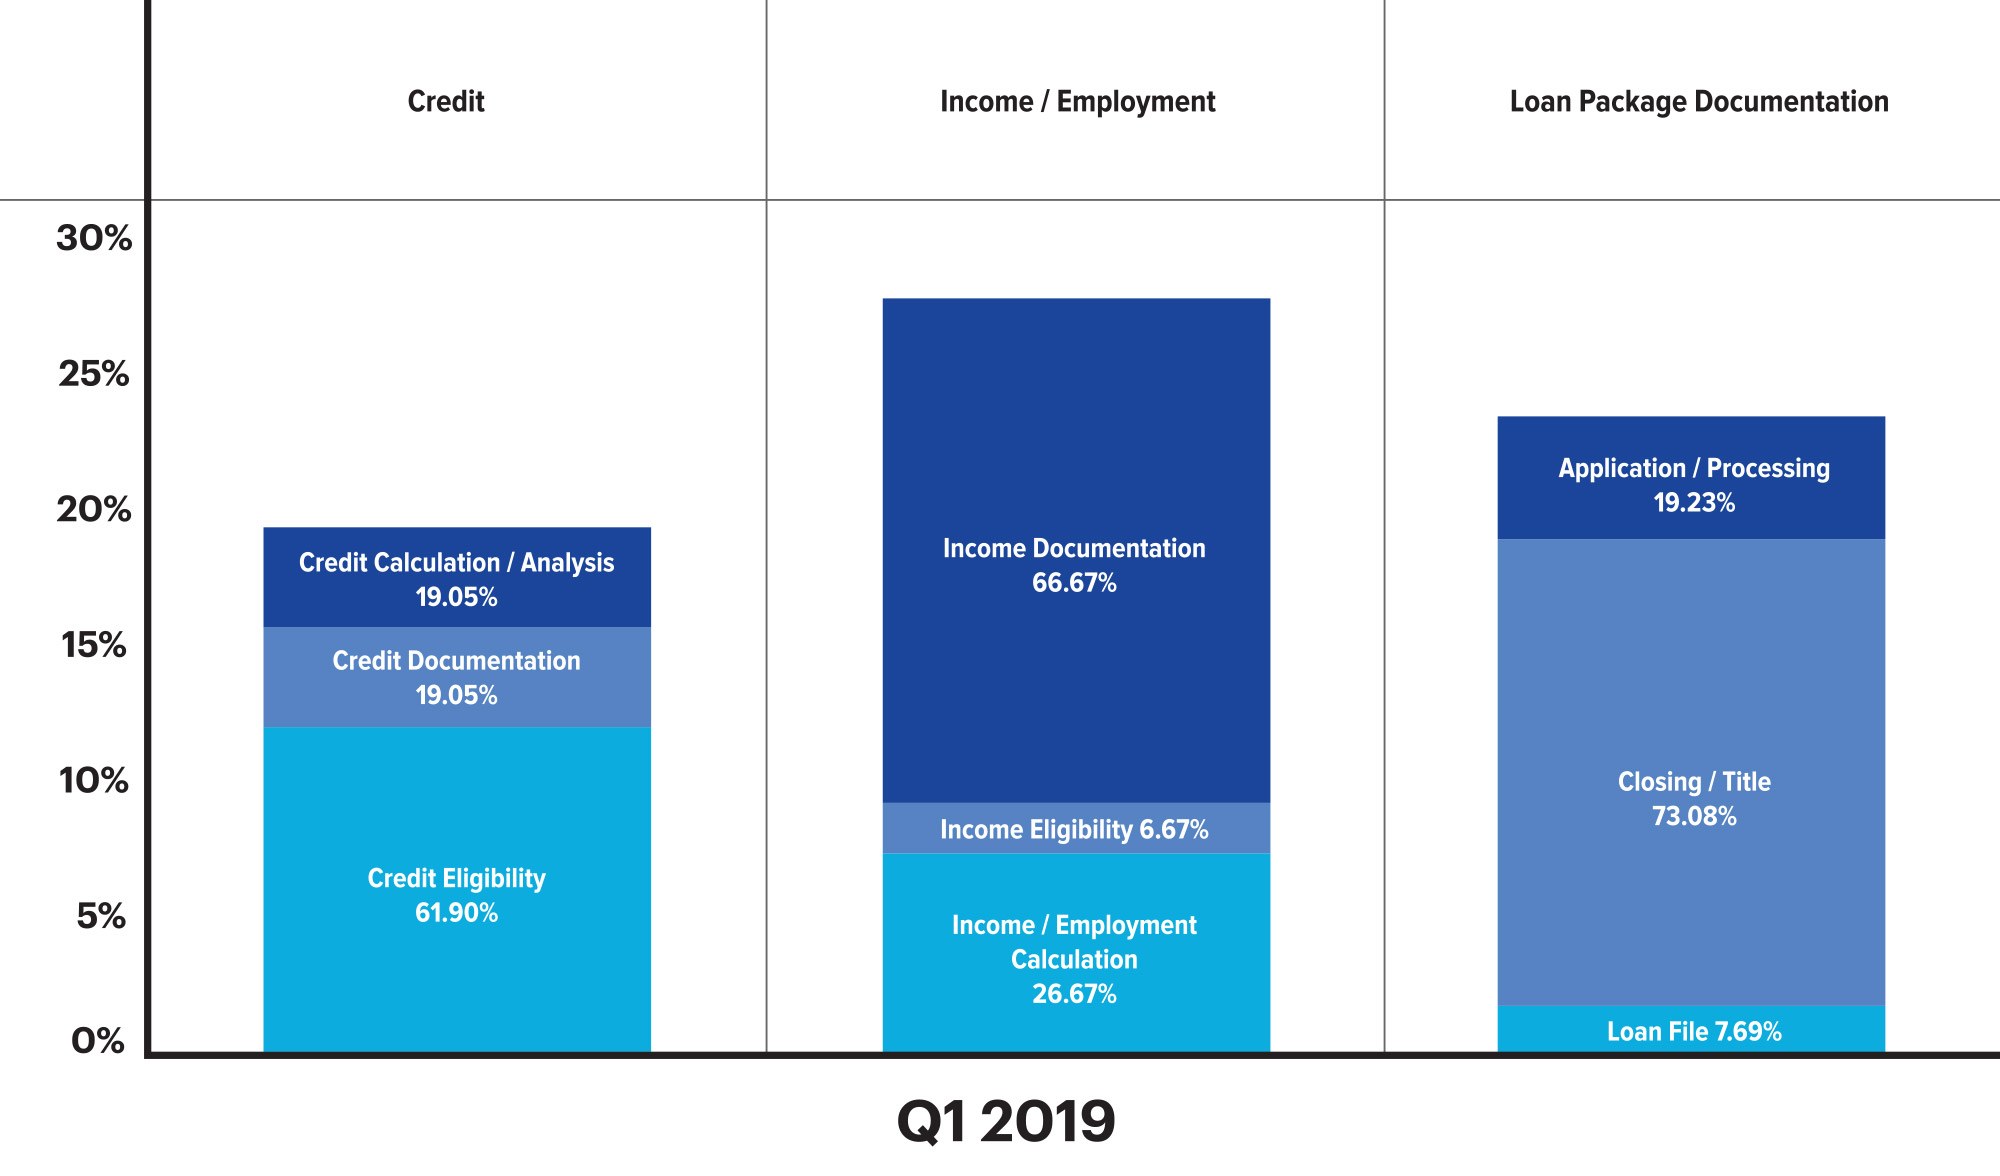
Figure 3: Fannie Mae defect sub-categories, as a percentage of the overall defect category
In Q1 2019, defects related to Income/Employment accounted for 27.78% of all loans with a critical defect. This represents a 36% increase over the previous quarter, where Income/Employment accounted for 20% of all critical defects. In Q3 2018, this category was as low as 13%.
Defects related to Loan Package Documentation rose from the third most frequently occurring defect category in Q4 2018 to the second most frequently occurring in Q1 2019. Defects attributed to Loan Package Documentation spiked 55%, reaching 24% of all loans with a critical defect, up from 16% in Q4 2018. Documentation-related defects tend to fluctuate more quarter-to-quarter than other categories and can be more pronounced in a purchase-driven market. This is due to the greater document-related requirements of purchase loans. Purchase transactions are generally more complex than refinances and take longer to close. Therefore, more documents tend to expire with purchase transactions.
In Q1 2019, Credit-related defects fell to the third most frequently occurring defect type from its second-place ranking in Q4 2018. Four of the eight critical defect categories saw increases over the previous quarter. The other four realized decreases. The increasing categories were Income/Employment, Credit, Loan Package Documentation, and Appraisal. The decreasing categories were Borrower/Mortgage Eligibility, Regulatory Compliance, Liabilities and Assets decreased. Regulatory compliance defects declined 68% from Q4 2018 which is an indication that lenders have adapted to the post TRID regulatory landscape and made the necessary investments to ensure compliance.
Figure 4 shows a quarter-over-quarter comparison of critical defects: Q4 2018 vs. Q1 2019
Critical Defects by Fannie Mae Category: Q4 2018 vs. Q1 2019
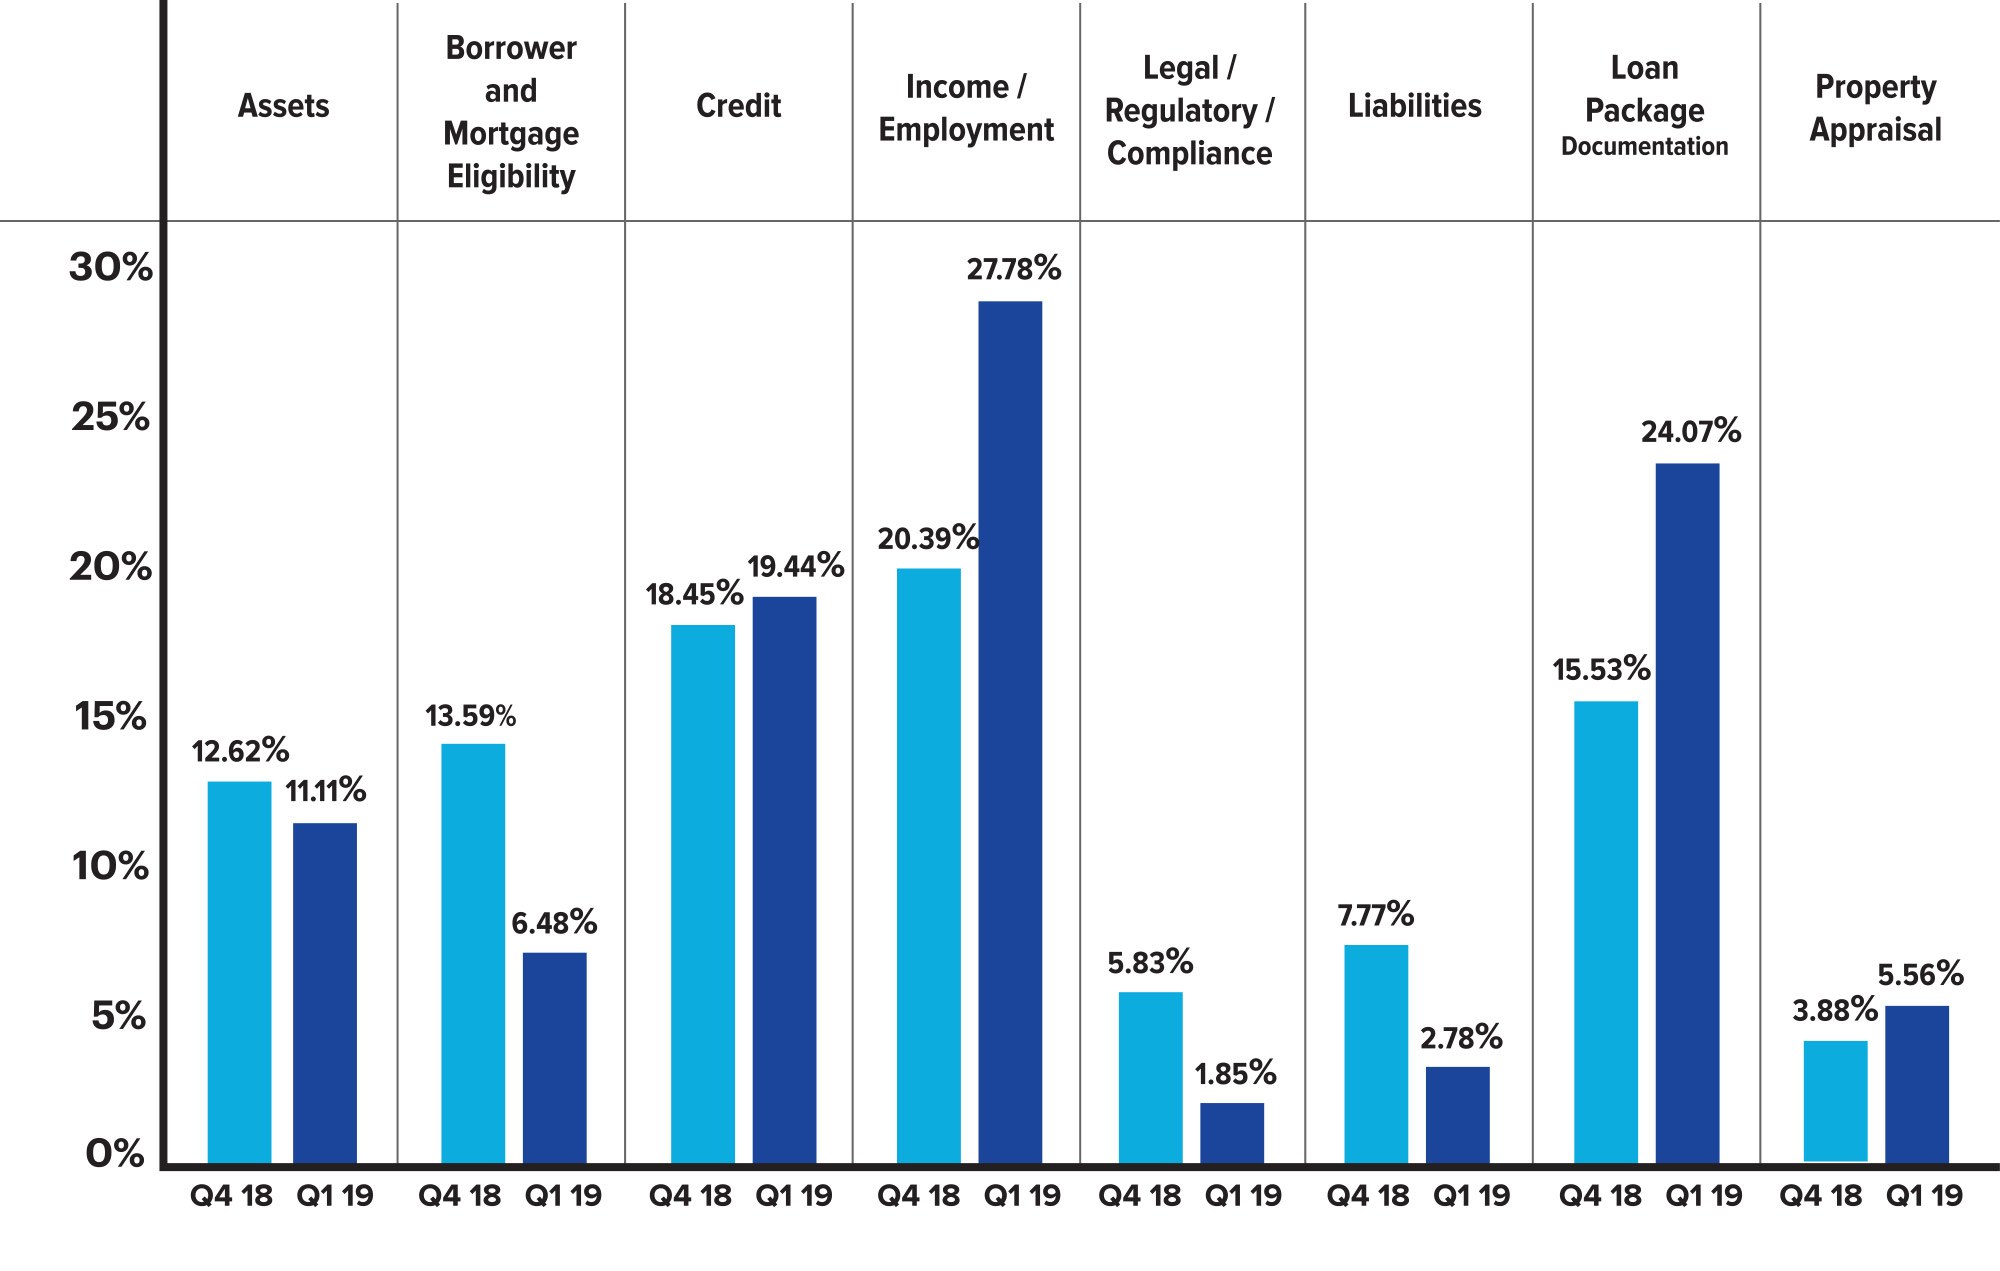
Figure 4: Q4 2018 vs. Q1 2019 share of net critical defects according to Fannie Mae Category
QC Industry Trends by Loan Purpose
Lower interest rates in Q1 2019 positively influenced refinance volumes. Refinance transactions comprised 28.47% of all transactions reviewed in Q1 2019, a 13% increase over Q4 2018, when refinances comprised only 25.28% of transactions reviewed.
Refinance transactions are historically associated with lower critical defect rates. Thus, increases in the percentage of refinance transactions will positively impact overall critical defect rates. Such was the case in Q1 2019.
In Q1 2019, purchase transactions represented roughly 72% of all reviewed loans but comprised over 80% of all critical defects. This disparity represents a slight increase over the previous quarter, where the differential was 3% — purchase transactions comprised 75% of all reviewed loans but 78% of all critical defects. In contrast, refinance transactions in Q1 2019 performed better, comprising roughly 28% of all reviewed loans but only 20% of the critical defects.
Figure 5 provides a comparison of loan performance between purchase and refinance transactions for Q1 2019.
Loans Reviewed vs. Critical Defects by Loan Purpose: Q1 2019
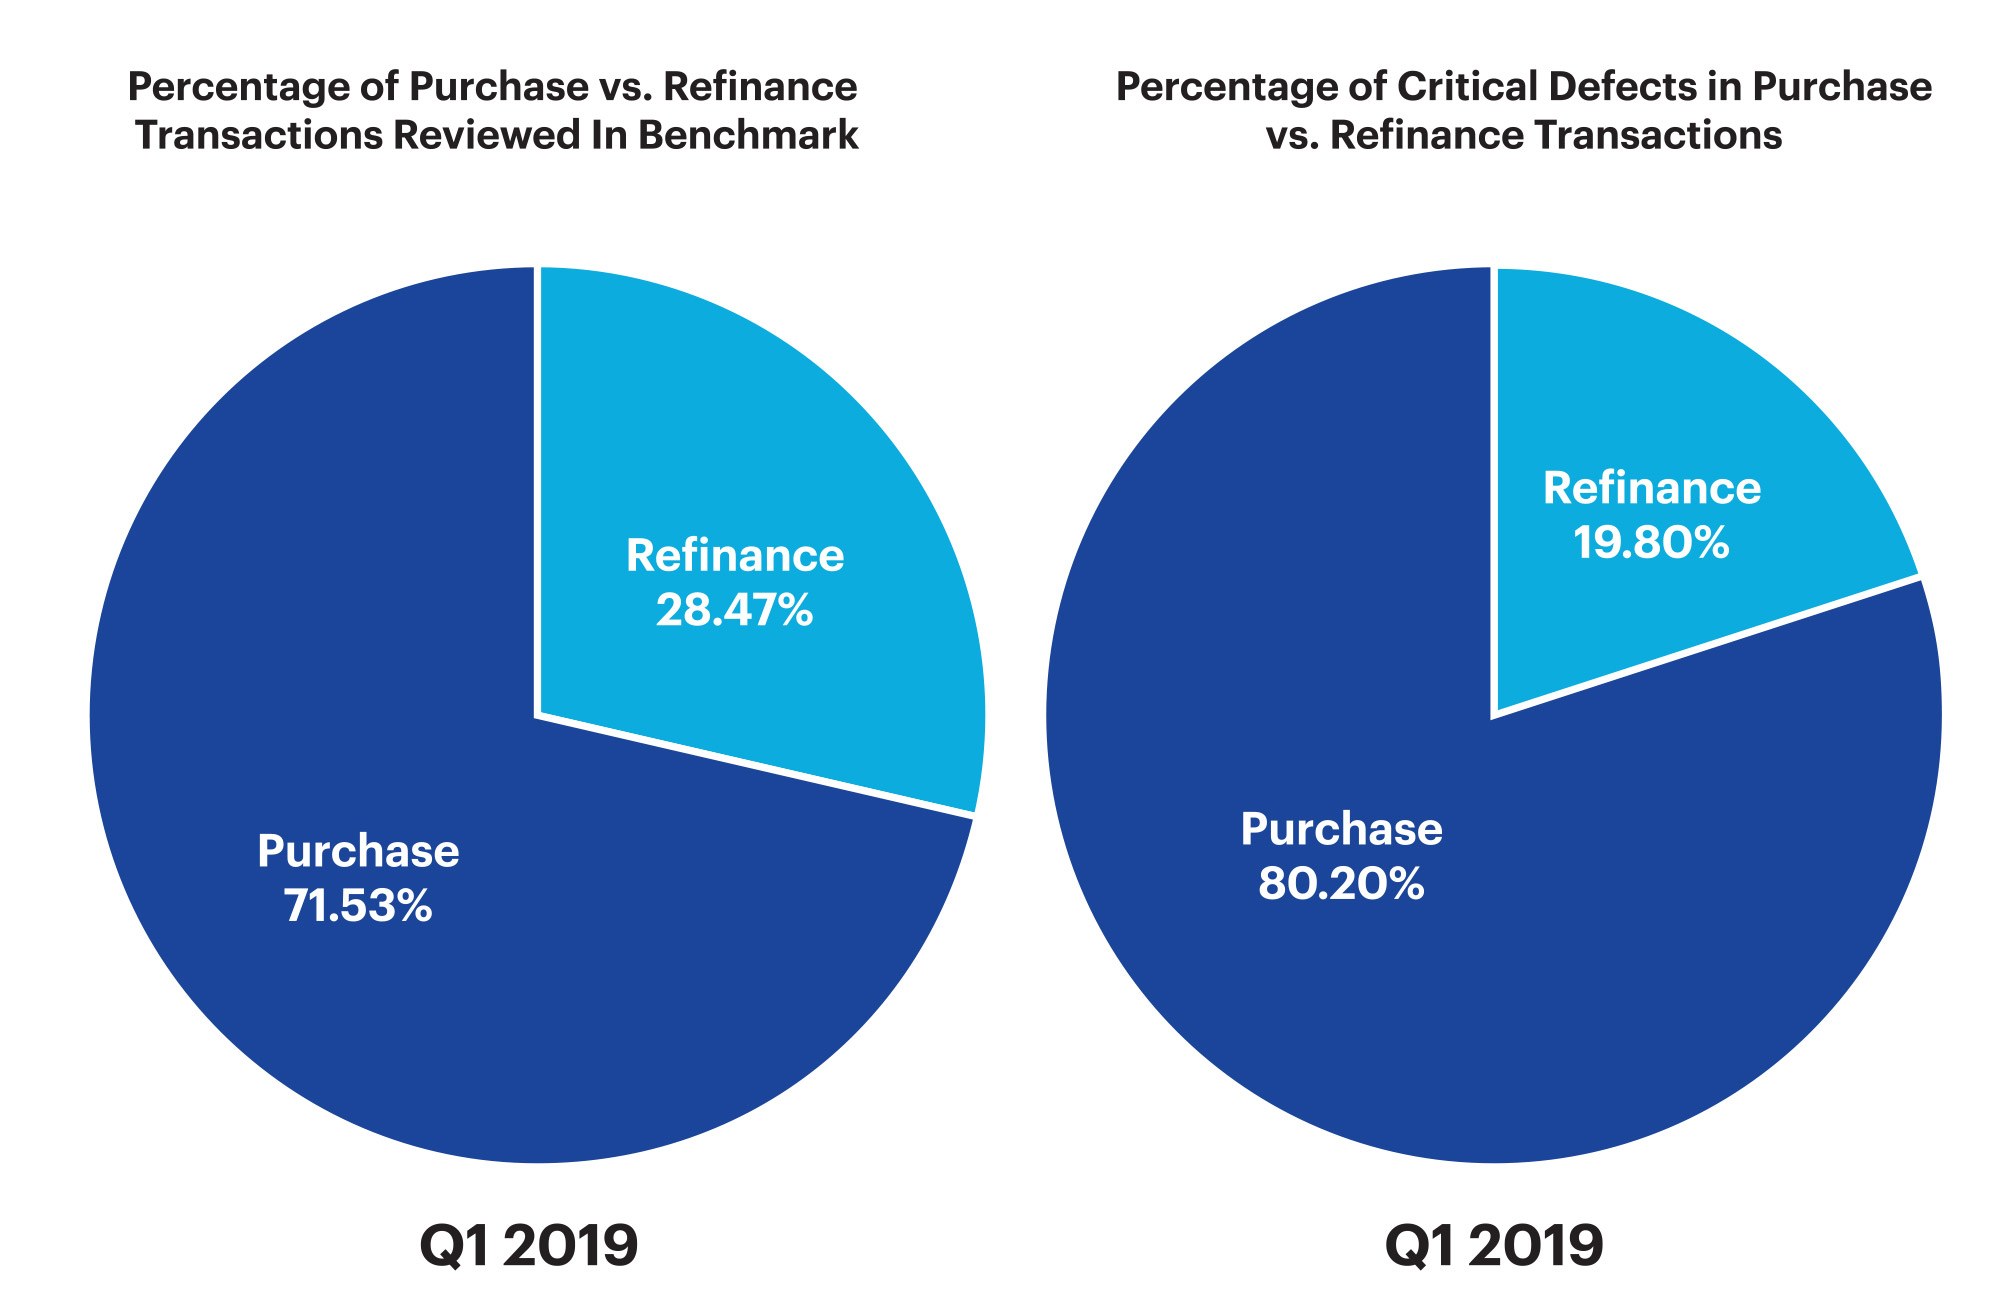
Figure 5: Q1 2019 proportional comparison of the percentage of loans reviewed and percentage of all critical defects, according to loan purpose
QC Industry Trends by Loan Type
The Q1 2019 product mix varied significantly from the previous quarter. Government-insured loan production represented 41% of all loans reviewed. This is markedly higher than the average percentage throughout CY 2018, where government loans represented 31% of the critical defect benchmark.
In terms of defect rates, government loans tend to outperform other products in environments where the number of refinance transactions is increasing. In particular, because of their structure, FHA Streamline and VA IRRRL loans tend to have nominal defect rates. This likely contributed to the lower overall critical defect rates in Q1 2019.
Conventional loans continued to perform well in Q1 2019. Loans originated to Fannie Mae and Freddie Mac guidelines comprised 59% of the benchmark but only 43% of all critical defects, as compared with 49% of all defects in CY 2018. FHA loans, however, produced the greatest spread with 31% of loans in the benchmark and 47% of all defects. While this 16% spread was higher than in prior quarters, the overall percent of defects (47%) for FHA loans was lower than Q4 2018, which reached 49%.
Figure 6 provides a comparison of loan performance among all loan types in the benchmark (conventional, FHA, VA and USDA).
Critical Defects as a Percentage of All Loan Types: Q1 2019
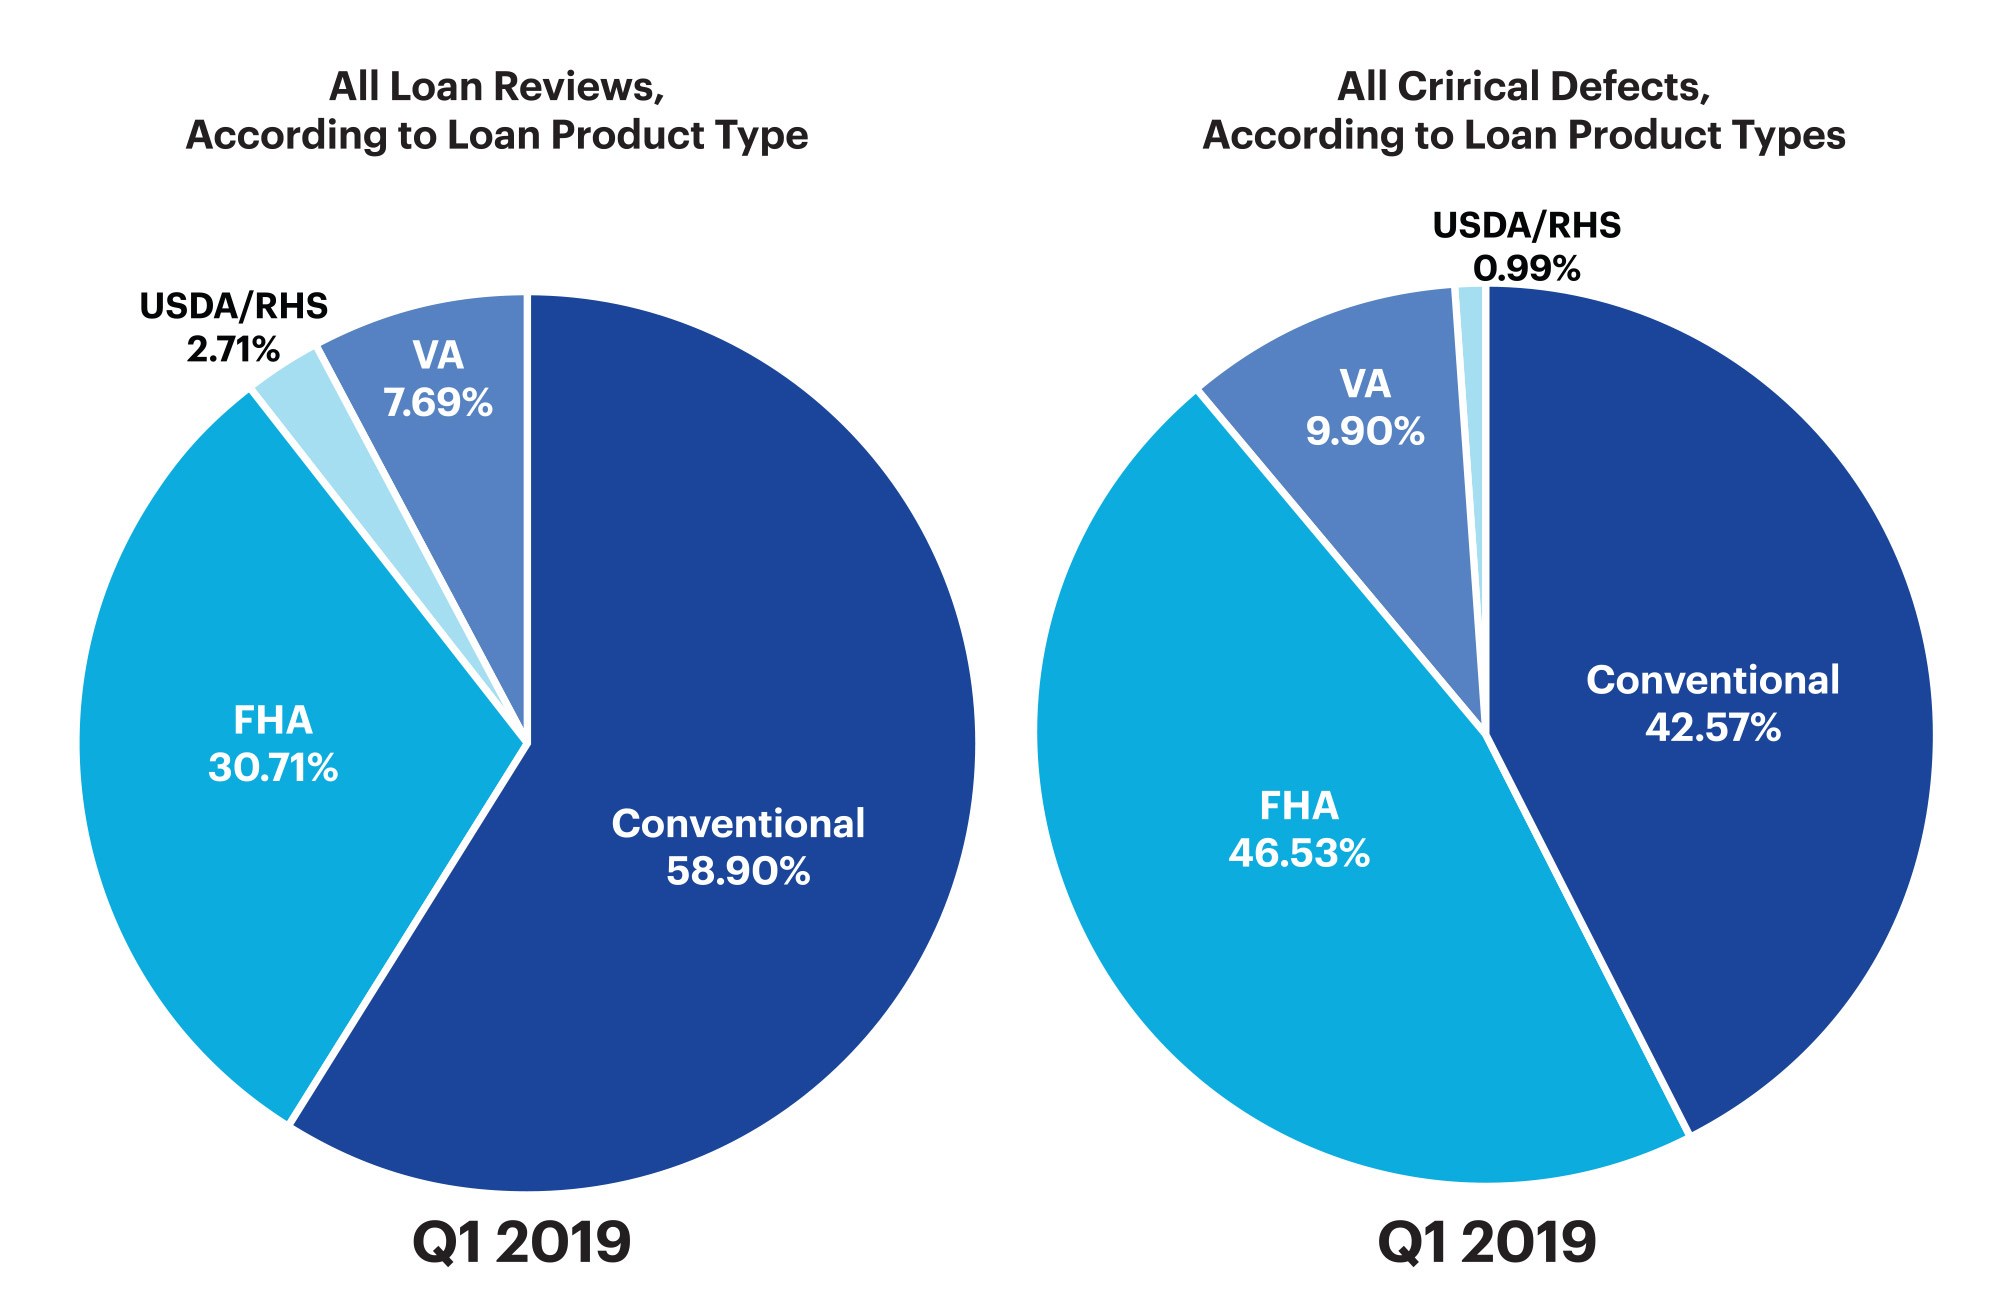
Figure 6: Q1 2019 loans reviewed by loan type, and percentage of all critical defects by loan type
Conclusion
As expected, Q1 2019 demonstrated that defect rates improve as the lending environment improves. Even so, defects related to core underwriting and eligibility functions continued to increase. More defects were attributed to Income/Employment than any other defect category. This occurrence raises concerns about credit quality and the general profile of borrowers applying for loans at the end of a sustained period of historically low interest rates. Assuming the continued escalation of refinance volume, we can expect continued improvement in loan performance.
There is no doubt that the environment overall improved for lenders. Profitability among mortgage lenders hit a low point in Q4 2018 but has recovered quite well. The Mortgage Bankers Association (MBA) reports lenders lost $200 per loan in 2018. In Q1 2019, the MBA shows an average profit of $285 per loan. Profitability is the result of many factors, including origination volumes. The dip in loan quality during the second half of 2018 is indicative of lenders transitioning in a lower volume market.
HUD (Department of Housing and Urban Development) has tightened appraisal requirements and guidelines, lowered the equity threshold for cash-out refinances, and required more loans to be manually underwritten. Fannie Mae recently proposed changes to its statistical sampling methodology that could result in lenders performing more post-close quality control reviews.
These changes should better position the industry to withstand any future downturn in the economy or the lending environment. We remain hopeful that the deterioration in loan quality in 2018 was an anomaly and that a better volume environment in 2019 will raise quality across the board.
About the ARMCO Mortgage QC Industry Trends Report
The ARMCO Mortgage QC Industry Trends Report represents a nationwide post-closing quality control analysis using data and findings derived from mortgage lenders utilizing the ACES Analytics benchmarking software.
This report provides an in-depth analysis of residential mortgage critical defects as reported during post-closing quality control audits. Data presented comprises net critical defects and is categorized in accordance with the Fannie Mae loan defect taxonomy.
About ARMCO
Over half of the Top 20 mortgage lenders in the U.S. choose ARMCO as their provider of risk management software. ARMCO’s product line includes loan quality enterprise software, services, data and analytics. Its flagship product, ACES Flexible Audit Technology®, has set the bar for user definability in its category. It is used at virtually every point in the mortgage lifecycle, as well as for a wide range of risk-prone business operations outside traditional mortgage origination and servicing. ARMCO’s consultative approach to customer relationships leverages 25 years of mortgage risk intel, assuring that its clients are using the most effective risk mitigation strategies, and are using the fastest, most reliable, most efficient means for preventing risk-related loss. ARMCO distributes the ARMCO Mortgage QC Industry Trends Report, a free quarterly analysis of industry-wide mortgage loan quality. For more information, visit www.acesquality.com or call 1-800-858-1598.
MEDIA CONTACT:
Jeri Yoshida
Yosh Communications
jeri@yoshcomm.com
310 651 0057