ARMCO’s Mortgage QC Industry Trends Report represents an analysis of nationwide quality control findings based on data derived from the ACES Analytics benchmarking software.
Executive Summary
QC Industry Trends – Overview
QC Industry Trends – by Category
QC Industry Trends – by Loan Purpose
QC Industry Trends – by Loan Type
Conclusion
About this Report
Executive Summary
This report represents an analysis of post-closing quality control data derived from loan files analyzed by the ACES Analytics benchmarking system, during the second quarter of 2018 (Q2 2018).
Findings for the Q2 2018 Trends Report were based on post-closing quality control data from over 90,000 unique loans. All reviews and defect data that were evaluated for this report were based on loan audits selected by lenders for full file reviews.
Defects are categorized using the Fannie Mae loan defect taxonomy. Data for any given calendar quarter is analyzed no earlier than 90 days after the end of the quarter, which allows sufficient time for lenders to complete the post-closing quality control cycle. Hence, ARMCO releases analyses for Q2 2018 in Q4 2018.
Summary of Findings
The leading critical defect categories for Q2 2018 were (1) Income/Employment, (2) Loan Package Documentation and (3) Assets. Purchase transactions continued to outpace refinances in Q2 2018, comprising 73.74% of all transactions reviewed.
Report highlights include the following findings:
- In Q2 2018, the critical defect rate slightly decreased from 1.72% to 1.71%.
- Q2 2018 continued the Q1 2018 distribution trend for critical defects, with the majority attributed to the Income/Employment category.
- In Q2 2018, the number of defects attributed to Borrower and Mortgage Eligibility increased to 11.36%, an increase of roughly 70% over the previous quarter’s rate of 6.57%.
- In Q2 2018, critical defects were most frequently related to core underwriting and eligibility issues, a trend that has continued since the first quarter of 2017.
- Q2 2018 represents the second consecutive quarter to see a significant increase in the number of defects related to Loan Package Documentation – these defects, which increased 23.8% over the previous quarter, are often associated with downsizing and understaffing.
QC Industry Trends – Overview
In Q2 2018, interest rates continued to rise, leaving little incentive for homeowners to refinance. Purchase transactions continued to dominate originations and in response to lower overall production volume, lenders and the secondary market expanded guidelines in hopes of providing financing to a larger population.
In Q2 2018, the critical defect rate remained relatively steady, dropping to 1.71% from the previous quarter’s rate of 1.72%, a decrease of 0.006%.
NOTE: A critical defect is defined as a defect that would result in the loan being uninsurable or ineligible for sale. The critical defect rate reflects the percentage of loans reviewed for which at least one critical defect was identified during the post-closing quality control review and all reported defects are net defects.
Figure 1 displays critical defect rates—the number of loans containing at least one critical defect as a percentage of the total closed loans reviewed—for the past four calendar quarters. All loans reviewed are part of a lenders’ monthly random post-closing quality control review.
Critical Defect Rate by Quarter: Q2 2018
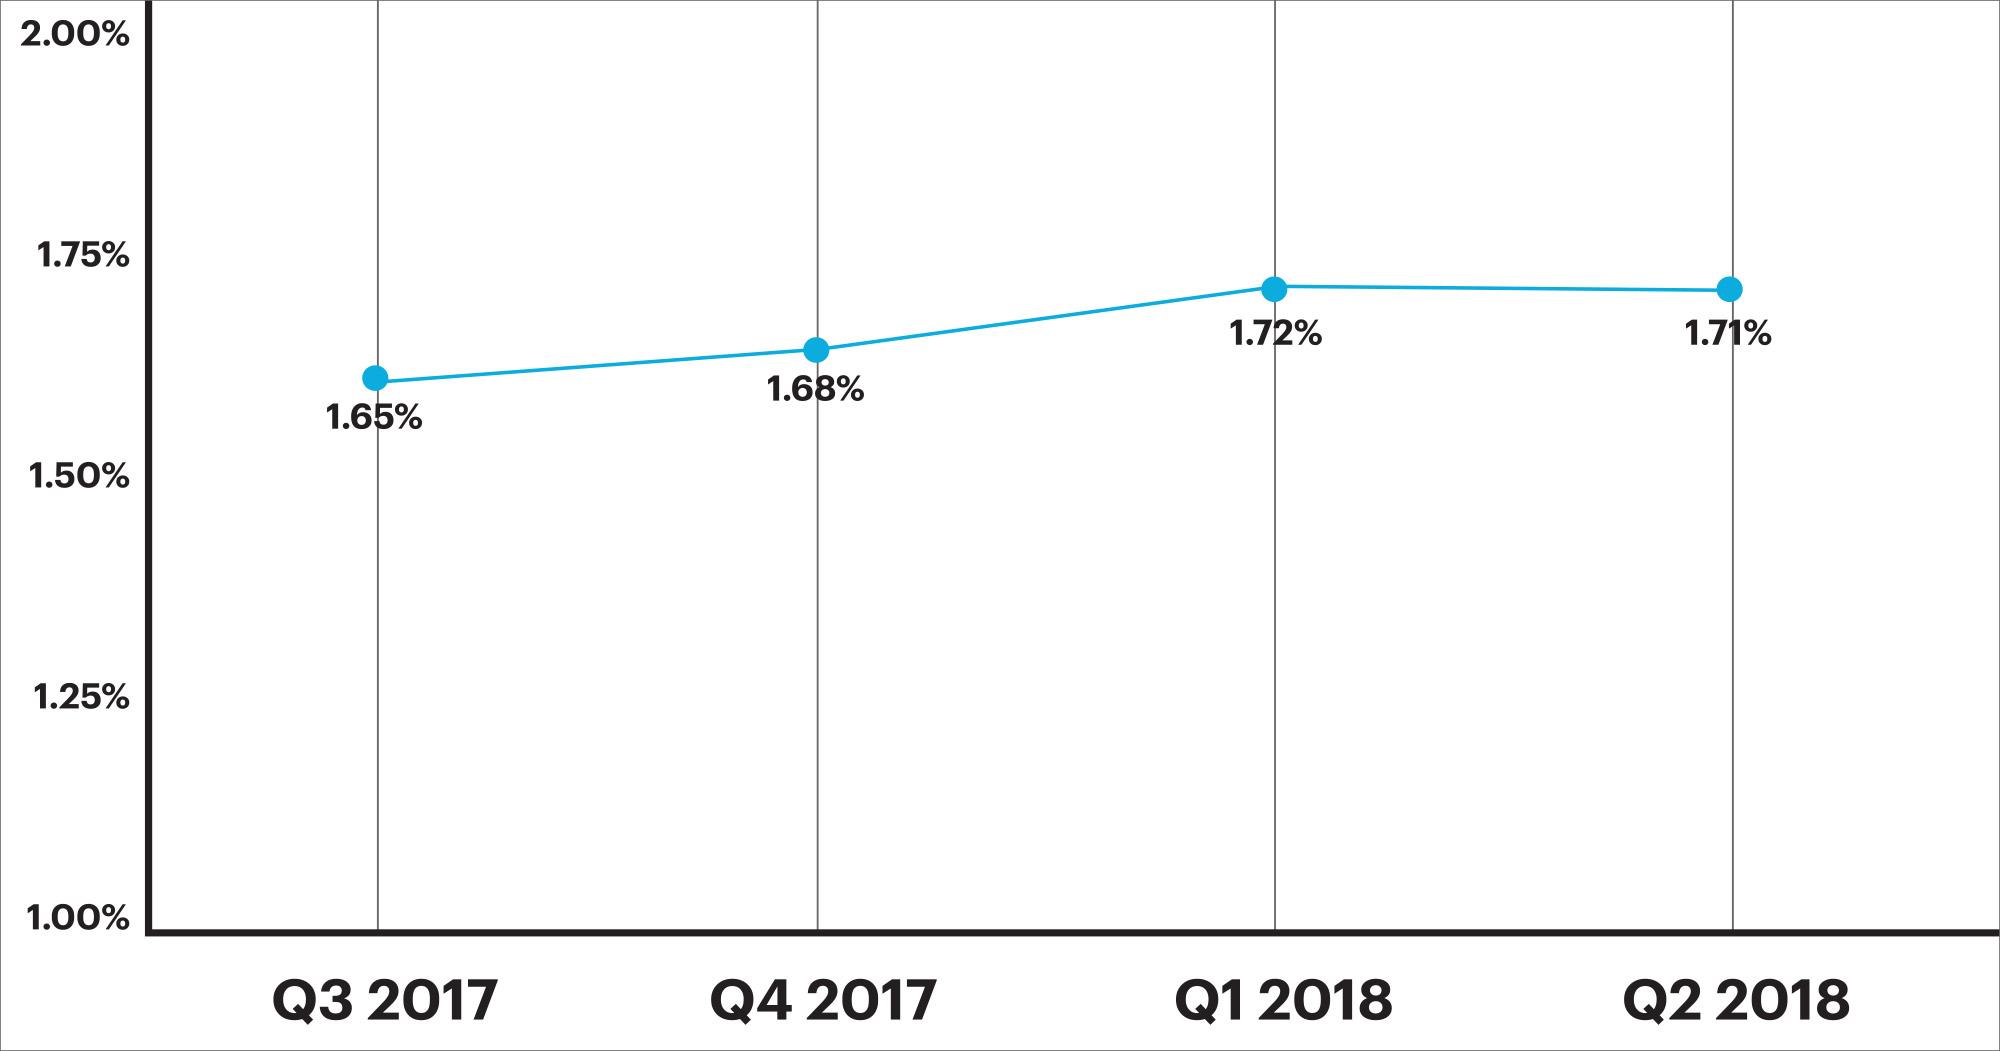
Figure 1: Percentage of loans with critical defects by quarter, Q3 2017 through Q2 2018
QC Industry Trends by Defect Category
In Q2 2018, the distribution of critical defects reflected the market’s higher percentage of purchase transactions over refinances, as well as its declining number of originations. In reaction to this contracting market, lender downsizing and staff consolidation started to become evident earlier this year.
The top three defect categories were Income/Employment, Loan Package Documentation, and Assets, which accounted for 22.73%, 19.89% and 17.61% of all critical defects, respectively.
Figure 2 shows net critical defects, sorted according to Fannie Mae defect category, for Q2 2018.
Critical Defects by Fannie Mae Category: Q2 2018
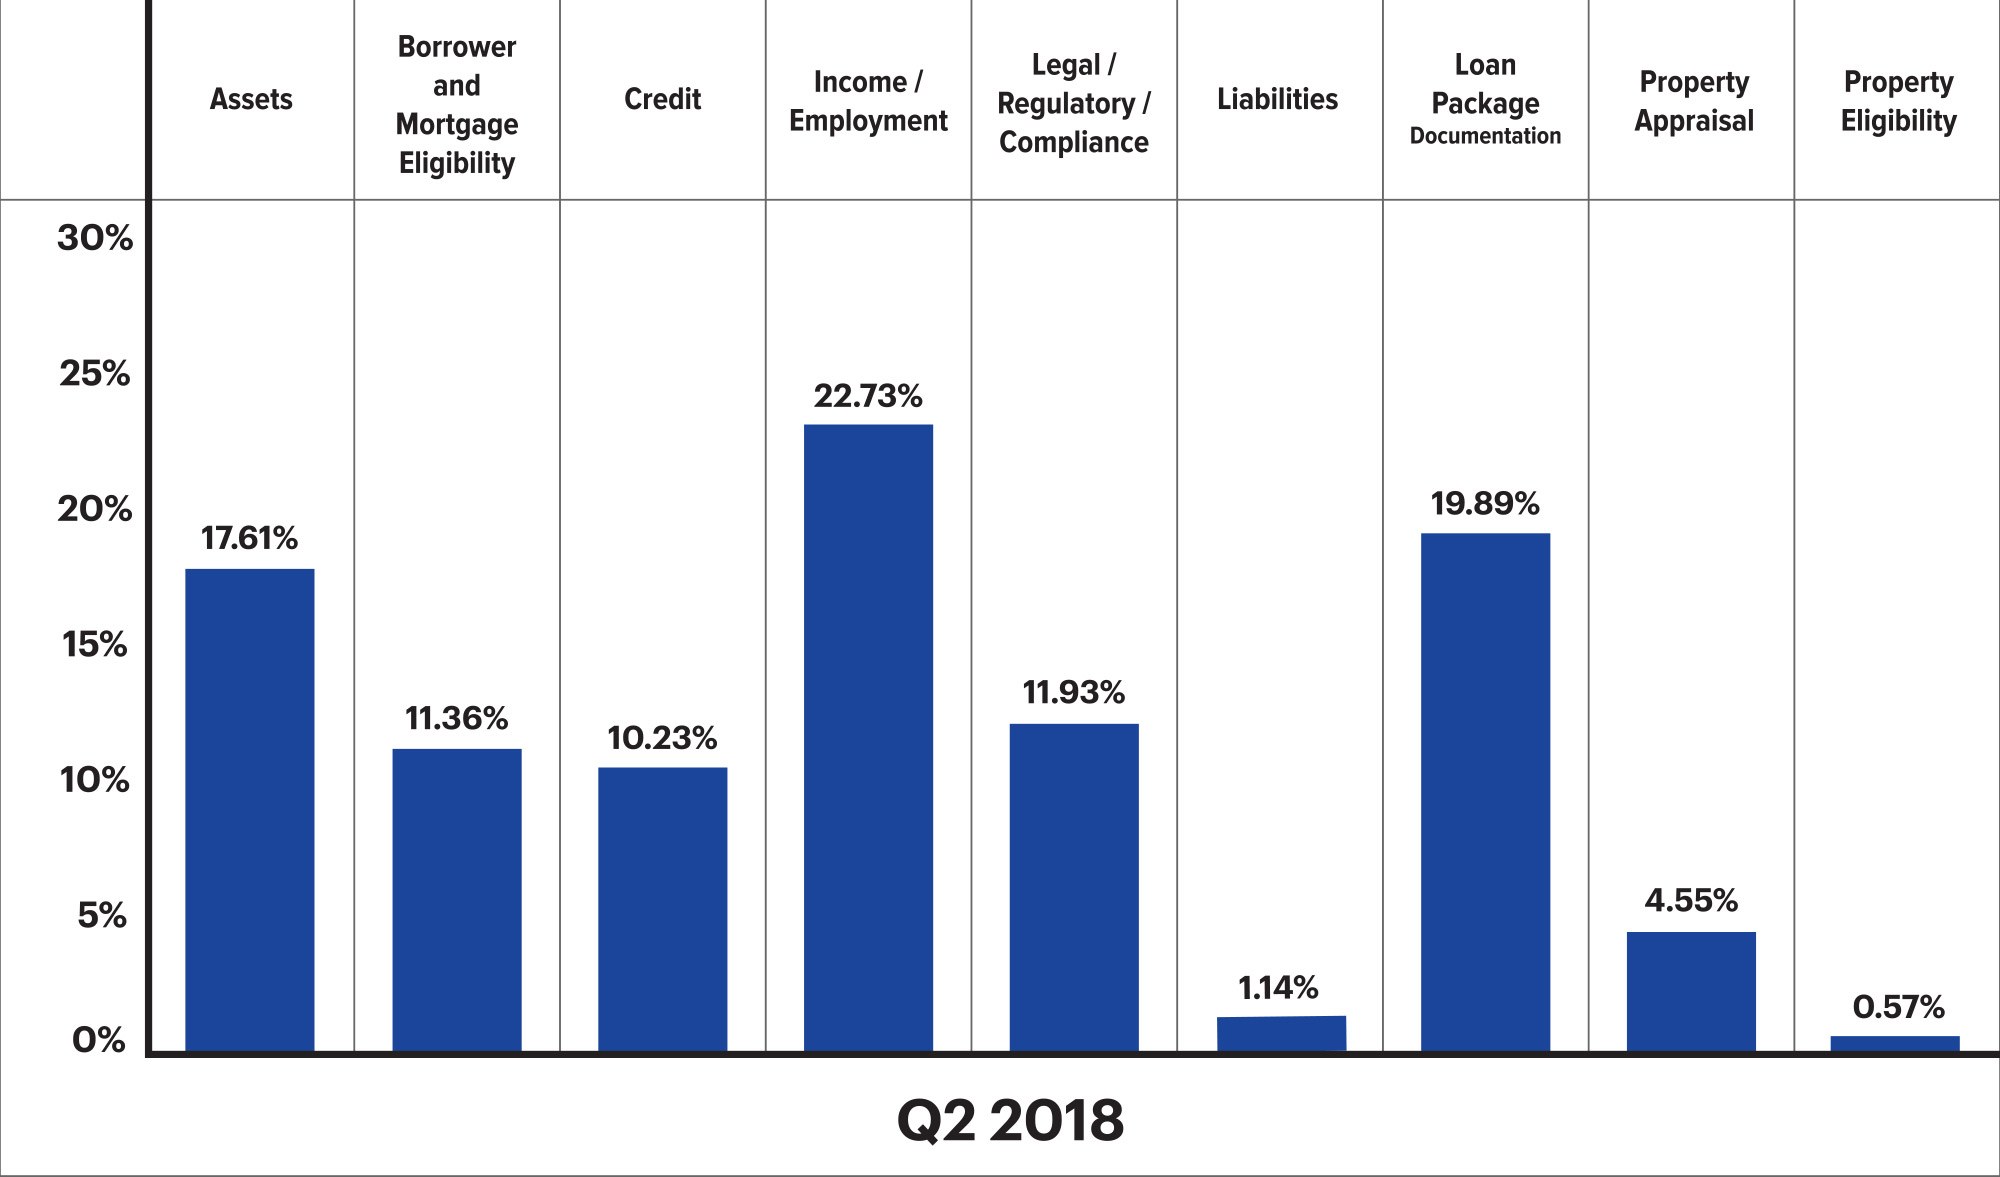
Figure 2: Q2 2018 net critical defects according to Fannie Mae defect category
The distribution of defect categories for Q2 2018 remained fairly aligned with Q1 2018. However, while Income/Employment remained the top defect category for Q1 and Q2 of 2018, the percentage of defects in this category dropped slightly from 24.82% in Q1 2018 to 22.73% in Q2 2018—a decrease of roughly 8.00%. The greatest change within a single defect category from Q1 2018 to Q2 2018 occurred in the Borrower and Mortgage Eligibility category, which increased almost 73%, from 6.57% in Q1 2018 to 11.36% in Q2 2018. Despite the drastic change, this percentage is still lower than percentages seen throughout CY2017.
Less drastic, but quite significant, was the increased percentage of defects attributed to the Loan Package Documentation category, which spiked nearly 25%, from 16.06% in Q1 2018 to 19.89% in Q2 2018. This upsurge marks the third consecutive quarter to see double digit increases in the percentage of Loan Package Documentation defects, which are often associated with the downsizing and understaffing that proliferate in contracting markets. In contrast, the percentage of defects attributed to this category in Q2 2017 was 4.17%.
Another notable change occurred among defects related to Assets, which decreased by roughly 14.00%, from 20.44% in Q1 2018 to 17.61% in Q2 2018.
Overall, the distribution of critical defects in Q2 2018 continued to weigh heavier on core underwriting and eligibility issues. The four credit-related defect categories (Assets, Borrower and Mortgage Eligibility, Credit and Income/Employment) comprised 61.93% of all critical defects for the quarter.
Figure 3 shows net critical defects, sorted according to Fannie Mae defect category, for Q1 2018 vs. Q2 2018.
Critical Defects by Fannie Mae Category: Q1 2018 vs. Q2 2018
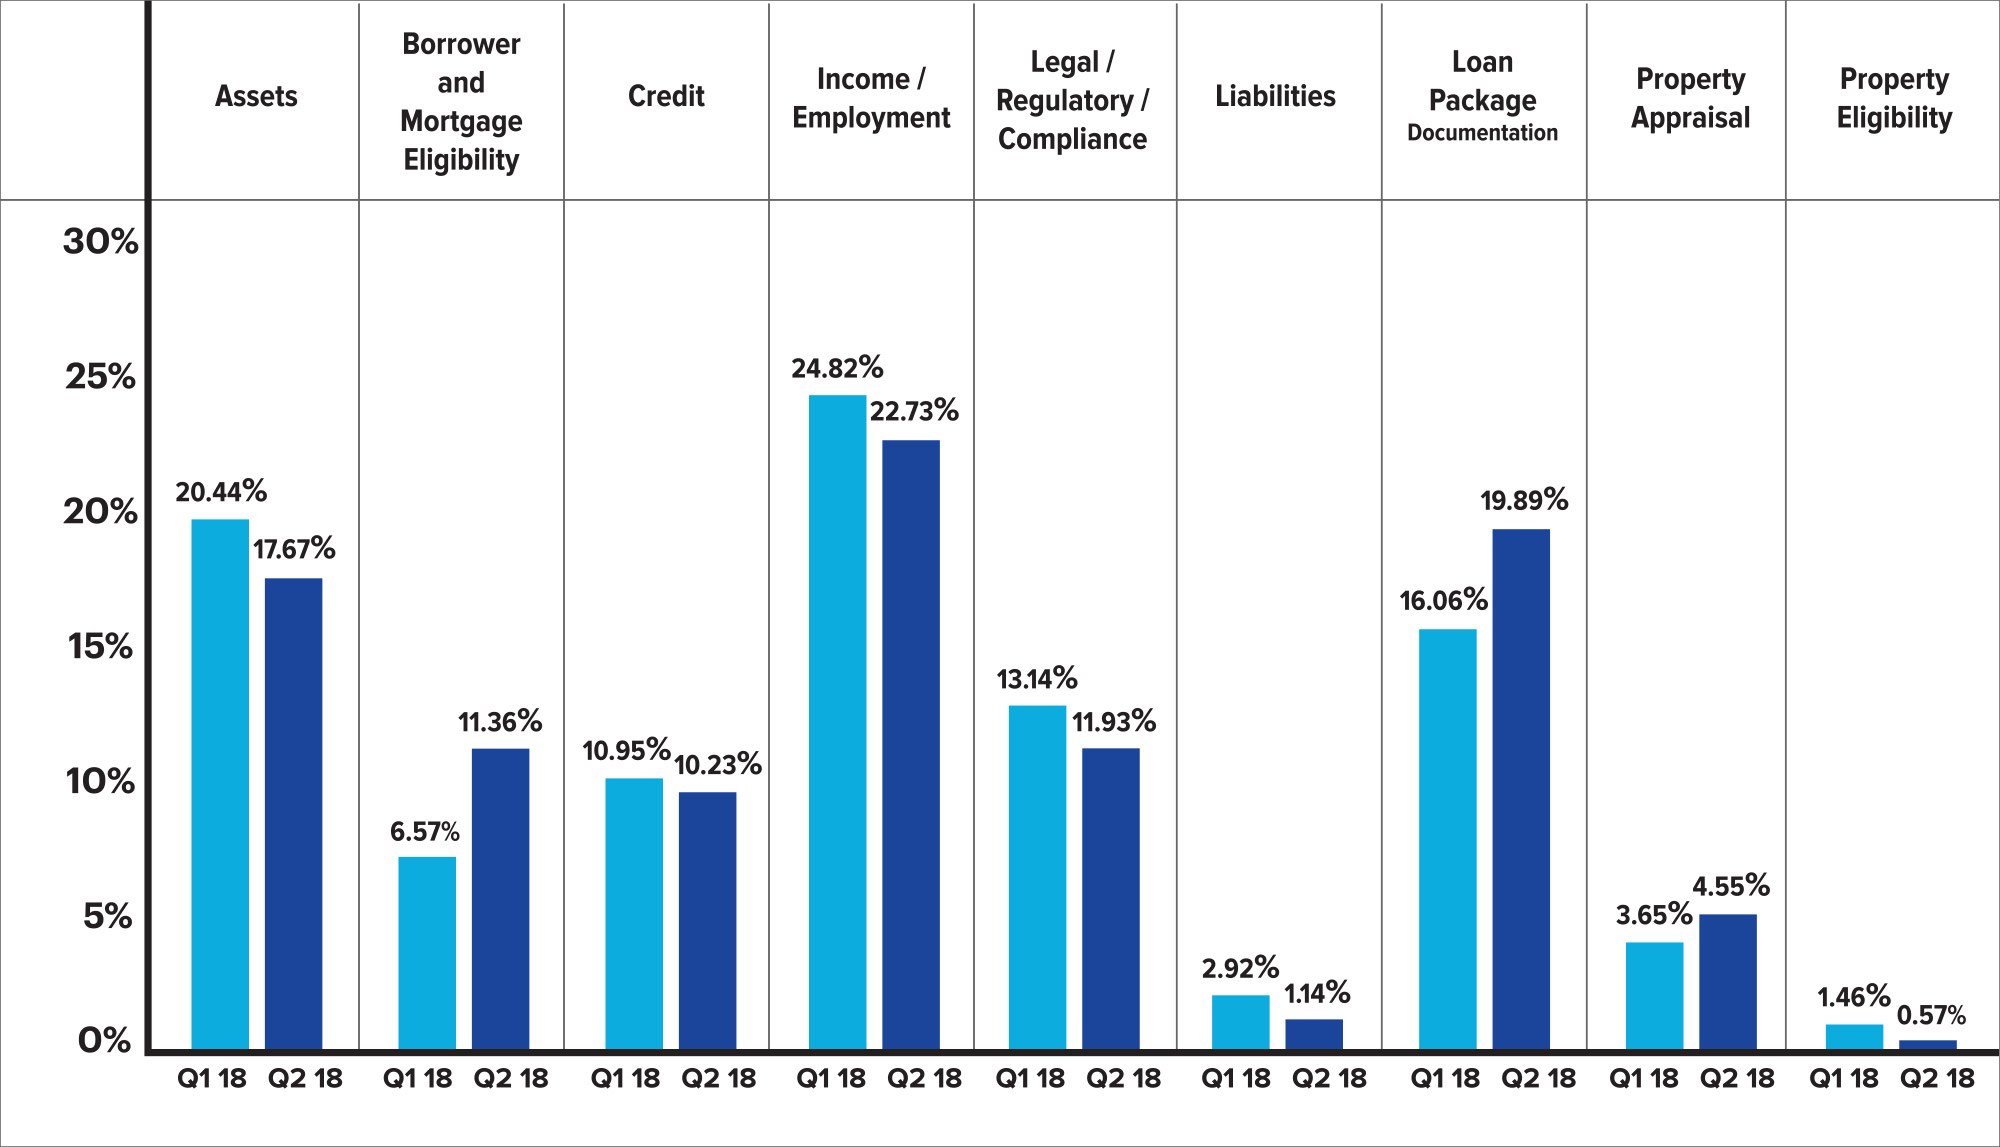
Figure 3: Q1 2018 vs. Q2 2018 net critical defects according to Fannie Mae defect category
QC Industry Trends by Loan Purpose
In Q2 2018, while purchase transactions represented roughly 74% of all reviewed loans, they accounted for over 78% of all reported critical defects. This imbalance—the percentage of critical defects reported, versus the percentage of purchase transactions of all loans in the benchmark—in- dicates that more critical defects were attributed to purchases during Q2 2018. This finding aligns with the assertion that purchase originations are typically more intricate and complex than refinance transactions, and therefore present greater risk of critical defects.
Figure 4 provides a comparison of all reviewed loans by loan purpose and all critical defects by loan purpose for Q2 2018.
Loans Reviewed and Critical Defects by Loan Type: Q2 2018
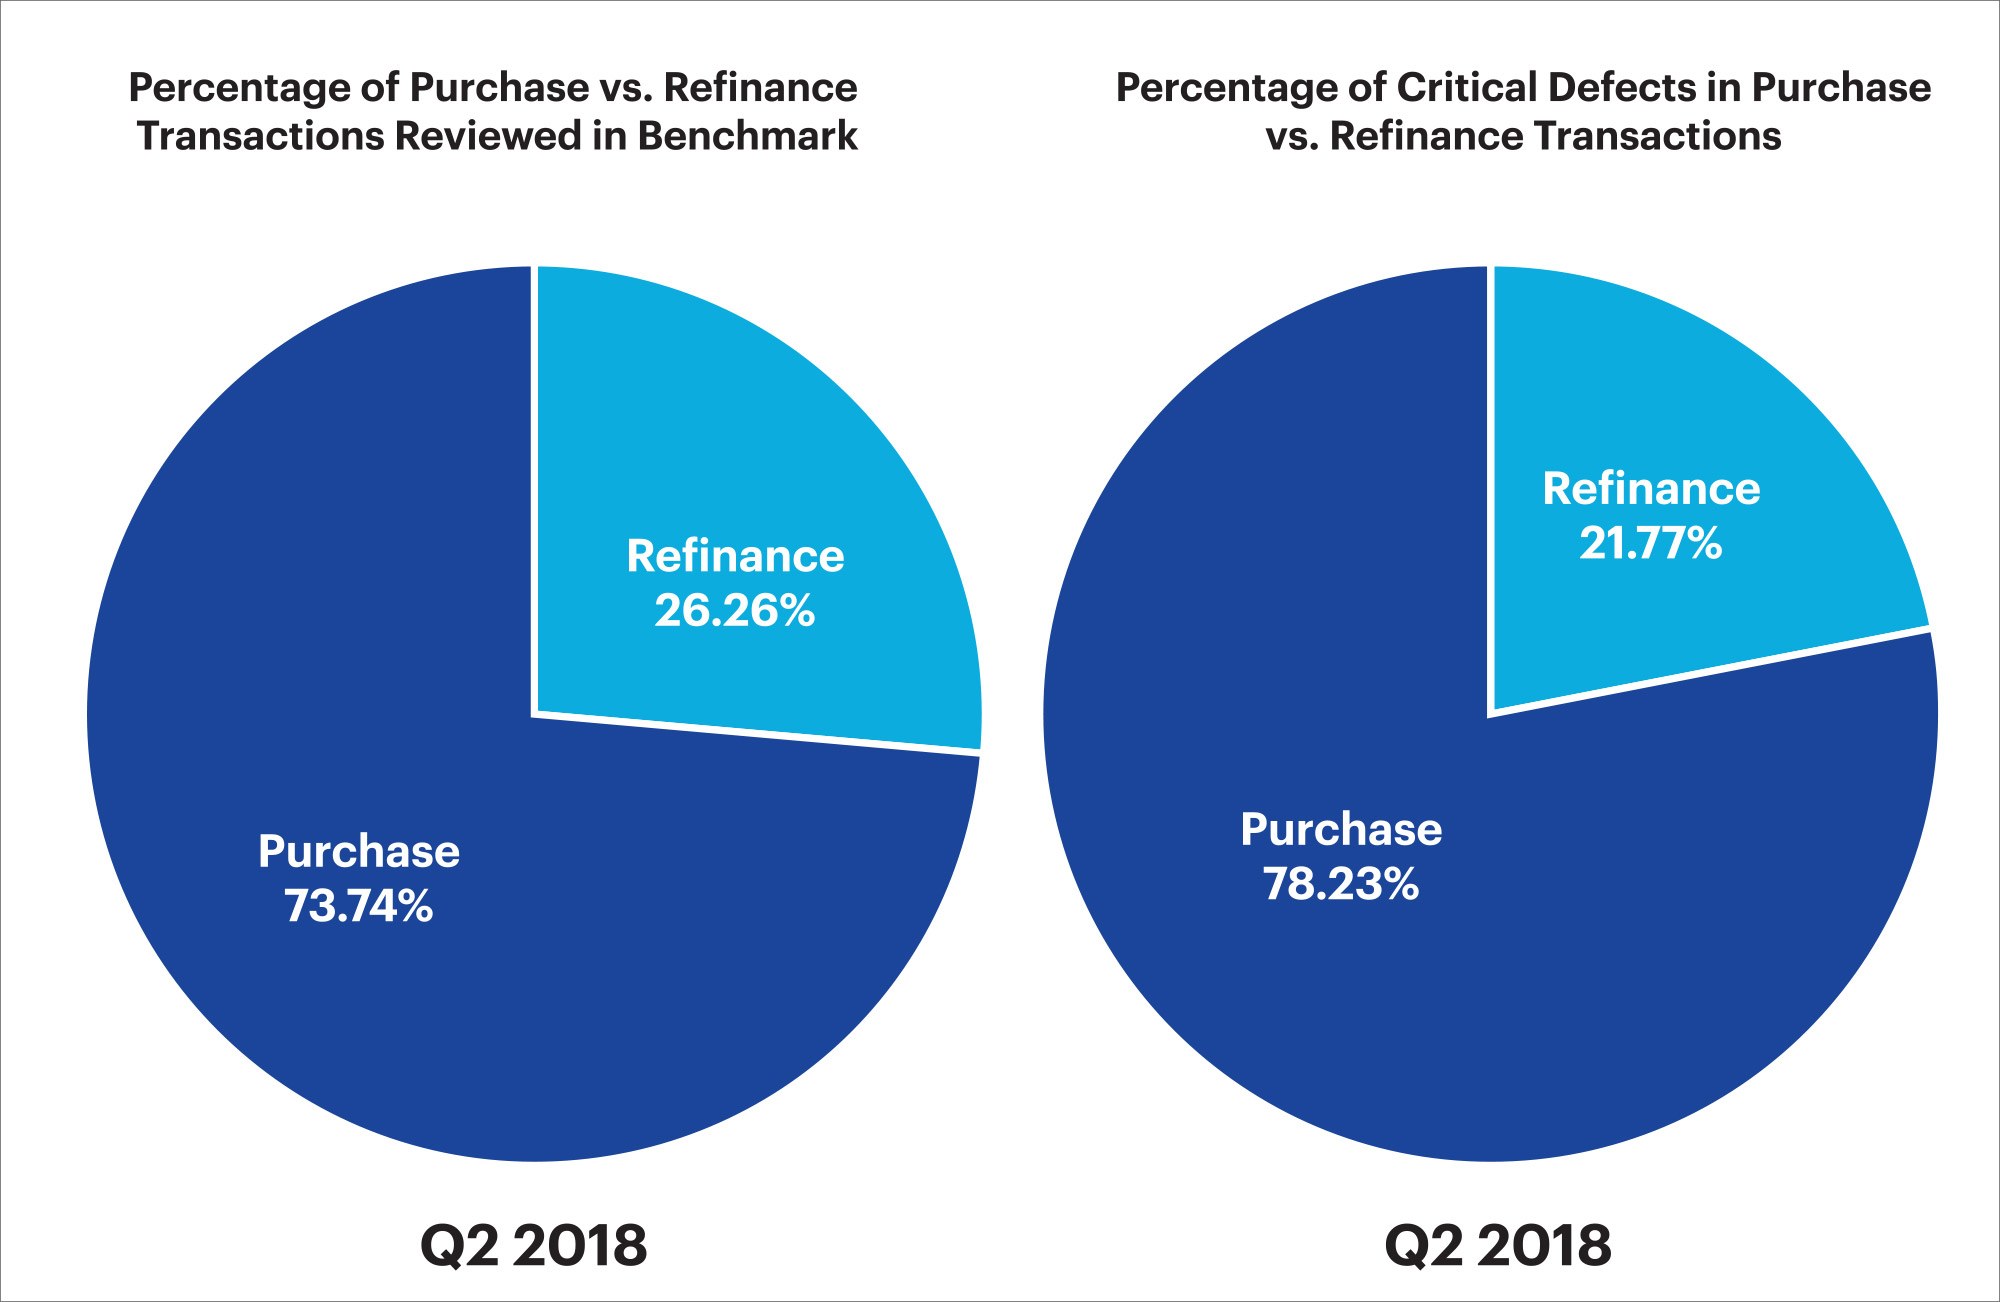
Figure 4: Q2 2018 loans reviewed according to loan purpose
QC Industry Trends by Loan Type
In Q2 2018, conventional loans accounted for 54.91% of all loans reviewed, FHA loans accounted for 33.10%, VA loans comprised 8.25% of the total, and USDA loans accounted for 3.75%.
The distribution of critical defects among loan types, however, did not directly correlate to the distribution of loans reviewed. Most notably, FHA loans accounted for 33.10% of the loans reviewed but represented 40.13% of loans with critical defects. The top three critical defects categories for FHA loans were Loan Package Documentation, which accounted for 24.59% of all loans reviewed; Assets, which accounted for 16.39%, and Legal/Regulatory/ Compliance, which accounted for 14.75%.
Figure 5 provides a comparison between loan types as a percentage of the benchmark and loan type as a percentage of critical defects (conventional, FHA, VA and USDA).
Critical Defects as a Percentage of All Loan Types—Q2 2018
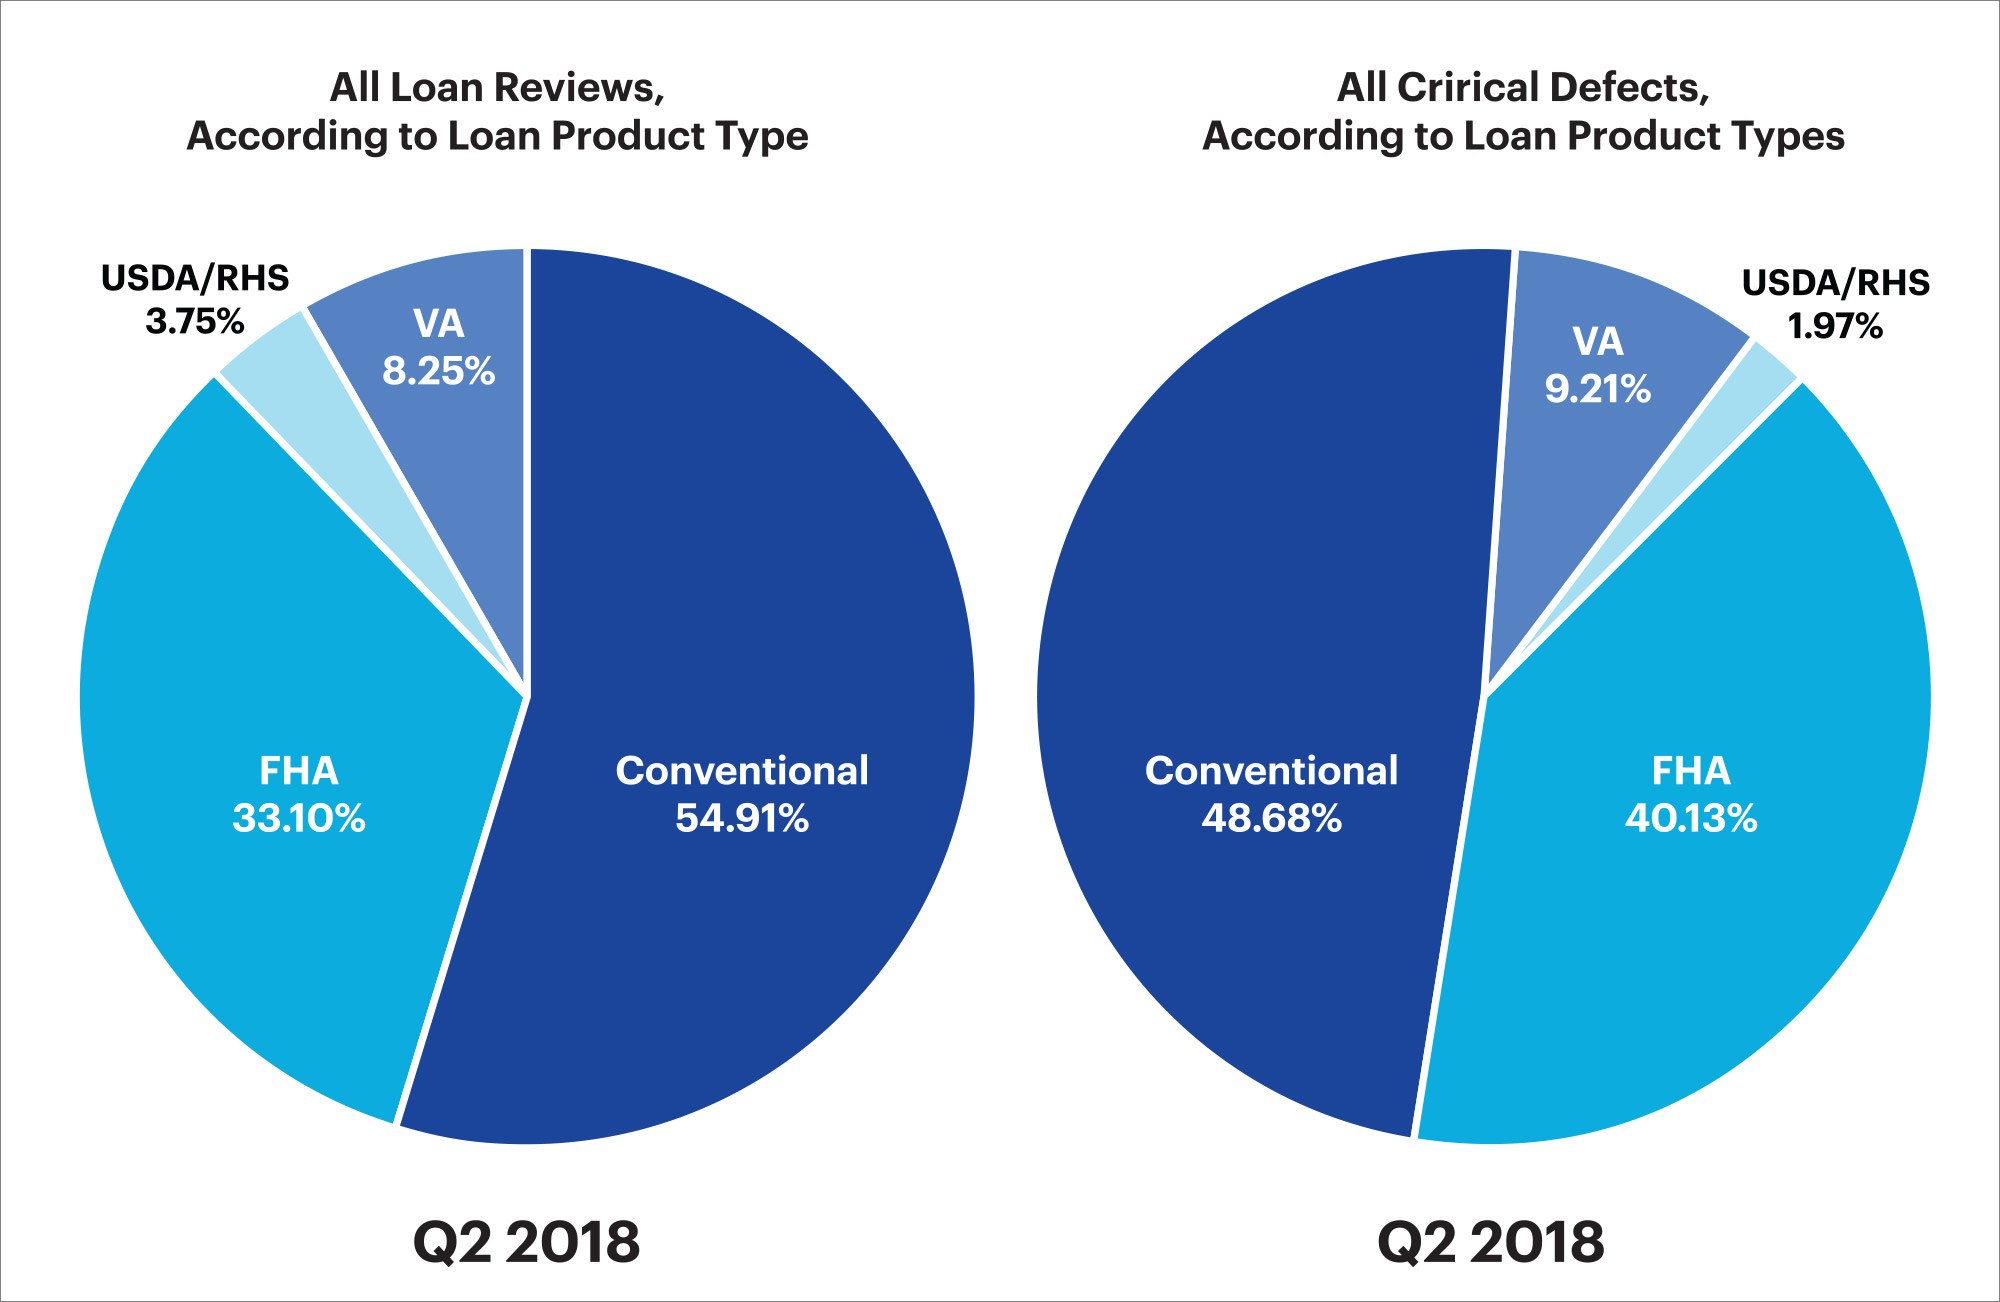
Figure 5: Q2 2018 Loans reviewed and critical defects by loan type
Conclusion
Purchase transactions dominated Q2 2018 as interest rates continued to rise and the number refinances continued to decline. Q2 2018 saw a spike in the percentage of defects typically resulting from downsizing and understaffing. This spike seems to indicate that lenders have still not adjusted to the purchase dominated market. As a whole, they did not appear to increase FTE allowance or implement new quality control technologies, as is needed to maintain quality with high complexity (purchase) transactions.
Overall origination volume continued to drop in Q2 2018. In response to the ongoing decline in volume, many lenders expanded their lending products as a means to grow origination volume in unserved markets.
If lenders want to maintain quality levels throughout of market volume or purchase-to-refinance ratios, they need to implement scalable solutions such as technology. Lenders should continuously evaluate their quality control practices to assure core underwriting and insuring policies are followed. If margins and volume continue to shrink, the impact of non-saleable or non-insurable loans moving forward can restrict lenders’ liquidity, reduce profitability, and weaken the overall market.
About the ARMCO Mortgage QC Industry Trends Report
The ARMCO Mortgage QC Industry Trends Report represents a nationwide post-closing quality control analysis using data and findings derived from mortgage lenders utilizing the ACES Analyt- ics benchmarking software.
This report provides an in-depth analysis of residential mortgage critical defects as reported during post-closing quality control audits. Data presented comprises net critical defects and is categorized in accordance with the Fannie Mae loan defect taxonomy.
About ARMCO
Over half of the Top 20 mortgage lenders in the U.S. choose ARMCO as their provider of risk man- agement software. ARMCO’s product line includes loan quality enterprise software, services, data and analytics. Its flagship product, ACES Flexible Audit Technology®, has set the bar for user definability in its category. It is used at virtually every point in the mortgage lifecycle, as well as for a wide range of risk-prone business operations outside traditional mortgage origination and servicing. ARMCO’s consultative approach to customer relationships leverages 25 years of mortgage risk intel, assuring that its clients are using the most effective risk mitigation strategies, and are using the fastest, most reliable, most efficient means for preventing risk-related loss. ARMCO distributes the ARMCO Mortgage QC Industry Trends Report, a free quarterly analysis of industry-wide mortgage loan quality. For more information, visit www.acesquality.com or call 1-800-858-1598.
MEDIA CONTACT:
Jeri Yoshida
Yosh Communications
jeri@yoshcomm.com
310 651 0057