ARMCO’s Mortgage QC Industry Trends Report represents an analysis of nationwide quality control findings based on data derived from the ACES Analytics benchmarking software.
Executive Summary
QC Industry Trends – Overview
QC Industry Trends – by Category
QC Industry Trends – by Loan Purpose
QC Industry Trends – by Loan Type
Conclusion
About this Report
Executive Summary
This report utilizes information derived from loan files analyzed by the ACES Analytics benchmarking system to provide defect-related mortgage quality control data for Q1 2017.
Findings for the Q1 2017 Trends Report were based on post-closing quality control data from over 75,000 unique loans originated by over 65 lenders across the country. Each of the evaluated loans was selected at random for a full-file review.
Defects are categorized using the Fannie Mae loan defect taxonomy. Data for any given calendar quarter is analyzed approximately 90 days after the end of the quarter, to allow for sufficient elapsed time for the post-closing quality control cycle to be completed. As a result, data for Q1 of 2017 is published by ARMCO in Q3 2017.
Summary of Findings
The leading critical defect categories for Q1 2017 were Borrower and Mortgage Eligibility, Income and Employment, and Credit, which continues a trend that started emerging in Q4 2016. While early 2016 was dominated by Legal/Regulatory/ Compliance defects that were driven by lender implementation of the October 2015 new TRID requirements, more recent industry trends show a return to findings typically associated with heavy purchase-driven markets.
Report highlights include:
- The Critical Defect Rate continued its upward trend, reaching 1.61% in Q1 2017, a 7% increase from Q4 2016.
- The top defect category for Q1 2017 was Borrower and Mortgage Eligibility.
- FHA loans account for a disproportionately high number of critical defects.
QC Industry Trends – Overview
The Critical Defect Rate increased for a second consecutive quarter to 1.61%, a 7% increase from the previous quarter and a 27% increase from the 2016 low of 1.27% in Q3.
NOTE: A Critical Defect is defined as a defect that would result in the loan being uninsurable or ineligible for sale. The Critical Defect Rate comprises loans in which at least one critical defect was identified during the post-closing quality control review.
Figure 1 displays the Critical Defect Rate—the number of loans with critical defects as a percentage of total closed loans—for the past four calendar quarters.
Critical Defect Rate, Q2 2016 – Q1 2017
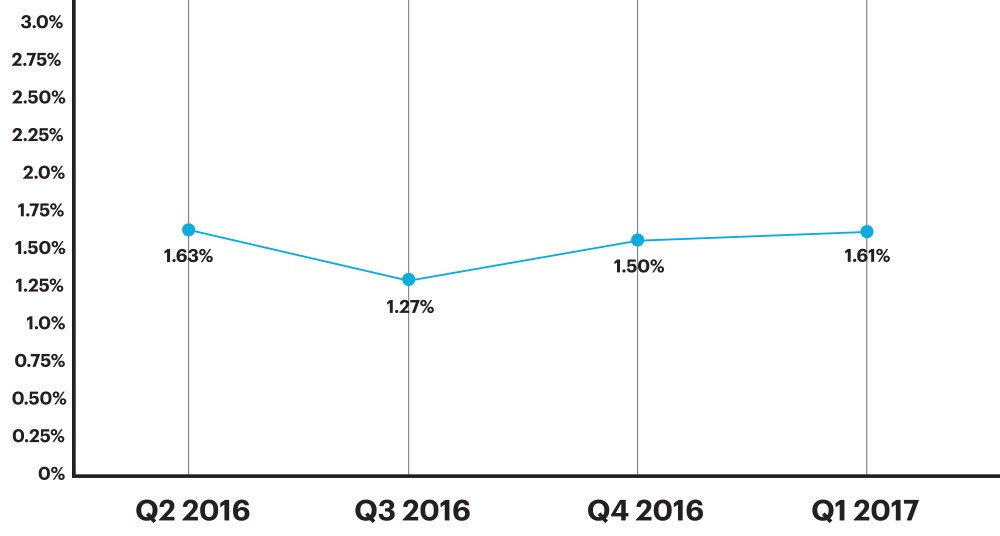
Figure 1: Percentage of loans with critical defects by quarter
QC Industry Trends – By Category
Over the course of 2016, lenders made major improvements in mitigating risks associated with TRID. As a result, the industry realized a reduction in critical defects associated with Legal/Regulatory/ Compliance issues, a trend that has carried through to 2017.
In Q1 2017, the top defect category was Borrower and Mortgage Eligibility, which comprised 23.76% of all reported critical defects. This was followed by Income/Employment at 20.79% and Credit, which accounted for 17.82% of all reported critical defects.
Figure 2 shows all reported net critical defects, broken down by Fannie Mae defect category.
Defect Rates by Fannie Mae Category, Q1 2017
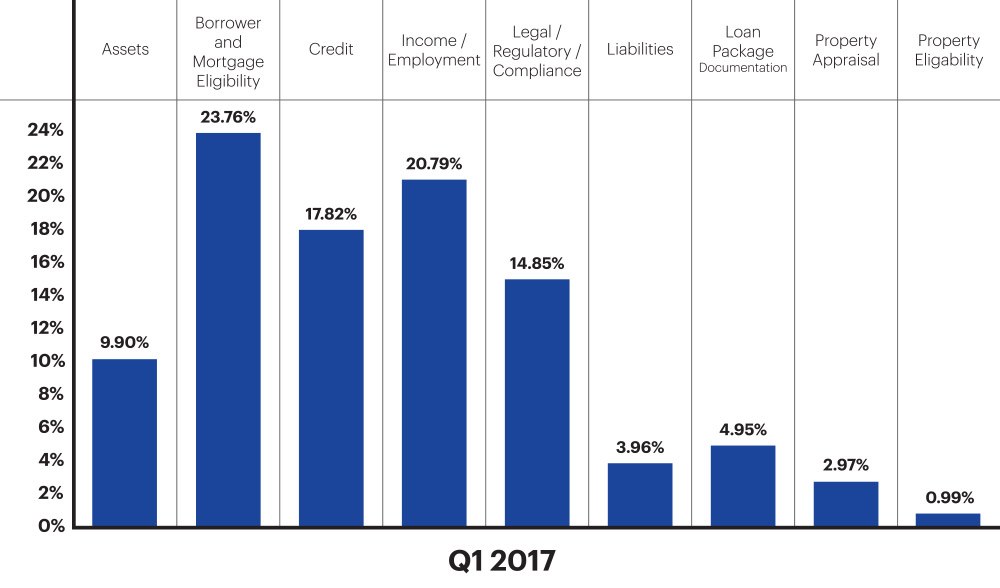
Figure 2: Q1 2017 breakdown of net defects according to Fannie Mae categories.
Deeper investigation into the top three critical defects categories reveals several sub-categories that provide insight into the root causes of each critical defect.
Over 87% of all critical defects within the top defect category of Borrower and Mortgage Eligibility are associated with Mortgage/Program Eligibility, a defect category that is typically associated with loan product/guideline issues. Those issues are, in turn, often linked to lenders’ expansion of product offering(s), which can require additional underwriter training and/or process improvement in order to assure eligibility.
For the second most common defect category—Income/Employment—over 52% of defects are attributed to Income Documentation, which is often associated with failure to adequately document the source of all or part of a borrower’s income.
With regard to Credit defects, the third most common category, more than 55% are associated with Credit Eligibility, a defect that is typically linked to either open derogatory items (i.e. collections, charge- offs or past due balances) or the recency of a significant derogatory event (i.e. re-establishing sufficient credit after a bankruptcy or foreclosure, or not meeting the timing requirements for eligibility).
Figure 3 reveals the sub-categories that comprise each of the top three Fannie Mae critical defect categories.
Top Three Categories – Critical Defects, Q1 2017
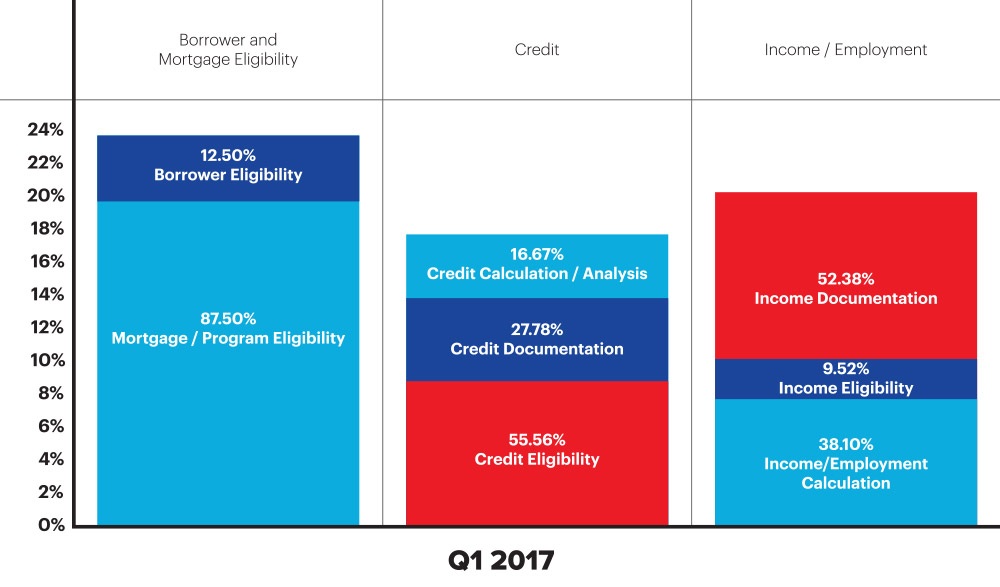
Figure 3: Q1 2017 top three categories for critical defects broken down by sub-category
QC Industry Trends – Mortgage/Program Eligibility
Over 87% of the defects in the Borrower/Mortgage Eligibility category, which was the No. 1 defect category for Q1 2017, were attributed to the sub-category of Mortgage/Program Eligibility. Deeper investigation reveals that over 40% of defects in the Mortgage/Program Eligibility sub-category were attributed to the following three defects:
- Exclusionary Lists: Limited Denials of Participation (LDP) and General Services Administration (GSA) account for 21.54% of reported critical defects.
- Defects associated with Data Integrity or Data Validation errors comprise 12.31% of reported critical defects.
- Third-Party Fraud/Risk Report discrepancies account for 9.23% of the critical defects.
Defects associated with Exclusionary Lists and Risk Reports tend to increase in a purchase driven market. The GSEs, Agencies and most investors require confirmation that any company or individual involved in the origination of a mortgage transaction is not on an exclusionary list. LDP and GSA are two of the primary lists. Purchase transactions typically involve several participants that are not involved in refinance transactions. The additional participants— like the listing agent, selling agent and their respective employers, and the property seller(s) plus any associated companies, builders and affiliates— that participate in the transaction must each be reviewed and confirmed to not be on the LDP or GSA excluded party list. These same parties are also included in the review process for most third-party fraud/risk reports. The task of properly identifying these additional participants introduces additional opportunity for errors.
Critical defects associated with Data Validation reflect lenders’, investors’ and servicers increasing concern over data integrity errors. Despite the industry’s continued increase in automation and overall goal to move from paper to digital, data integrity errors continue to escalate for many lenders. The prevalence of disparate workflow systems, each containing important loan data, can lead to inconsistencies within the same elements in various systems of record.
New and enhanced technologies that validate data as a standard part of the manufacturing process are a necessary component for effectively mitigating data errors.
Figure 4 breaks down the top three reported critical defects reported in Q1 2017 for the Mortgage Eligibility category.
Top Three Critical Defects: Mortgage Eligibility, Q1 2017
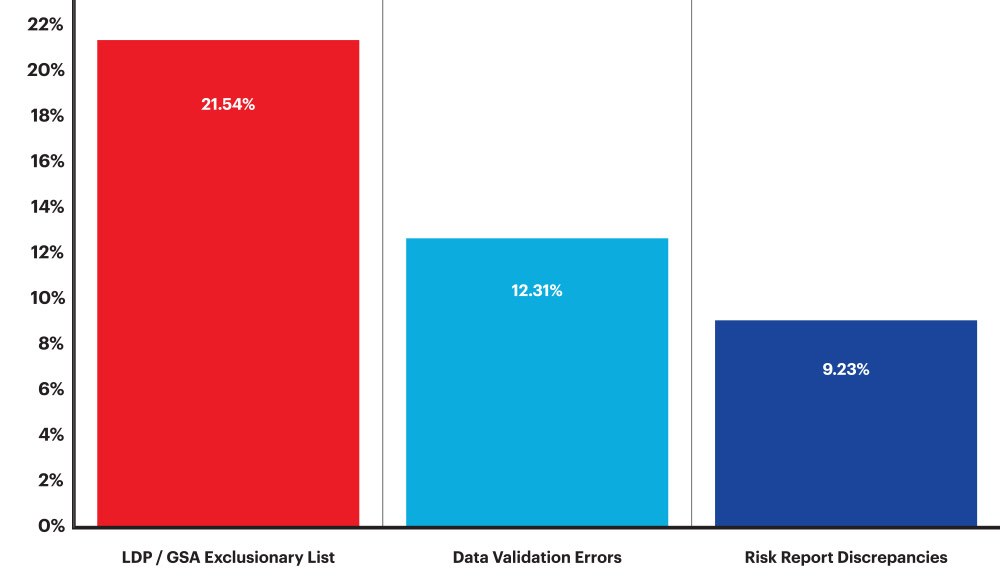
Figure 4: Top three critical defect categories within Mortgage Eligibility
QC Industry Trends – by Loan Type
In Q1 2017, Conventional loans accounted for 52.72% of all loans reviewed. FHA loans accounted for 31.40%, VA loans, 11.12% and USDA loans, 4.76%. The distribution of critical defects among loan types does not directly correlate to the distribution of loans reviewed. Most notably, FHA loans accounted for just over 31% of the loans reviewed, but represented over 52% of all loans containing critical defects.
The disproportionate share of critical defects among FHA loans represents a prime example of the need for analytics in business decision making. Identifying the areas where defects are disproportionately high empowers lenders to conduct discretionary and/or targeted reviews. This in turn enables them to implement strategies that correct these issues by addressing the sources of the defects. Effectively managing risk requires knowing where the greatest risks lie. Only then can lenders allocate appropriate resources to loan auditing and quality reviews, proactively moving beyond mere random or statistical sampling to achieve an effective method for properly managing risk.
Figure 5 categorizes all loans in the benchmark by loan type and offers a comparison against the critical defects associated with them. (Conventional, FHA, VA and USDA)
Critical Defects as a Percentage of All Loan Types, Q1 2017
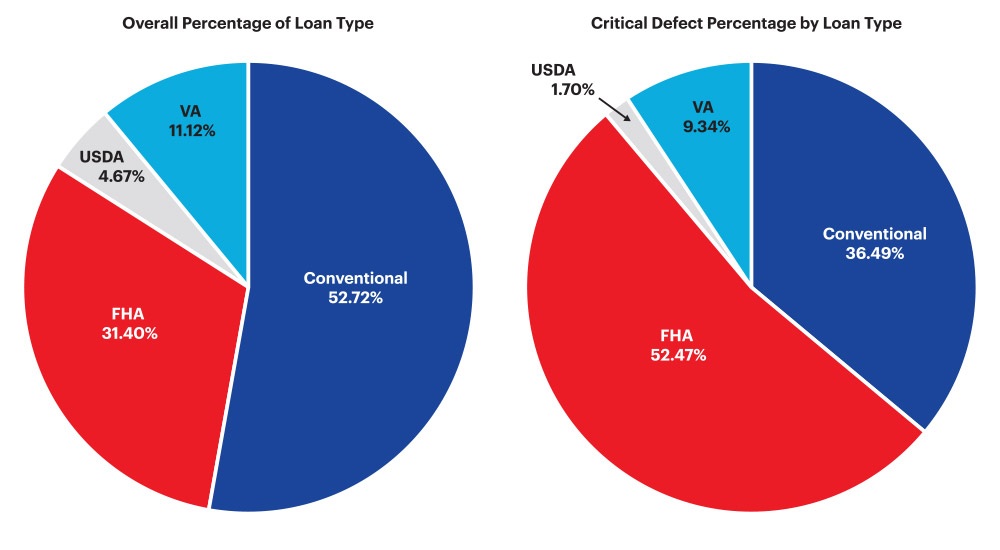
Figure 5: Q1 2017 breakdown of critical defects by loan type
Conclusion
The purchase/refi balance of mortgage originations shifted significantly during Q1 2017. In Q4 2016, purchase transactions accounted for 51% of the ACES Analytics benchmark data. In Q1 2017, they accounted for 68%, a 33% increase from the previous quarter. Not surprisingly, critical defects were primarily related to eligibility and credit risk associated with borrowers.
Purchase transactions are inherently more prone to defects than refinance transactions due to the increased number of participants and elevated complexity of the process. The overall Critical Defect Rate throughout the remainder of 2017 will be determined in large part by the ratio of purchase to refinance transactions.
About the ARMCO Mortgage QC Industry Trends Report
The ARMCO Mortgage QC Industry Trends Report represents a nationwide post-closing quality control analysis using data and findings derived from mortgage lenders utilizing the ACES Analytics benchmarking software.
This report provides an in-depth analysis of residential mortgage critical defects as reported during post-closing quality control audits. Data presented comprises net critical defects and is categorized in accordance with the Fannie Mae loan defect taxonomy.
About ARMCO
ARMCO – ACES Risk Management delivers web-based audit technology solutions, as well as powerful data and analytics, to the nation’s top mortgage lenders, servicers, investors and outsourcing professionals. A trusted partner devoted to client relationships, ARMCO offers best-in-class quality control and compliance software that provides U.S. banks, mortgage companies and service providers the technology and data needed to support loan integrity, meet regulatory requirements, reduce risk and drive positive business decisions. ARMCO’s flagship product, ACES Flexible Audit Technology®, is available at any point in the mortgage loan lifecycle, to any size lender, and is user-definable. ACES standardizes audit requirements, ties pre-funding reviews to post-closing quality control audits, enables seamless trend analysis, identifies credit, compliance and process deficiencies and helps create manageable action plans. For more information, visit visit www.acesquality.com or call 1-800-858-1598.
MEDIA CONTACT:
Jeri Yoshida
Yosh Communications
jeri@yoshcomm.com
310 651 0057