ARMCO’s Mortgage QC Industry Trends Report represents an analysis of nationwide quality control findings based on data derived from the ACES Analytics benchmarking software.
Executive Summary
QC Industry Trends – Overview
QC Industry Trends – by Category
QC Industry Trends – by Loan Purpose
QC Industry Trends – by Loan Type
Conclusion
About this Report
Executive Summary
This report represents an analysis of post-closing quality control data derived from loan files analyzed by the ACES Analytics benchmarking system, during first quarter 2018 (Q1 2018). Findings for the Q1 trends Report were based on post-closing quality control data from over 90,000 unique loans. All reviews and defect data that were evaluated for this report were based on loan audits selected by lenders for full file reviews.
Defects are categorized using the Fannie Mae loan defect taxonomy. Data for any given calendar quarter is analyzed no earlier than 90 days after the end of the quarter, which allows sufficient time for lenders to complete the post-closing quality control cycle. Hence, ARMCO releases analyses for Q1 2018 in Q3 2018.
Summary of Findings
The leading critical defect categories for Q1 2018 were (1) Income/Employment, (2) Assets and (3) Loan Package Documentation. Purchase transactions continued to outpace refinances in Q1 2018, comprising 62.98% of all transactions reviewed.
Report highlights include the following findings:
- In Q1 2018, the critical defect rate increased from 1.68% to 1.72%.
- As with the previous quarter, in Q1 2018, the majority of critical defects were attributed to the Income/Employment category.
- In Q1 2018, the number of defects attributed to Borrower and Mortgage Eligibility dropped to 6.57%, roughly 50% of the previous quarter’s rate of 12.24%.
- In Q1 2018, critical defects related to core underwriting and eligibility issues continued to be the most frequently occurring—which is typical in purchase-driven markets.
- Q1 2018 saw a 25% increase in the number of defects attributed to Loan Package Documenta- tion—these defects are often associated with downsizing and understaffing.
QC Industry Trends – Overview
In Q1 2018, the critical defect rate remained relatively steady, reaching 1.72%—a mild increase over the previous quarter’s rate of 1.68%. This represents a gain of 0.025%.
NOTE: A critical defect is defined as a defect that would result in the loan being uninsurable or ineligible for sale. The critical defect rate reflects the percentage of loans reviewed for which at least one critical defect was identified during the post-closing quality control review and all report- ed defects are net defects.
Figure 1 displays critical defect rates—the number of loans containing at least one critical defect as a percentage of the total closed loans reviewed—for the past four calendar quarters. All loans reviewed are part of a lenders’ monthly random post-closing quality control review.
Critical Defect Rate by Quarter: Q1 2018
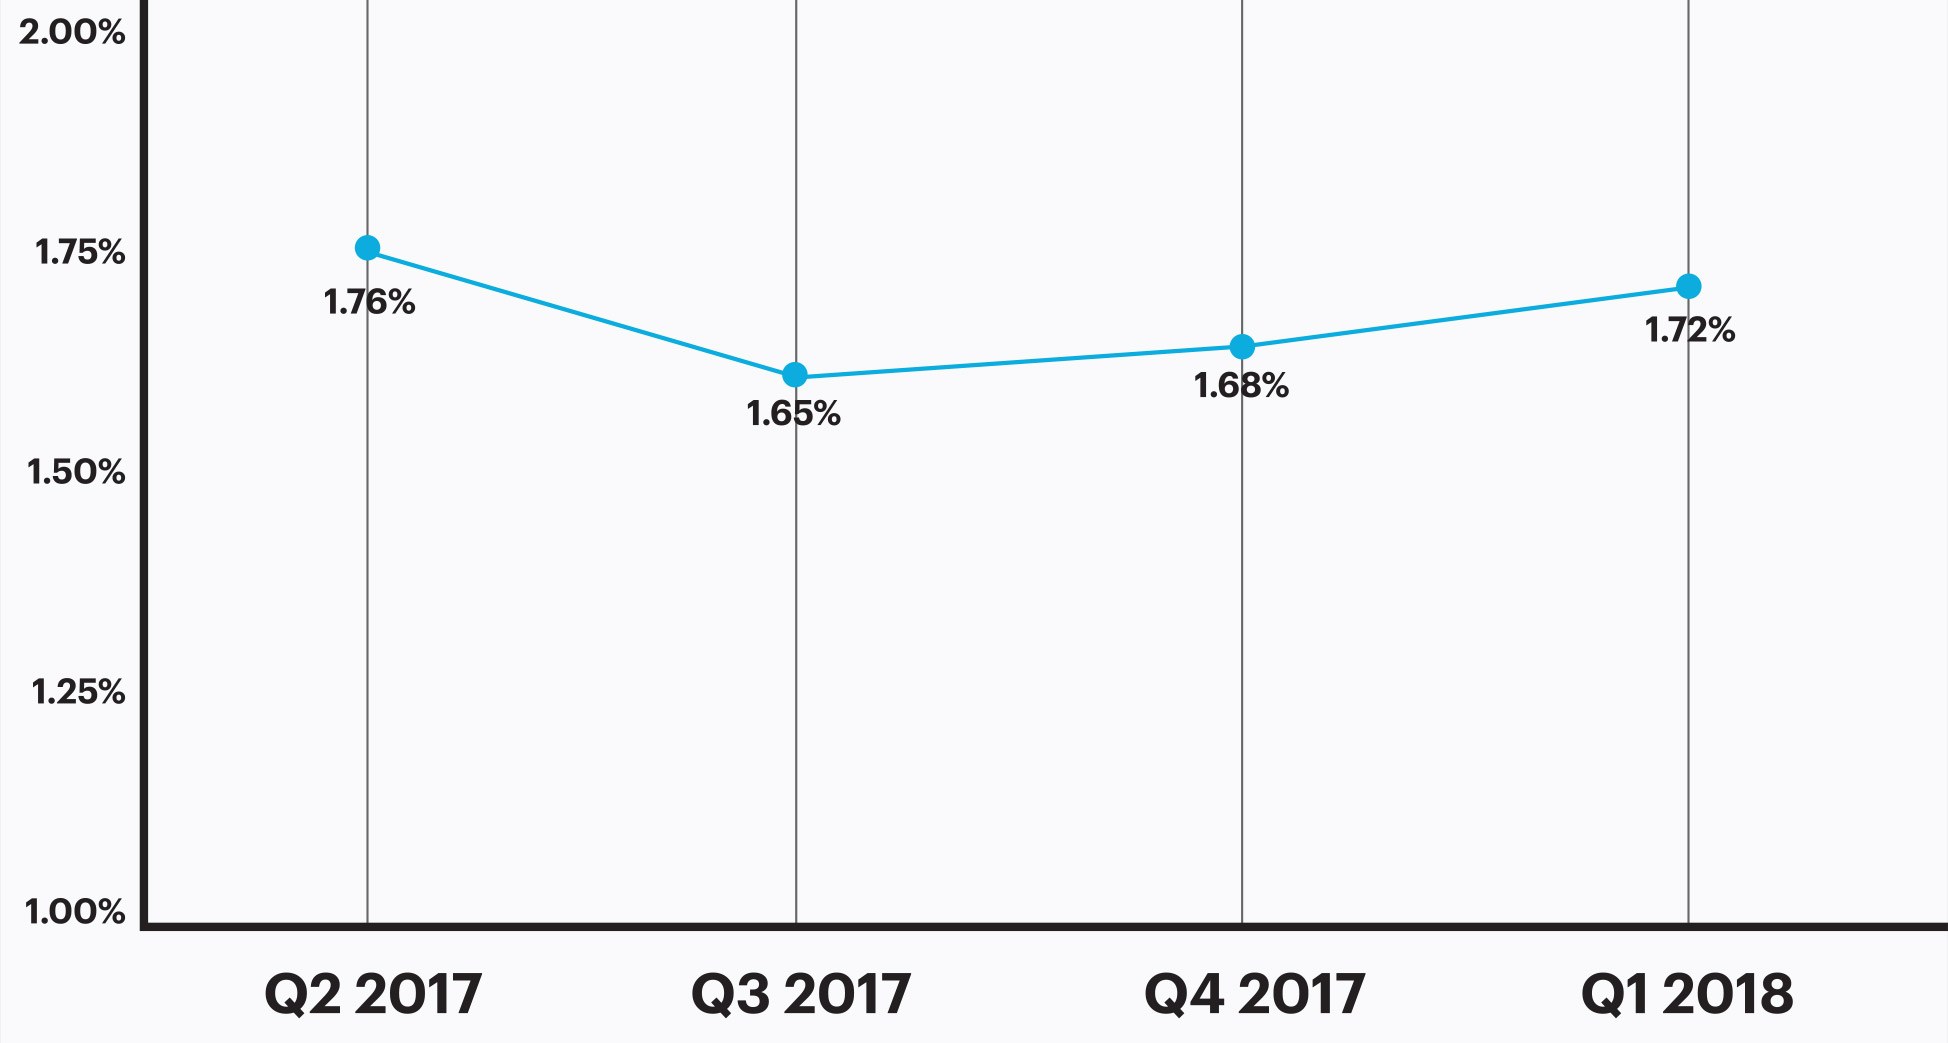
Figure 1: Percentage of loans with critical defects by quarter, Q2 2017 through Q1 2018
QC Industry Trends by Defect Category
In Q1 2018, the distribution of critical defects reflected the market’s high percentage of purchase transactions and declining number of originations, as well as the subsequent downsizing and staff consolidation that started taking place among the lender community earlier this year.
Defects classified in the Income/Employment category accounted for 24.82% of all critical defects, more than any other category. Defects in the Assets category accounted for the second highest number of critical defects at 20.44%, followed by the Loan Package Documentation category, which accounted for 16.06% of all critical defects.
Figure 2 shows net critical defects, sorted according to Fannie Mae defect category, for Q1 2018.
Critical Defects by Fannie Mae Category: Q1 2018
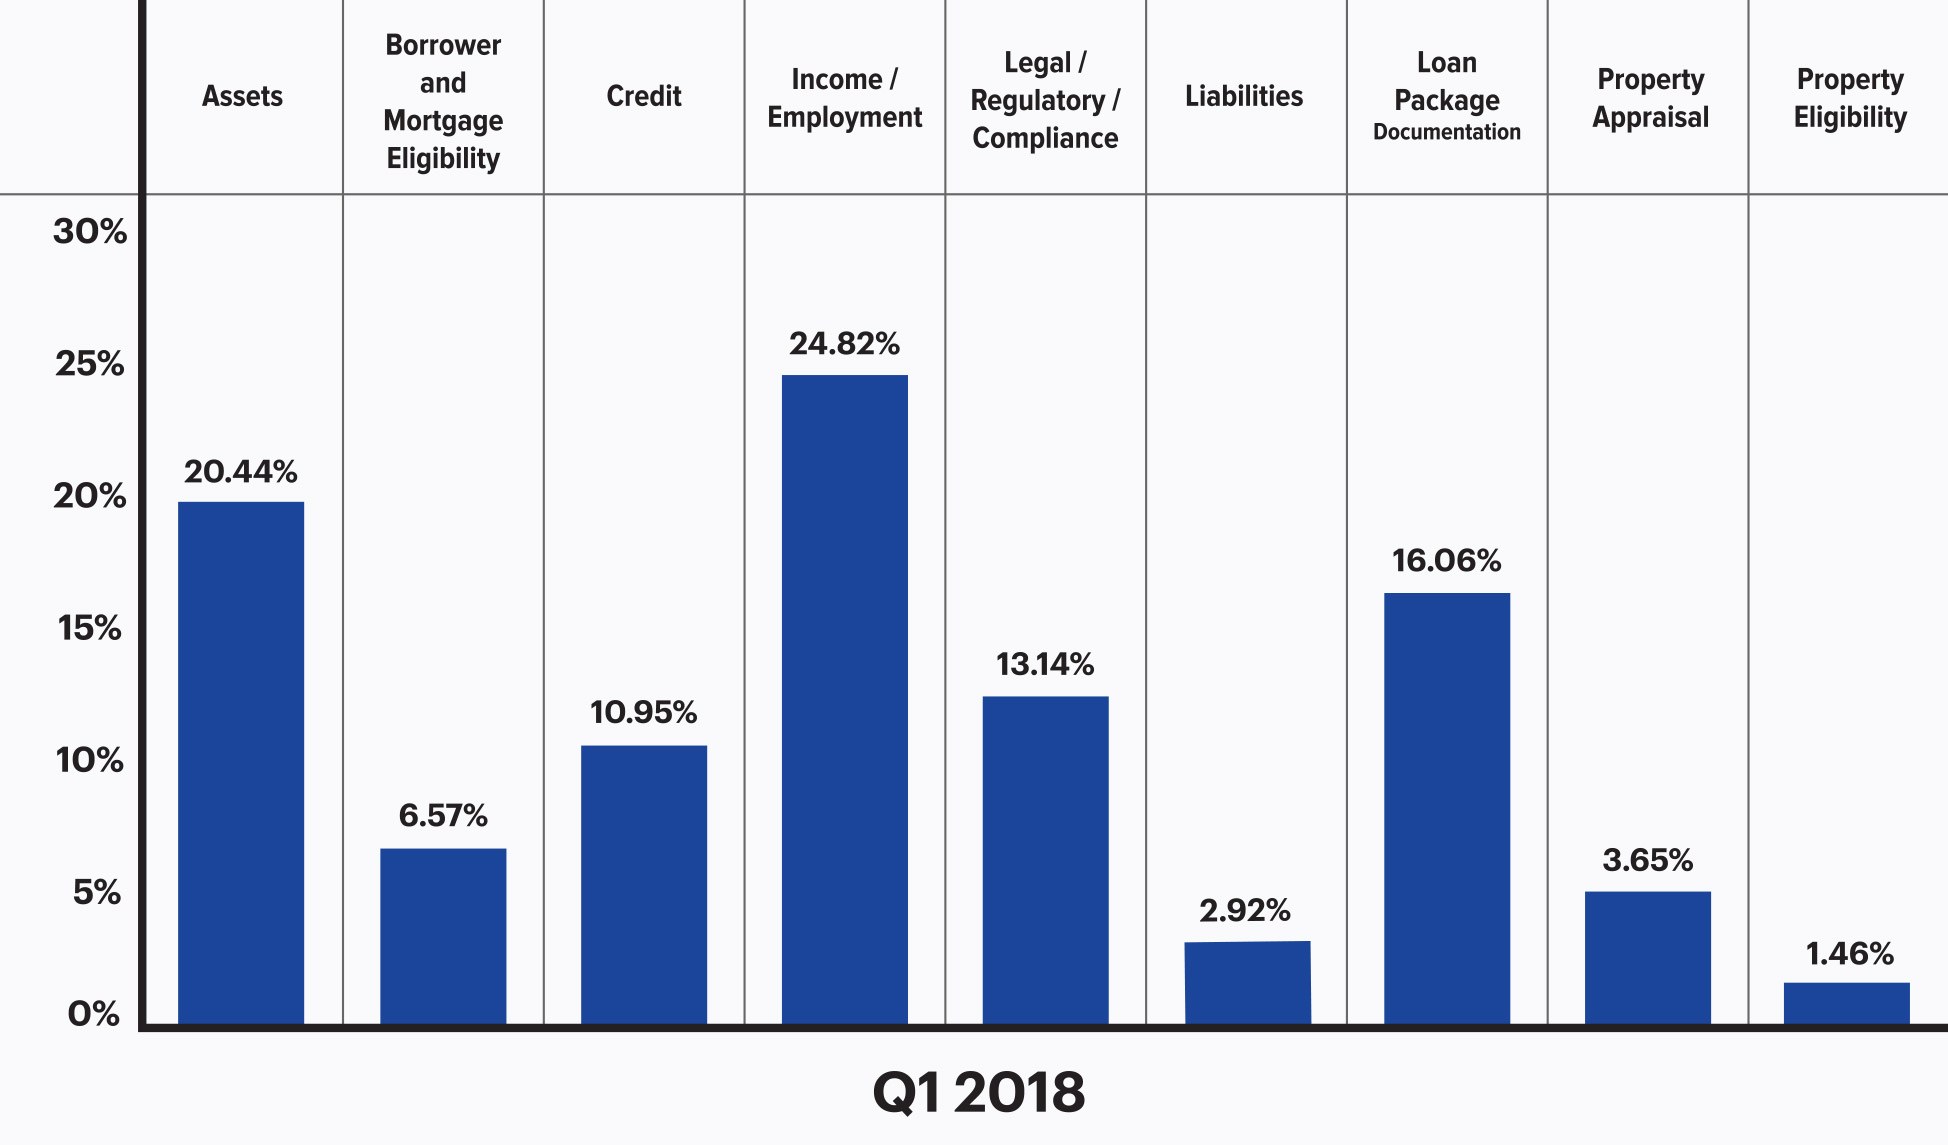
Figure 2: Q1 2018 net critical defects according to Fannie Mae defect category
Q1 2018 saw a substantial shift in the category distribution of defects over the previous quarter. While Income/Employment remained the top defect category in both quarters, the percentage of defects in this category spiked from 19.90% in Q4 2017 to 24.82% in Q1 2018—an increase of roughly 25%. The number of defects attributed to Borrower and Mortgage Eligibility dropped roughly 50%, from 12.24% in Q4 2017, to 6.57% in Q1 2018. Defects related to Assets increased by over 50%, from 13.27% in Q4 2017 to one fifth or 20.44% of all loans in the benchmark for Q1 2017.
Another notable change was the number of defects in the category of Loan Package Documentation, which jumped from 12.76% in Q4 2017 to 16.06% in Q1 2018—an increase of 25%. In Q3 2017 the number of defects in this category reached only 9.58%. This quarter over quarter increase is of particular note as defects attributed to Loan Package Documentation, while most often not of serious monetary conse- quence, are often the result of staffing issues, such as downsizing or understaffing—two ramifications of the layoffs and reorganizations that are typical in a contracting market.
The distribution of critical defects in Q1 2018 continue to weigh heavier on core underwriting and eligi- bility issues. The four credit-related defect categories (Assets, Borrower and Mortgage Eligibility, Credit and Income/Employment) comprised 62.78% of all critical defects in Q1 2018, an increase from 56.12% in Q4 2017. This type of amplification is symptomatic of declining and/or purchase-dominant mar- kets—times when lenders, responding to increased pressure to close loans, often loosen standards and push normal limits in an effort to close more loans. In Q1 2018, loan volume continued its decline and was also dominated by purchase transactions.
Figure 3 shows net critical defects, sorted according to Fannie Mae defect category, for Q4 2017 vs. Q1 2018.
Critical Defect Rate by Quarter: Q1 2018
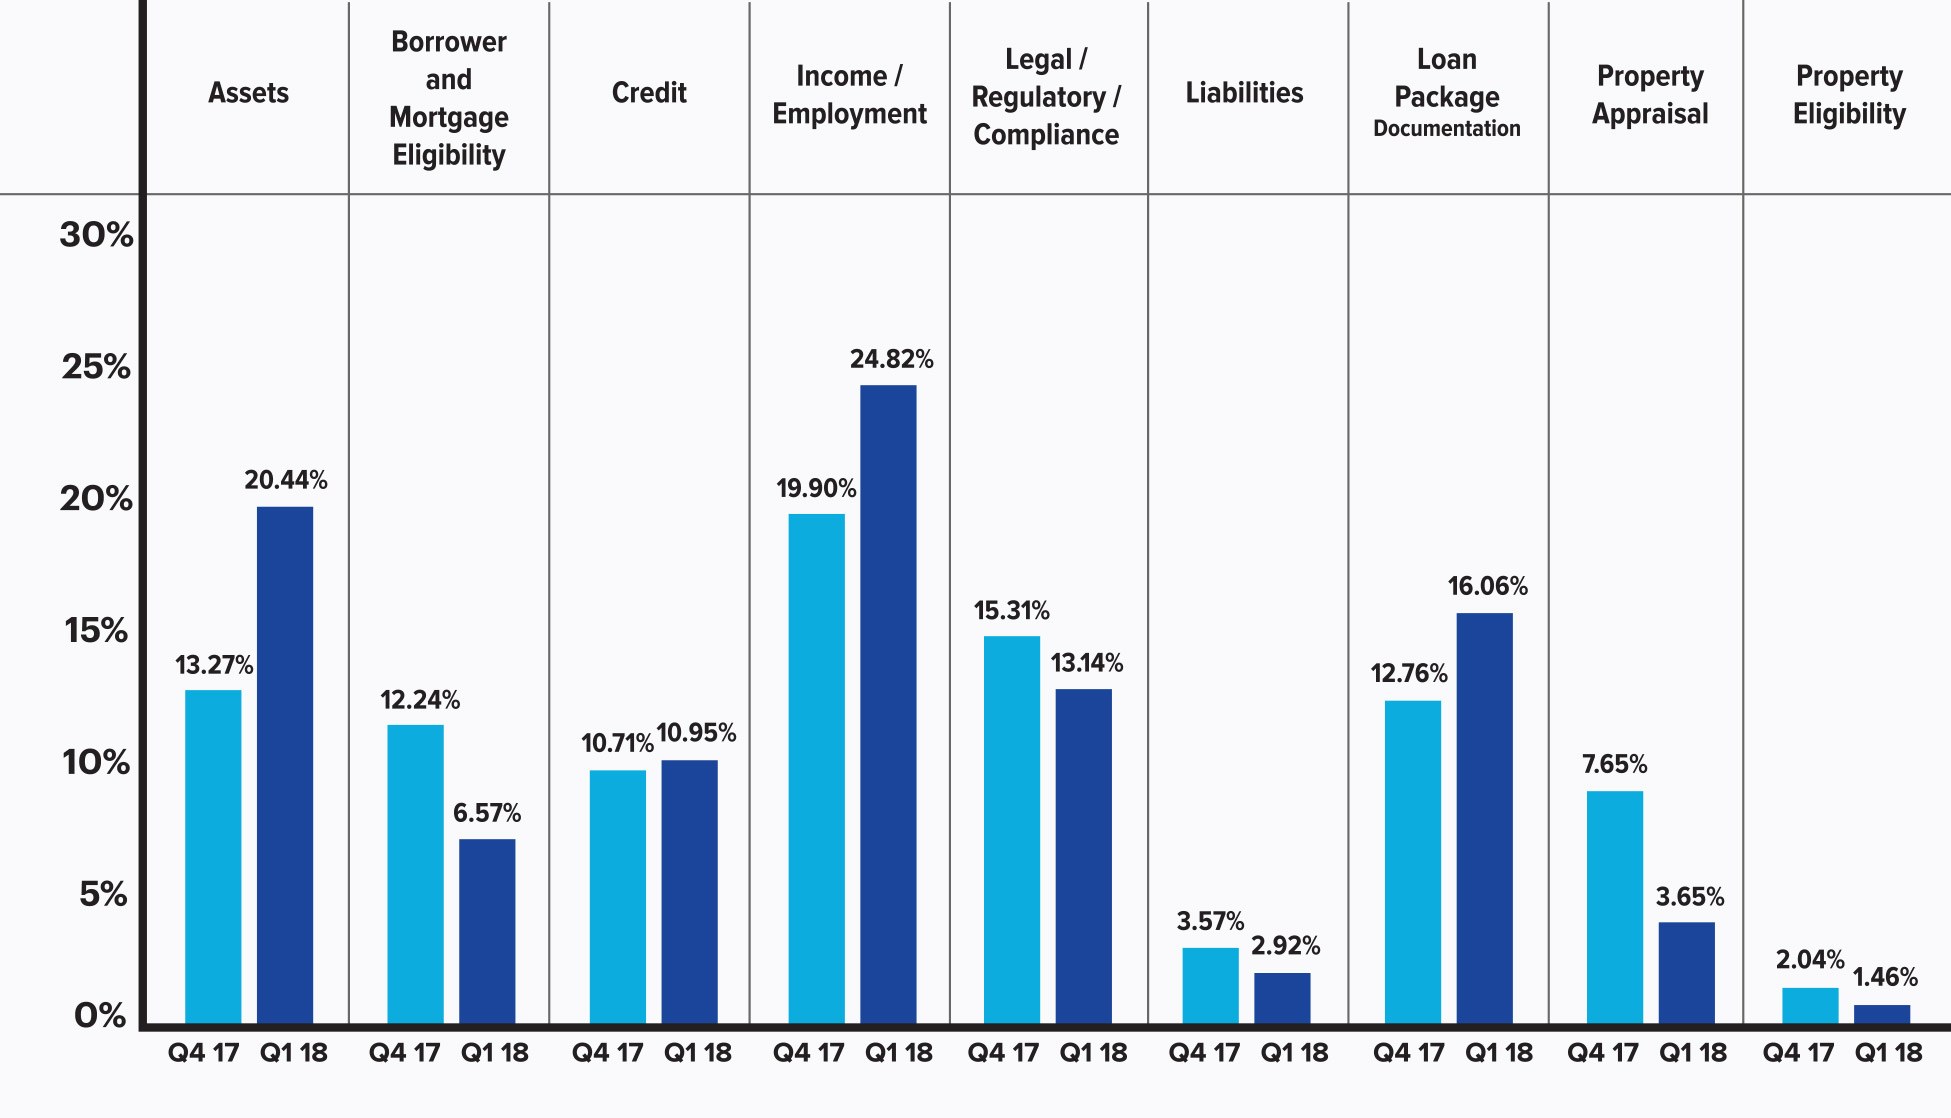
Figure 3: Q4 2017 vs. Q1 2018 net critical defects according to Fannie Mae defect category
QC Industry Trends by Loan Purpose
In Q1 2018, while purchase transactions represented roughly 63% of all reviewed loans, they accounted for over 68% of all reported critical defects. This imbalance—the percentage of critical defects reported, versus the percentage of purchase transactions of all loans in the benchmark—in- dicates that more critical defects were attributed to purchases during this quarter. This finding aligns with the commonly held belief that the greater complexity associated with purchase transac- tions lends itself to a greater number of critical defects.
Figure 4 provides a comparison of all reviewed loans by loan purpose and all critical defects by loan purpose for Q1 2018.
Loans Reviewed and Critical Defects by Loan Type: Q1 2018
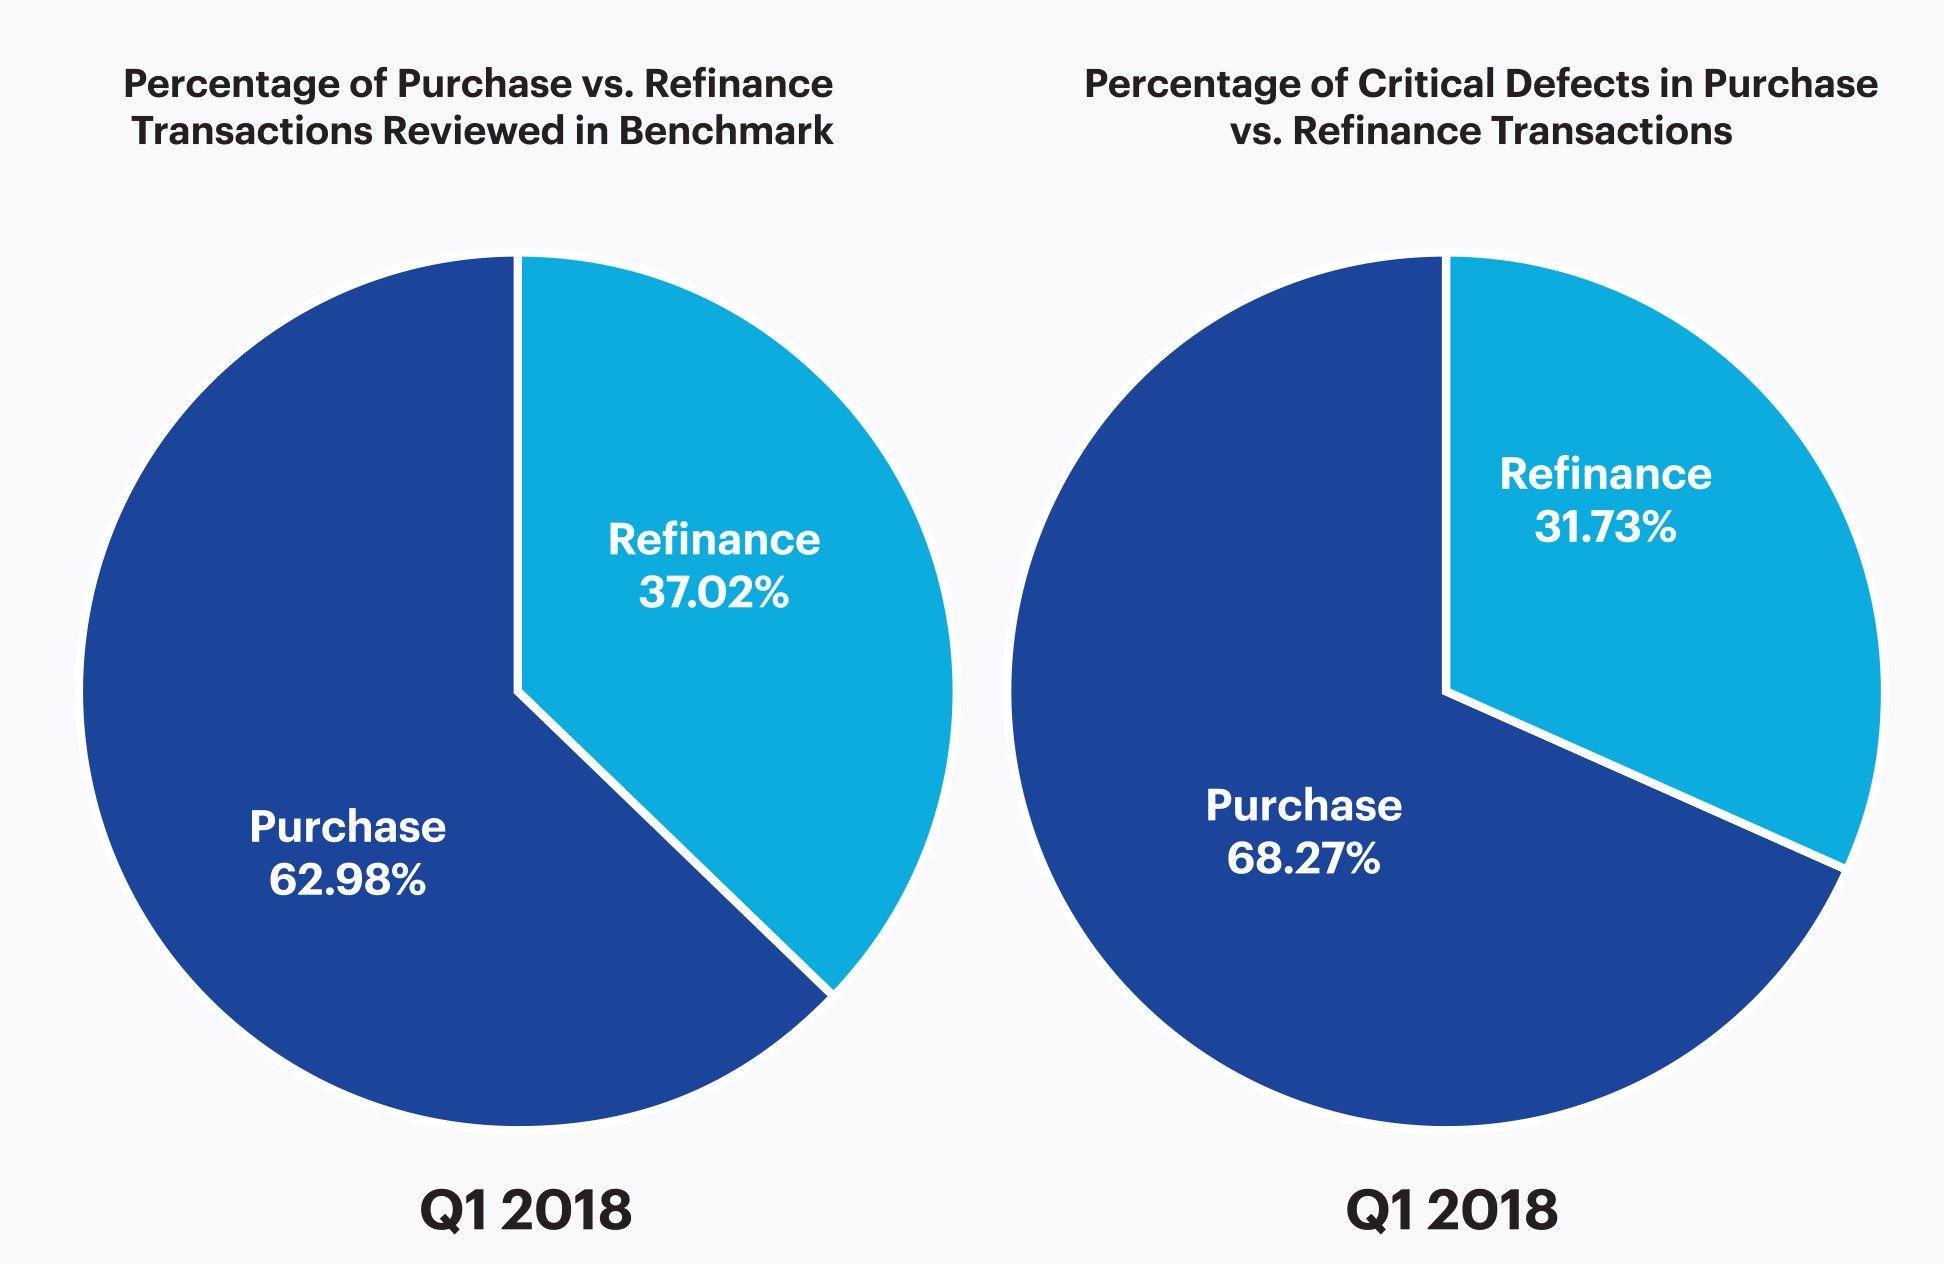
Figure 4: Q1 2018 loans reviewed according to loan purpose
QC Industry Trends by Loan Type
In Q1 2018, 55.39% of all loans reviewed were conventional loans, 29.83% were FHA loans, 10.48% were VA loans, and 4.30% were USDA loans. However, the distribution of critical defects among loan types does not directly correlate to the distribution of loans reviewed. Most notably, FHA loans accounted for roughly 30% of the loans reviewed but represented approximately 40% of loans containing critical defects. In Q1 2018, the top three critical defects reported for FHA loans were (1) insufficient documentation and/or sourcing of assets required for closing (2) improper calculation of income and (3) borrower eligibility defects associated with Ability to Repay (ATR).
Figure 5 provides a comparison between loan types as a percentage of the benchmark and loan type as a percentage of critical defects (conventional, FHA, VA and USDA).
Critical Defects as a Percentage of All Loan Types—Q1 2018
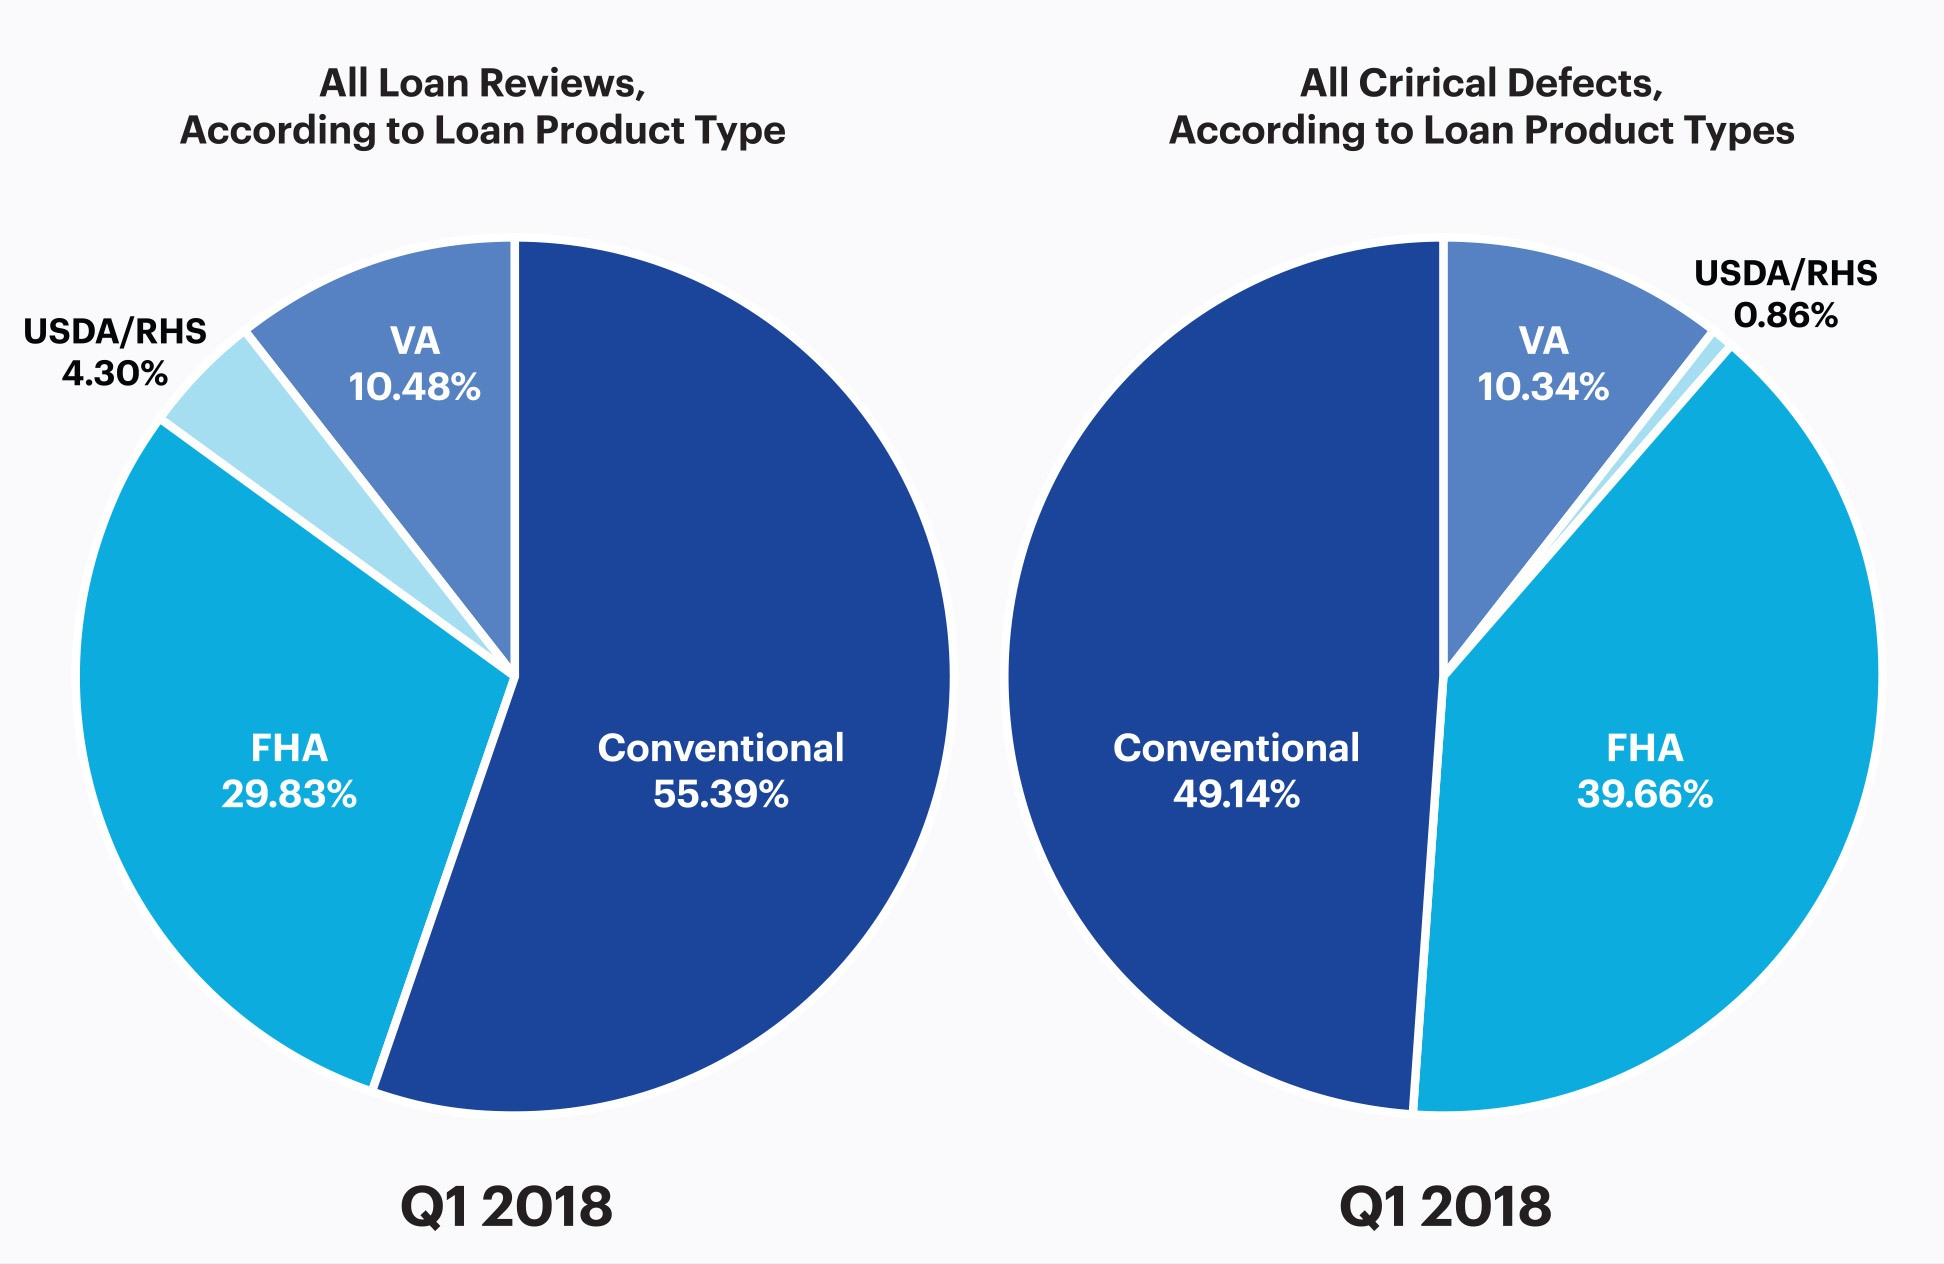
Figure 5: Q1 2018 Loans reviewed and critical defects by loan type
Conclusion
Purchase transactions and FHA loans are inherently more prone to underwriting related defects due to the increased complexity in the origination process. In demonstration of this fact, Employ- ment/Income, Credit, and Borrower and Mortgage Eligibility—all categories related to the activity of mortgage underwriting—accounted for the majority of defects in Q1 2018.
The continued decline in overall loan production also appears to have had major impact on loan quality. Declining production often elicits lending personnel (such as loan originators, processors and underwriters) to loosen standards in an effort to close more loans. Similarly, secondary market investors often expand or soften guidelines in an effort to allow more borrowers to qualify for financing.
Lenders must know where the greatest risks lie in order to effectively and proactively manage risk. Comprehensive loan auditing and quality reviews allow lenders to identify and understand the unique root causes of their risk, allocate appropriate resources and proactively move beyond mere random sampling to achieve an efficient, effective method for properly managing risk.
About the ARMCO Mortgage QC Industry Trends Report
The ARMCO Mortgage QC Industry Trends Report represents a nationwide post-closing quality control analysis using data and findings derived from mortgage lenders utilizing the ACES Analyt- ics benchmarking software.
This report provides an in-depth analysis of residential mortgage critical defects as reported during post-closing quality control audits. Data presented comprises net critical defects and is categorized in accordance with the Fannie Mae loan defect taxonomy.
About ARMCO
ARMCO – ACES Risk Management has served the finance industry with risk management software for over 25 years and is the recognized authority on mortgage risk. Today, in addition to an array of loan quality enterprise software, services, data and analytics, the company also provides the ARMCO Mortgage QC Industry Trends Report, a free quarterly analysis of industry-wide mortgage loan quality. ARMCO provides its clients with insights based on decades of risk analysis intel, so they always have the fastest, most reliable, most efficient means for preventing risk-related loss, and creating effective risk strategies going forward. The company’s flagship product, ACES Flexible Audit Technology®, can be used at any point in the mortgage lifecycle, and is so user-definable, its capabilities extend outside of origination and servicing, into a wide range of risk-prone audit-able business operations. For more information, visit www.acesquality.com or call 1-800-858-1598.
MEDIA CONTACT:
Jeri Yoshida
Yosh Communications
jeri@yoshcomm.com
310 651 0057