ACES’ Mortgage QC Industry Trends Report represents an analysis of nationwide quality control findings based on data derived from the ACES Analytics benchmarking software.
Executive Summary
QC Industry Trends – Overview
QC Industry Trends – by Category
QC Industry Trends – by Loan Purpose
QC Industry Trends – by Loan Type
Early Payment Defaults
Conclusion
About this Report
Executive Summary
This report represents an analysis of post-closing quality control data derived from loan files analyzed by the ACES Quality Management and Control® benchmarking system during the first quarter of 2020 (Q1 2020) and incorporates data from prior quarters and/ or calendar years where applicable.
Findings for the Q1 2020 Trends Report were based on post-closing quality control data from over 90,000 unique loans. All reviews and defect data that were evaluated for this report were based on loan audits selected by lenders for full file reviews.
Defects are categorized using the Fannie Mae loan defect taxonomy. Data analysis for any given quarter does not begin until 90 days after the end of the quarter to allow lenders to complete the post-closing quality control cycle, resulting in a delay between the end of the quarter and publication of the data.
NOTE: A critical defect is defined as a defect that would result in the loan being uninsurable or ineligible for sale. The critical defect rate reflects the percentage of loans reviewed for which at least one critical defect was identified during the post-closing quality control review, and all reported defects are net defects.
Summary of Findings
Q1 2020 continued the downward trend in the overall critical defect rate as observed throughout 2019. The mortgage market was stable and robust for the majority of Q1 2020, with lenders continuing to take advantage of a strong refinance market driven by falling interest rates and equally strong property appreciation. The last couple of weeks of the quarter, however, encompassed the beginning of almost nationwide lockdowns and unprecedented disruption in most Americans’ lives. Whether or not Q1 2020 is metaphorically the “calm before the storm” is something that ACES will be monitoring closely in future reports.
Report highlights include the following findings:
- The overall critical defect rate of 1.56% matched the lowest rate in three years.
- Defects attributed to the credit and income categories rebounded after climbing higher in Q4 2019.
- Increases in the share of refinances (5%) and conventional loans (2%) contributed to the improvement in the overall defect rate.
- Early Payment Defaults are on the rise.
QC Industry Trends – Overview
The overall critical defect rate fell to 1.56% in Q1 2020, matching Q3 2019 and representing a multi-year low. The previous low was 1.53% in Q4 2016. The current quarter’s rate is 9.8% lower than the prior quarter’s rate of 1.73%.
With the strong start to 2020, the market is taking advantage of the combination of falling interest rates, employment numbers not yet impacted by COVID-19, and steady property appreciation. All of these factors contributed to increases in the share of both refinances and conventional loans, which historically have lower manufacturing defects. For reference1, mortgage interest rates hit an all-time low of 3.29% on March 5, though this would be the first of many record lows to come in Q2 driven by the pandemic and government programs designed to stimulate the economy. The Q1 2020 average mortgage rate was 3.5%, almost a full percentage point lower than the same quarter in 2019 (4.4%). As a result, refinances had 55-60% share compared to purchase transactions, continuing the steady climb from the back half of 2019 and representing an 87% increase over Q1 2019.
Borrowers also saw an opportunity to draw cash from properties via cash-out refinances. Freddie Mac’s refinance datasets show that 42% of all refinances had loan amounts 5% or greater than the balance being refinanced. The same data also followed the down- ward trend in the median age of refinanced loans (2.4 years in Q1 2020 v. 6.2 years in Q1 2019). In total, $26.6 billion in equity was cashed out, the second-highest amount going back to 20082.
Critical Defect Rate by Quarter: Q4 2019 vs Q1 2020
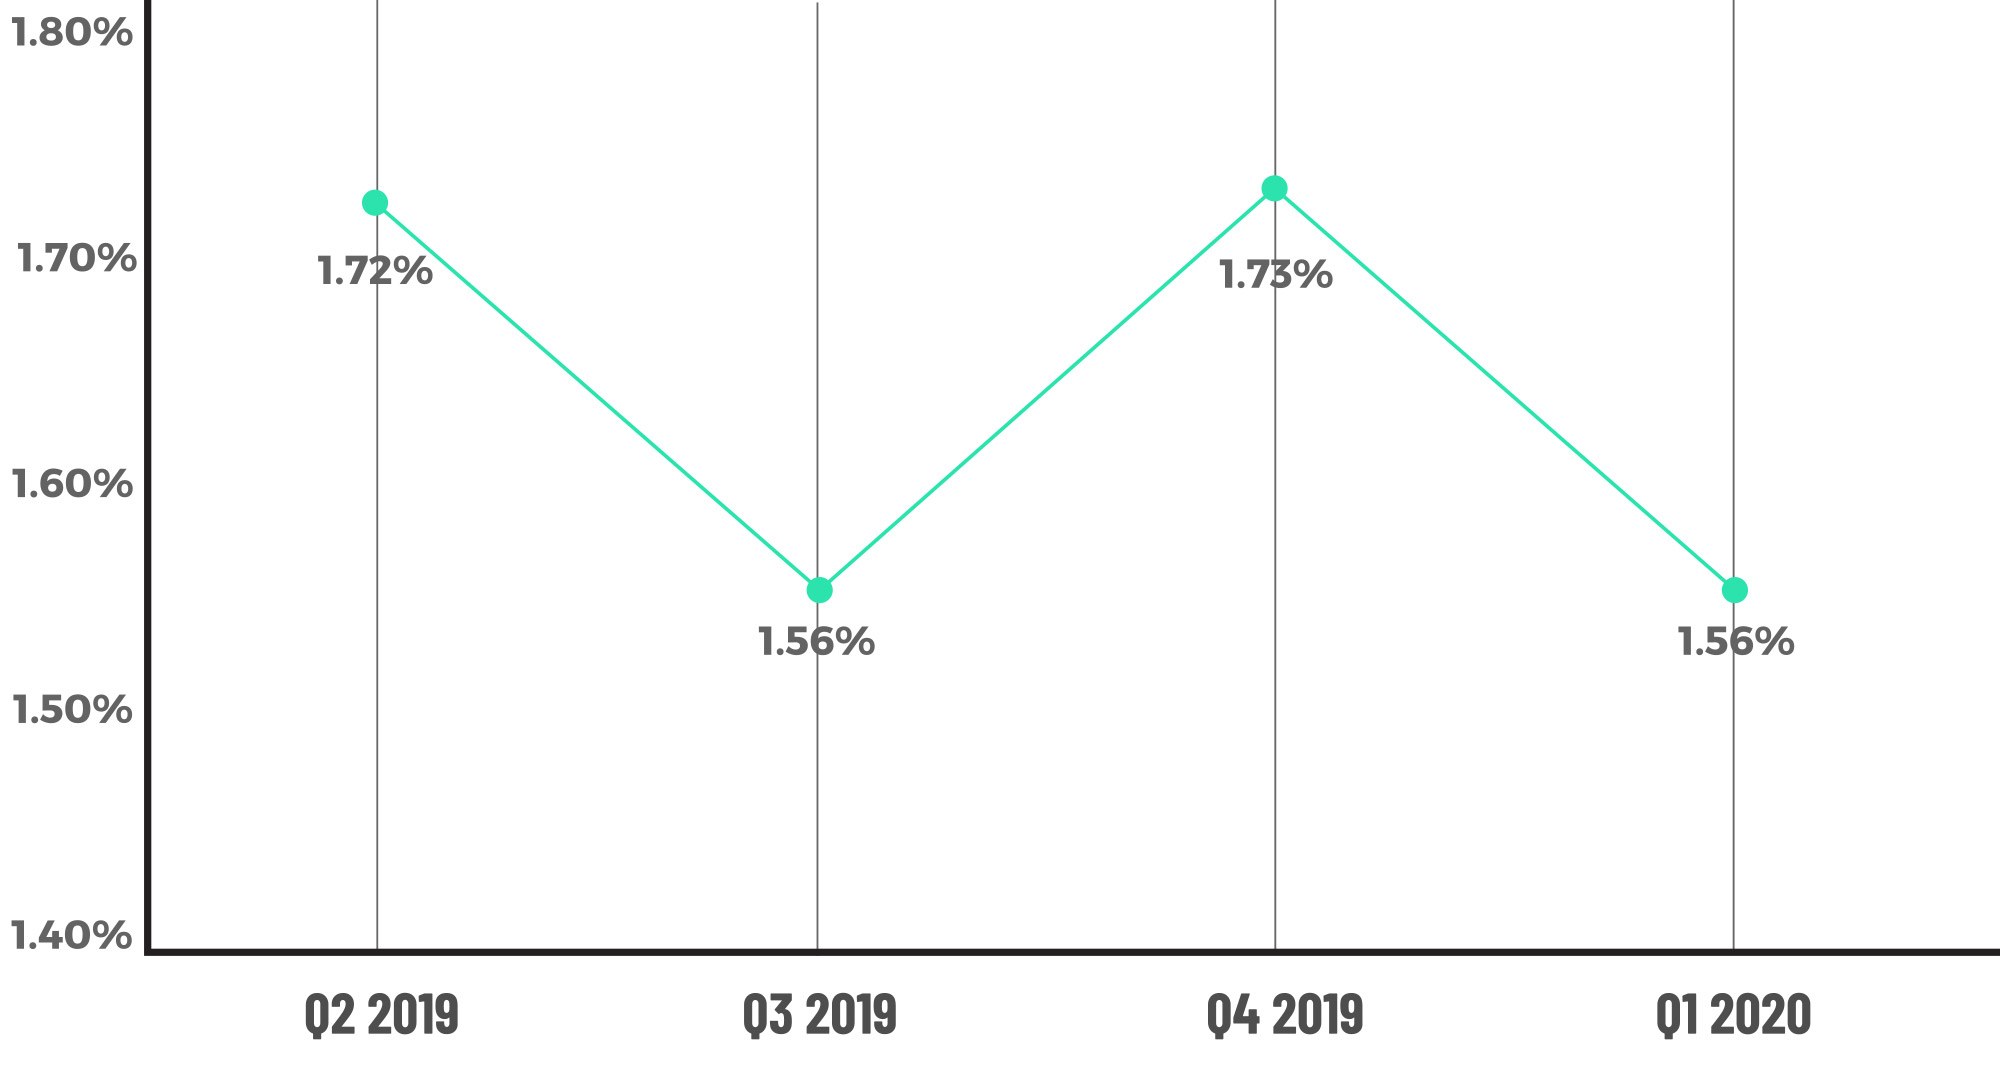
Figure 1 displays critical defect rates by quarter Q2 2019 vs. Q1 2020.
QC Industry Trends by Defect Category
In tracking critical defects rates by defect category, some things never change – but they do sometimes improve. Similar to recent quarters, the Credit and Income/Employment categories were the leading causes of critical defects in Q1 2020. While these were the leading causes of critical defects, the defects in both categories fell in Q1 2020, and from an impact perspective, both fell by a larger percentage than the overall critical defect rate. Income/employment defects comprised 18.35% of all defects, down from 27.22% (a 32% decline). Credit defects ended the quarter at 17.43%, an improvement of 22% from the prior quarter. Improvements in both categories are significant, particularly when con- sidering that loans originated in the last two-to-three weeks of the quarter had potential exposure to COVID-19 economic impacts.
For the remaining ‘big four’ categories, the news was not as positive. Defects attributed to the Assets category ended Q1 2020 at 10.09%, up from 5.92% in the prior quarter. The Liabilities category also rose and finished the quarter at 7.34%, more than double Q4 2019’s rate of 2.96%.
How the critical defects are dispersed throughout the categories will be key to consider- ing the impact of COVID-19 in future quarters. There is no question that certain aspects of mortgage loan manufacturing became more difficult, whether it be the difficulties of obtaining appraisals during a nationwide lockdown or requirements for repeated verifi- cation of employment and income during a period of unprecedented changes to the job market. All of this must be considered against the backdrop of exploding volumes, ex- tended underwriting times and the mid-quarter shift to a remote work environment for most, if not all, industry underwriters and processors.
Critical Defects by Fannie Mae Category: Q1 2020
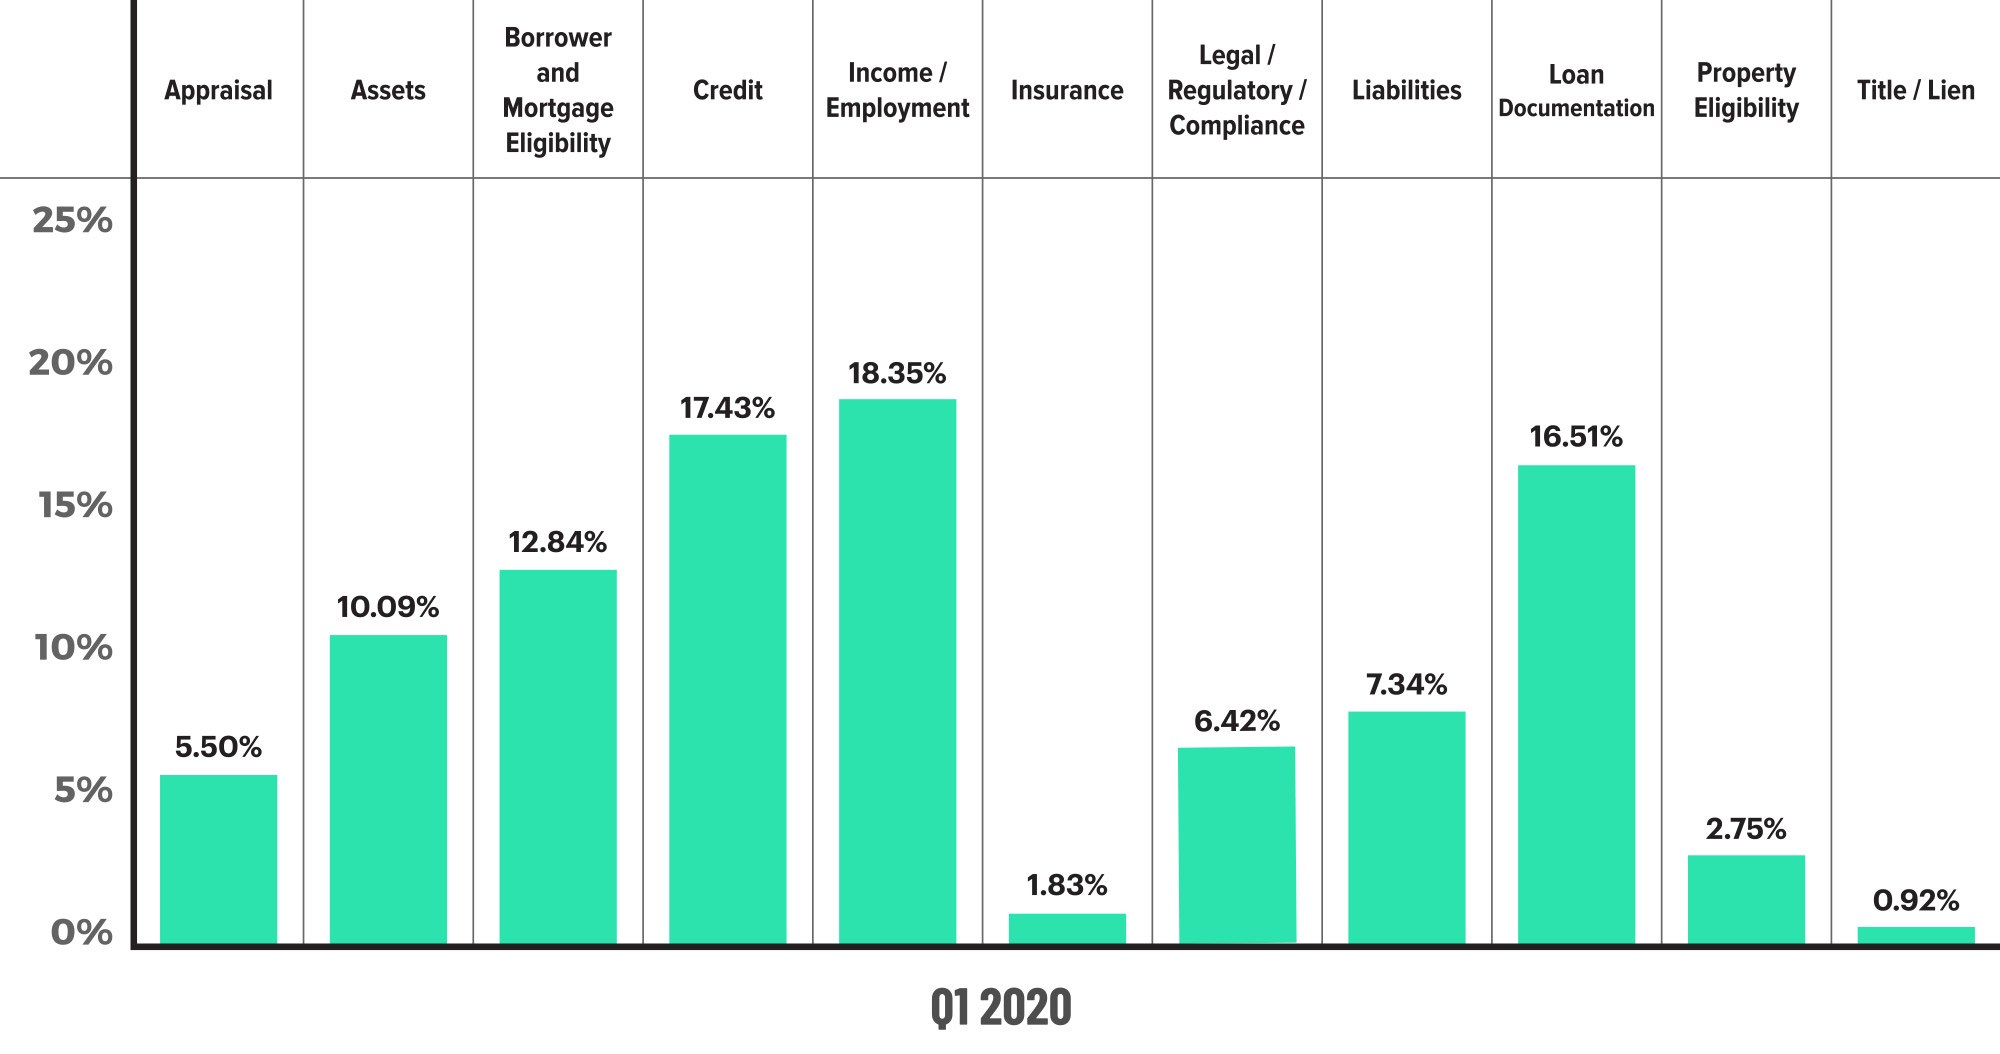
Figure 2 displays the dispersion of critical defects across Fannie Mae categories.
Critical Defects by Fannie Mae Category: Q4 2019 vs. Q1 2020
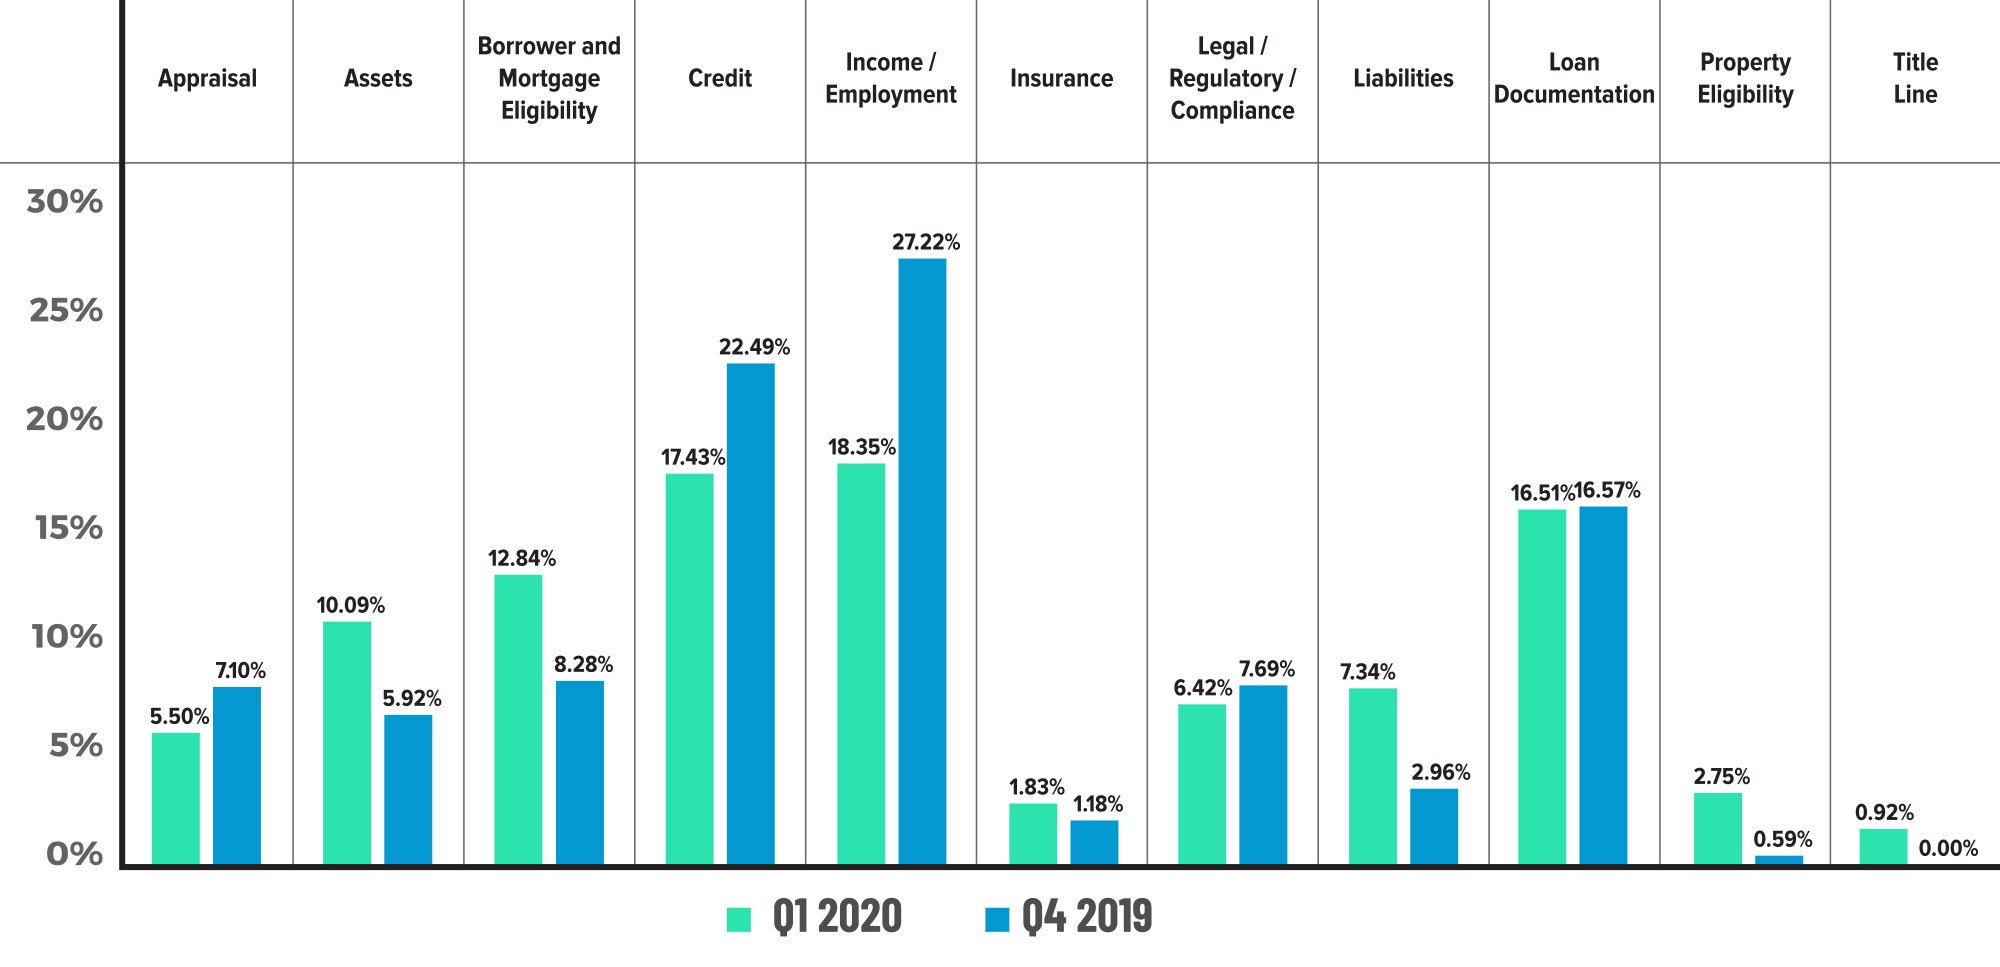
Figure 3 displays the critical defect rate by Fannie Mae category comparing Q1 2020 to Q4 2019.
Fannie Mae Sub-Categories: Q1 2020

Figure 4 displays the individual Fannie Mae Sub-Category for three of the important Categories.
QC Industry Trends by Loan Purpose
The share of refinance and purchase transactions is important to analyze when looking at overall critical defect rates. In Q1 2020, refinances comprised 55-60% of the overall mortgage market. However, refinances made up 51% of the loans uploaded into the ACES Quality Management and Control software by lenders for its Q1 2020 analysis. This is up 45% from CY 2019’s share of 35.39% and is most certainly a driver of the steady performance in the overall critical defect rate.
The percentage of critical defects allocated to refinances and purchases was equal. Refinance share was 51.4%, and the percentage of defects attributed to refinances is 51.5%. Purchase share was 48.6%, and defects on those transactions made up 48.5% of all defects. Equal share and defect percentages indicate operational stability and efficiency inside lending organizations even as volumes climb, while the spread between market share and defect rate can be a leading indicator of larger quality or capacity issues. For example, at the beginning of the current refinance ‘boom’ (Q4 2019), refinances actually underperformed, comprising 44.6% of all loans analyzed but accounting for 49.3% of all defects in that quarter. The reversion back to normal in this current quarter should be viewed as a positive in light of the continued increase in lending volumes expected throughout 2020.
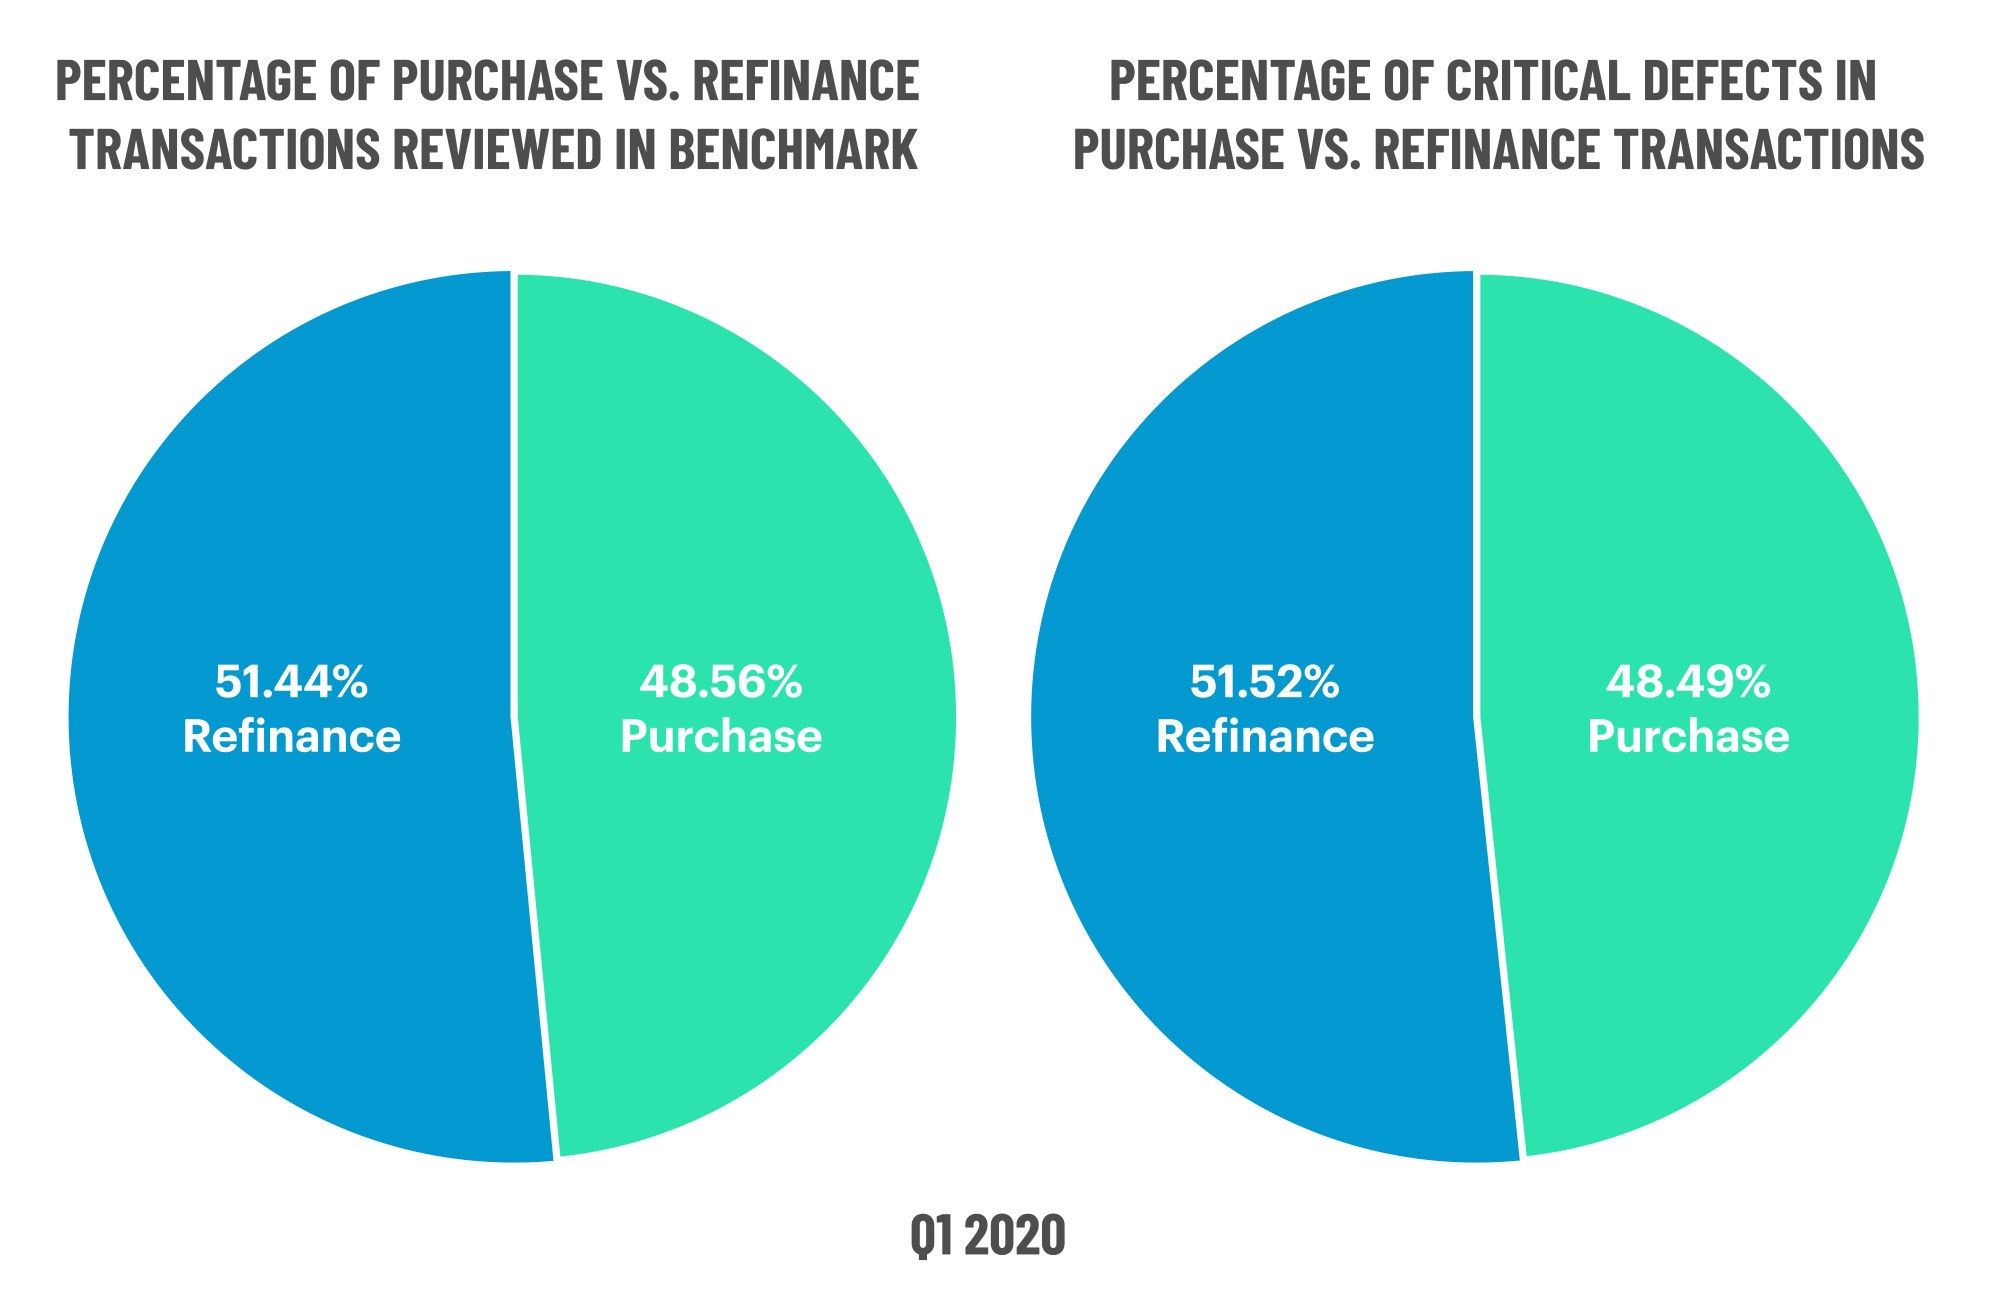
Figure 5 displays the share of transactions by loan purpose compared to the share of critical defects by loan purpose for Q1 2020.
QC Industry Trends by Loan Type
In a declining interest rate environment, conventional loans typically gain market share. That trend was evident in the Q1 2020 loan type metrics. Conventional share was 64.61%, up from 62.51% in Q4 2019. FHA share was relatively flat at 25.66% this quarter compared to 26.11% in the prior quarter. The VA-loan share fell from 8.54% last quarter to 7.22% this quarter, and USDA share was flat.
It is important to look at loan type share and the corresponding share of critical defects. FHA will generally underperform (meaning percent of defects are higher than share) and vice versa with conventional loans. In a testament to the power of refinances on critical defect performance, FHA actually had defect parity, meaning the percentage of critical defects was roughly equal to the FHA share. In a refinance market, a majority of FHA loans are FHA Streamline Refinances (as are other government loan products), which have very limited underwriting and qualification requirements and, therefore, present fewer opportunities for manufacturing errors to be made. Refinance-driven government loan performance combined with an uptick in conventional share contributed positively to the improvement in overall critical defect rates in Q1 2020.

Figure 6 displays the loans reviewed and critical defects by loan type for Q1 2020.
Early Payment Defaults
The data necessary to report on Early Payment Default (“EPD”) trends continues to come in, and ACES Quality Management is conducting its analysis of this data in as close to real time as possible. Lenders face heightened risk on EPD loans ranging from the ability to deliver loans that become EPDs almost immediately after closing, up to and including significant and ongoing repurchase exposure. EPDs also place additional cost and operational burden on lenders.
In February of this year, the unemployment rate (according to official Bureau of Labor statistics) was 3.8%, which translates into 6.2 million people listed as unemployed. Unemployment numbers peaked in April at 23.1 million people (14.7%) before starting to decline in May. The latest monthly statistic available is for July, and the unemployment rate stands at 10.2%, which corresponds to 16.3 million people unemployed.
Dramatic increases in the number of unemployed would likely have a negative impact on EPDs under any circumstances. In the context of the current pandemic cycle, the impact is exacerbated by how rapidly the unemployment rate rose and the unintended consequences of the housing-focused portions of the CARES Act, including mortgage payment relief in the form of “no questions asked” forbearance plans.
And as expected, EPDs are on the rise. In the most recent months (June and July), the number of EPDs reviewed by lenders through the ACES Quality Management and Control Software is 75% higher than the average monthly rate of EPD reviews for 2019. Because an EPD review is triggered only when borrowers fall three or more payments behind, the data shows that the industry is still in the early stages of the problem, and there is a high likelihood that the number of EPDs will continue to increase. What is more difficult to predict is causation – the mix of EPDs caused by CARES Act forbearance plans versus those caused by unemployment, macroeconomic conditions or underwriting mistakes.
EPD % Increase
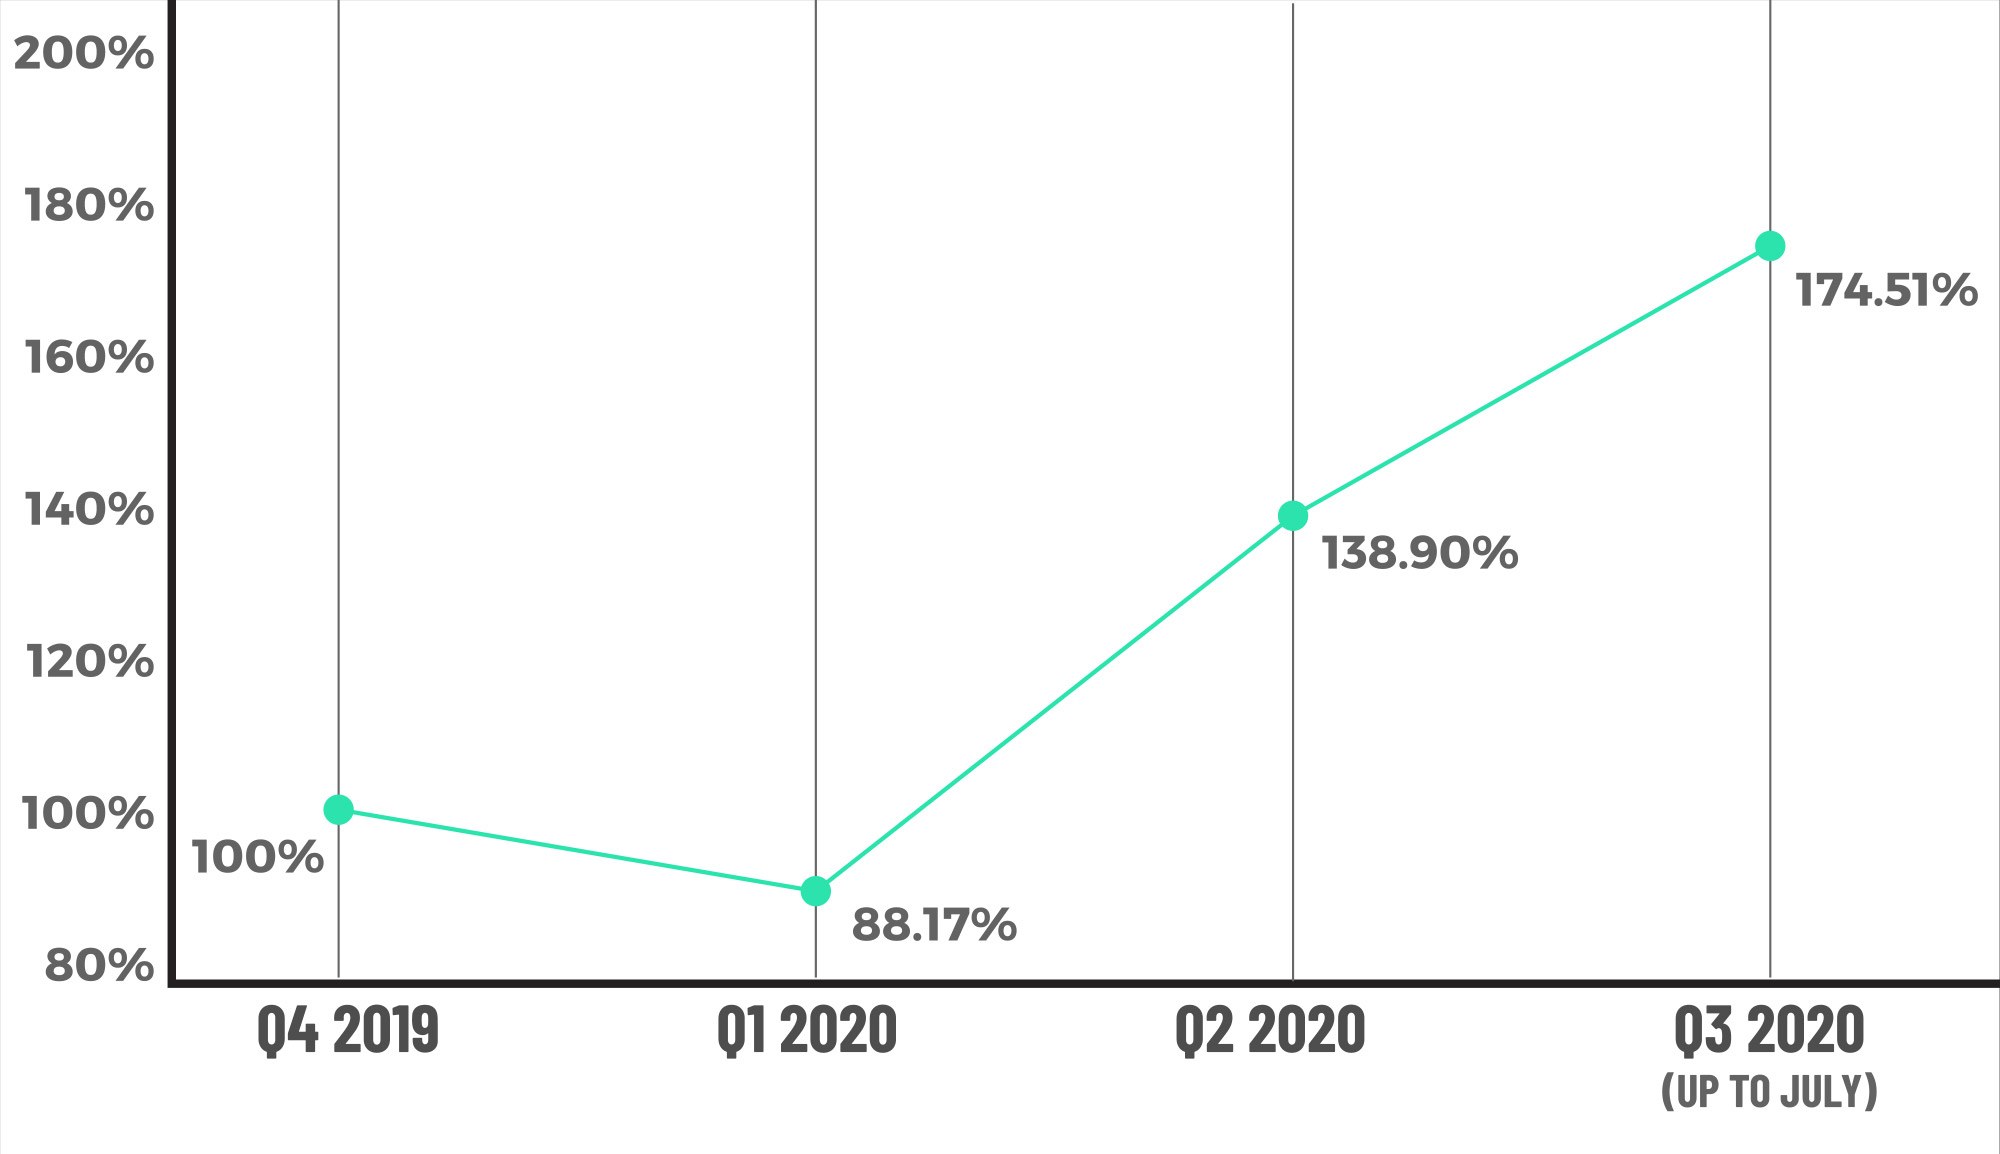
Figure 7 displays the EPD % increase over Q1 and the following quarters.
Conclusion
This report represents the last set of mortgage performance data prior to the arrival of the global pandemic-causing COVID-19 virus. As such, the first quarter of 2020 seems a little like a “last stand” in terms of loan performance, with the road ahead appearing bumpier. As noted throughout this report, there are a number of areas to pay special attention to, as these may be leading indicators of what lies ahead for origination performance.
As it has been since late March, COVID-19 will continue to be an issue of grave and immediate concern, and mortgage performance is not immune to its effects.
What follows is a partial list of the COVID-related hurdles facing the mortgage manufacturing process:
- Job Loss: through July 2020 the U.S. averaged 1+ million new unemployment claims per week for 17 consecutive weeks. This is tragic for far too many families and has also led to changing requirements for lenders. To avoid employment and income defects leading to repurchase/ineligibility, many lenders have moved to performing multiple verifications throughout the underwriting process, up to and including a last-minute verification of employment on the day of closing. With most companies continuing to operate remotely, this only enhances the difficulty of making contact with HR/Finance people to perform these verifications.
- Rapidly Changing Regulations: The federal government, along with the individual states as well as the agencies, have made numerous changes to guidelines and compliance requirements since the beginning of the pandemic. Between March through August 2020, the ACES Quality Management Compliance Team added around 1429 different questions to its ACES Managed Questionnaires, 802 of which were COVID-19 related. However, the sheer enormity of the changes is not the only issue. In a typical environment, compliance changes are deliberate, with notice period, sometimes public comment periods and then lead time to implement. What we have seen since March are change announcements and state executive orders that take immediate effect, the rapid implementation of which poses additional problems for lenders.
- Deferments: the operational burden of the deferment provisions of the CARES Act would seem to fall on servicers more so than lenders. However, because the agencies will not purchase some loans that are subject to forbearance, lenders still face much uncertainty. This includes originating a refinance loan where the existing loan is subject to a forbearance agreement. Most lenders require that the existing loan not have a forbearance agreement in place before proceeding with a refinance.
- Early Payment Defaults: as mentioned above, EPDs create cost and repurchase risk to lenders. The volume of EPDs is likely to continue to climb for at least two more quarters and potentially longer, depending on further government aid or further improvement in the employment statistics.
Exploding volumes and manufacturing complexity will test lenders’ operational abilities in the coming quarters. It is likely that the critical defect rate will climb, and it would not be surprising to see the Compliance and Loan Package Documentation categories to be the primary drivers of any increase. In the meantime, lenders should enjoy the plentiful volume, originate good loans and stay safe!
About the ACES Mortgage QC Industry Trends Report
The ACES Mortgage QC Industry Trends Report represents a nationwide post-closing quality control analysis using data and findings derived from mortgage lenders utilizing the ACES Analytics benchmarking software.
This report provides an in-depth analysis of residential mortgage critical defects as re- ported during post-closing quality control audits. Data presented comprises net critical defects and is categorized in accordance with the Fannie Mae loan defect taxonomy.
About ACES
ACES Quality Management, formerly known as ACES Risk Management (ARMCO),
is the leading provider of enterprise quality management and control software for the financial services industry. The nation’s most prominent lenders, servicers and financial institutions rely on ACES Audit Quality Management & Control® Software to improve audit throughput and quality while controlling costs, including:
- 3 of the top 5 and more than 50% of the top 50 independent mortgage lenders;
- 2 of the top 5 loan servicers; and
- 2 of the top 5 depository institutions.
Unlike other quality control platforms, only ACES delivers Flexible Audit Technology, which gives independent mortgage lenders and financial institutions the ability to easily manage and customize ACES to meet their business needs without having to rely on IT or other outside resources. Using a customer-centric approach, ACES clients get responsive support and access to our experts to maximize their investment.
For more information, visit https://www.acesquality.com or call 1-800-858-1598.
Media Contact: Lindsey Neal | DepthPR for ACES | (404) 549-9282 | lindsey@depthpr.com
1. http://www.freddiemac.com/research/insight/20200706_refi_trends_first_quarter_2020.page
2. http://www.freddiemac.com/research/datasets/refinance-stats/index.page