ACES’ Mortgage QC Industry Trends Report represents an analysis of nationwide quality control findings based on data derived from the ACES Quality Management & Control Software.
Executive Summary
QC Industry Trends – Overview
QC Industry Trends – by Category
QC Industry Trends – by Loan Purpose
QC Industry Trends – by Loan Type
Early Payment Defaults
Conclusion
About this Report
Executive Summary
This report represents an analysis of post-closing quality control data derived from loan files analyzed by the ACES Quality Management and Control™ benchmarking system during the first quarter of 2021 (Q1 2021) and incorporates data from prior quarters and/or calendar years, where applicable.
Findings for the Q1 2021 Trends Report were based on post-closing quality control data from approximately 100,000 unique records. All reviews and defect data that were evaluated for this report were based on loan audits selected by lenders for full file reviews.
Defects are categorized using the Fannie Mae loan defect taxonomy. Data analysis for any given quarter does not begin until 90-days after the end of the quarter to allow lenders to complete the post-closing quality control cycle, resulting in a delay between the end of the quarter and publication of the data.
NOTE: A critical defect is defined as a defect that would result in the loan being uninsurable or ineligible for sale. The critical defect rate reflects the percentage of loans reviewed for which at least one critical defect was identified during the post-closing quality control review, and all reported defects are net defects.
Summary of Findings
The critical defect rate for Q1 2021 fell for the second consecutive quarter, giving us further confidence that the elevated rate in the “COVID quarter” of Q2 2020 was a temporary bump in the road. As we get further away from the disruption caused by the onset of COVID-19, the industry continues to adapt and find ways to originate quality loans. We are still in a very low interest rate environment and have strong refinance volume, even though it seems, to some degree, that the “easy” refinances are in the rear-view mirror. With ever-increasing property values and a lack of available housing inventory, we expect defects to remain steady in future quarters, though we also see some storms on the horizon that we will discuss in this report.
Report highlights include the following findings:
- The downward trend in the critical defect continued in Q1 2021, ending the quarter at 2.01% versus the prior quarter’s rate of 2.09%.
- A rapid rise in the Income/Employment category led all defect categories, with several of the core underwriting/qualification categories increasing as well.
- Declines in the Regulatory Compliance and Loan Documentation categories show that lenders are self-correcting and stabilizing their operations.
- Refinance review share continues to be strong, and defect performance has improved.
- Conventional loans dominated while defect performance declined.
- Early Payment Defaults fall below pre-pandemic levels in a hopeful sign that the worst is behind us, though we remain cautious about loans exiting forbearance status.
QC Industry Trends – Overview
The critical defect rate for Q1 2021 continued the downward trend from Q3 2020’s peak, ending at 2.01%. This rate was down slightly from last quarter’s 2.09% and is 14% lower than the peak of 2.34% in Q3 2020. Even though the decline was modest from last quarter, we do like to see the overall trend heading lower. Given the continued improvement in the macro-economic environment, we remain positive that defect rates can return to the sub-2% levels that we saw for much of 2019 and 2020.
We entered Q1 2021 with a fair amount of uncertainty around interest rates and mortgage lending volumes. The average interest rate on a 30-year fixed rate mortgage1 was 2.67% at the beginning of the quarter and steadily rose through the remainder of the quarter to end at 3.18%. That 3.18% rate is, thus far, the peak of average rates for 2021. Subsequent to the end of the quarter, rates had fallen into the 2.9%-3.0% range. The interest rate environment has, for now, forestalled any major worries of dramatic decreases in volume.
In most other measures, the macro-economic environment continues to improve. After ending the year at 6.7%, the unemployment rate continued to fall throughout the Q1 2021 to a low of 6.0% as of March. The most recently available data (as published on data.bls.gov) shows unemployment at 5.4% at the end of July. While it is difficult to draw a direct link between unemployment rates and mortgage defects, we track it as an important metric of the overall health of the economy. Improvements in the unemployment rate are also likely to be a factor in the resolution of loans in forbearance — one of the largest issues facing the mortgage industry throughout the remainder of 2021.
1 http://www.freddiemac.com/pmms/
Critical Defect Rate by Quarter: Q2 2020 – Q1 2021
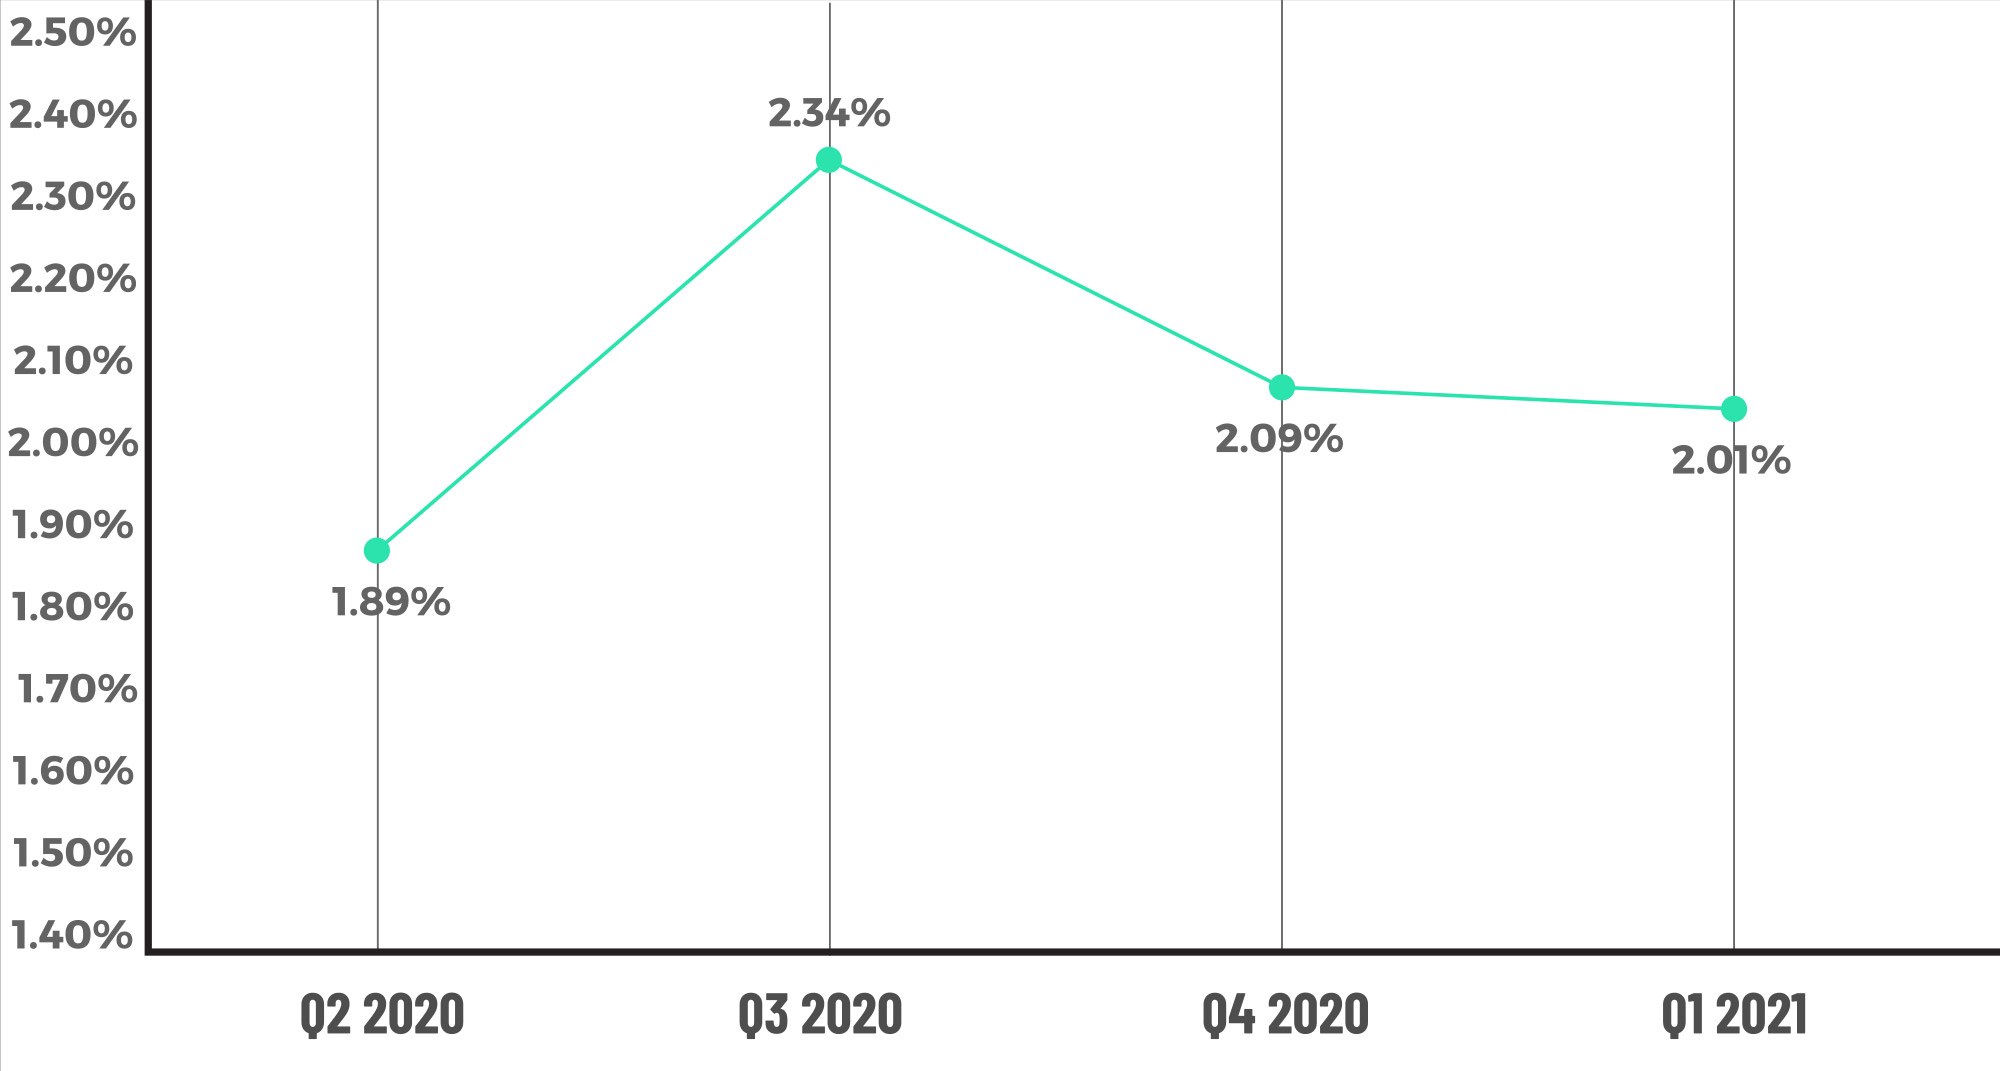
Figure 1 displays the percentage of loans with critical defects by quarter, for Q2 2020 through Q1 2021.
QC Industry Trends by Defect Category
The defects associated with the Income/Employment category continue to dominate all findings. In Q1 2021, Income/Employment defects made up 31.44% percent of all critical defects, an increase of 7.67% from the prior quarter. Last quarter (Q4 2020), the category made up 23.77% of all defects. The increase gives us some level of concern and eclipsed the previous all-time high for this category of 30.19% in Q2 2020 during the peak of COVID.
Figure 4 provides more granular detail on the Income/Employment category, as well as a few others. For Income/Employment, the largest sub-category is Documentation. These are issues relating to expired income documents and/or missing documents. They made up 47.54% of all Income/Employment defects. Right behind documentation was the Eligibility sub-category at 34.43%, with the Income/Employment Calculation sub-category at 18.03%.
In addition to the Income/Employment category, two of the three remaining core underwriting and borrower qualification categories saw a rise in defects. Those categories include Assets, which rose from 9.02% last quarter to 12.37% this quarter, and the Credit category which saw a quarter-over-quarter increase of 7.38% to 12.89%. The only core category to see a decline in defect share was Liabilities, which fell from 5.33% to 3.09%.
Many of the manufacturing-related categories experienced decreases in defect share, led by the Compliance category. This area comprised 9.28% of the defects by category in Q1 2021, representing a decline from the previous quarter’s 21.31% defect share. Additionally, the Loan Documentation category saw slight improvements, declining 2.38% from last quarter’s share of 14.75% to 12.37%.
Critical Defects by Fannie Mae Category: Q1 2021
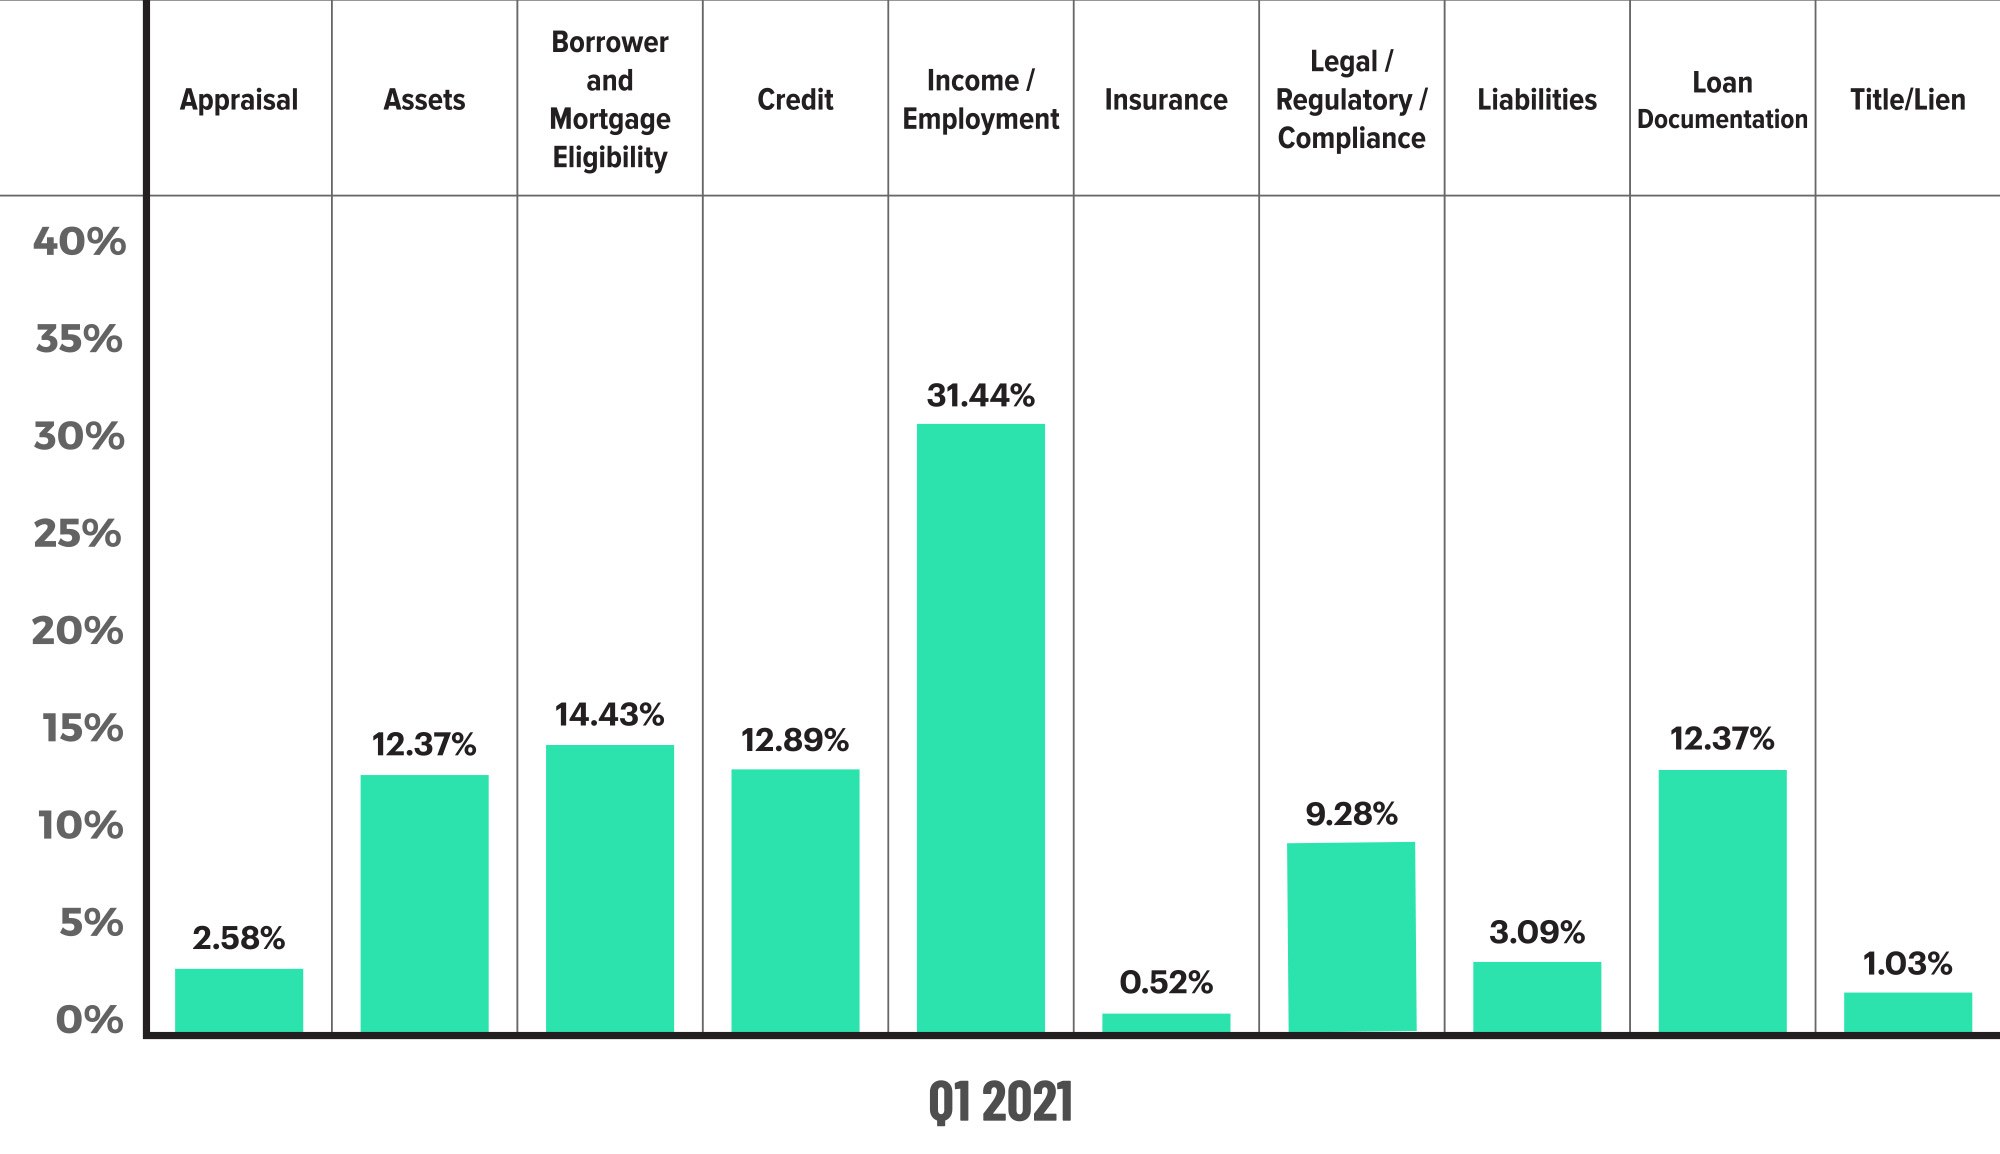
Figure 2 displays the dispersion of critical defects across Fannie Mae categories for Q1 2021.
Critical Defects by Fannie Mae Category: Q4 2020 vs. Q1 2021
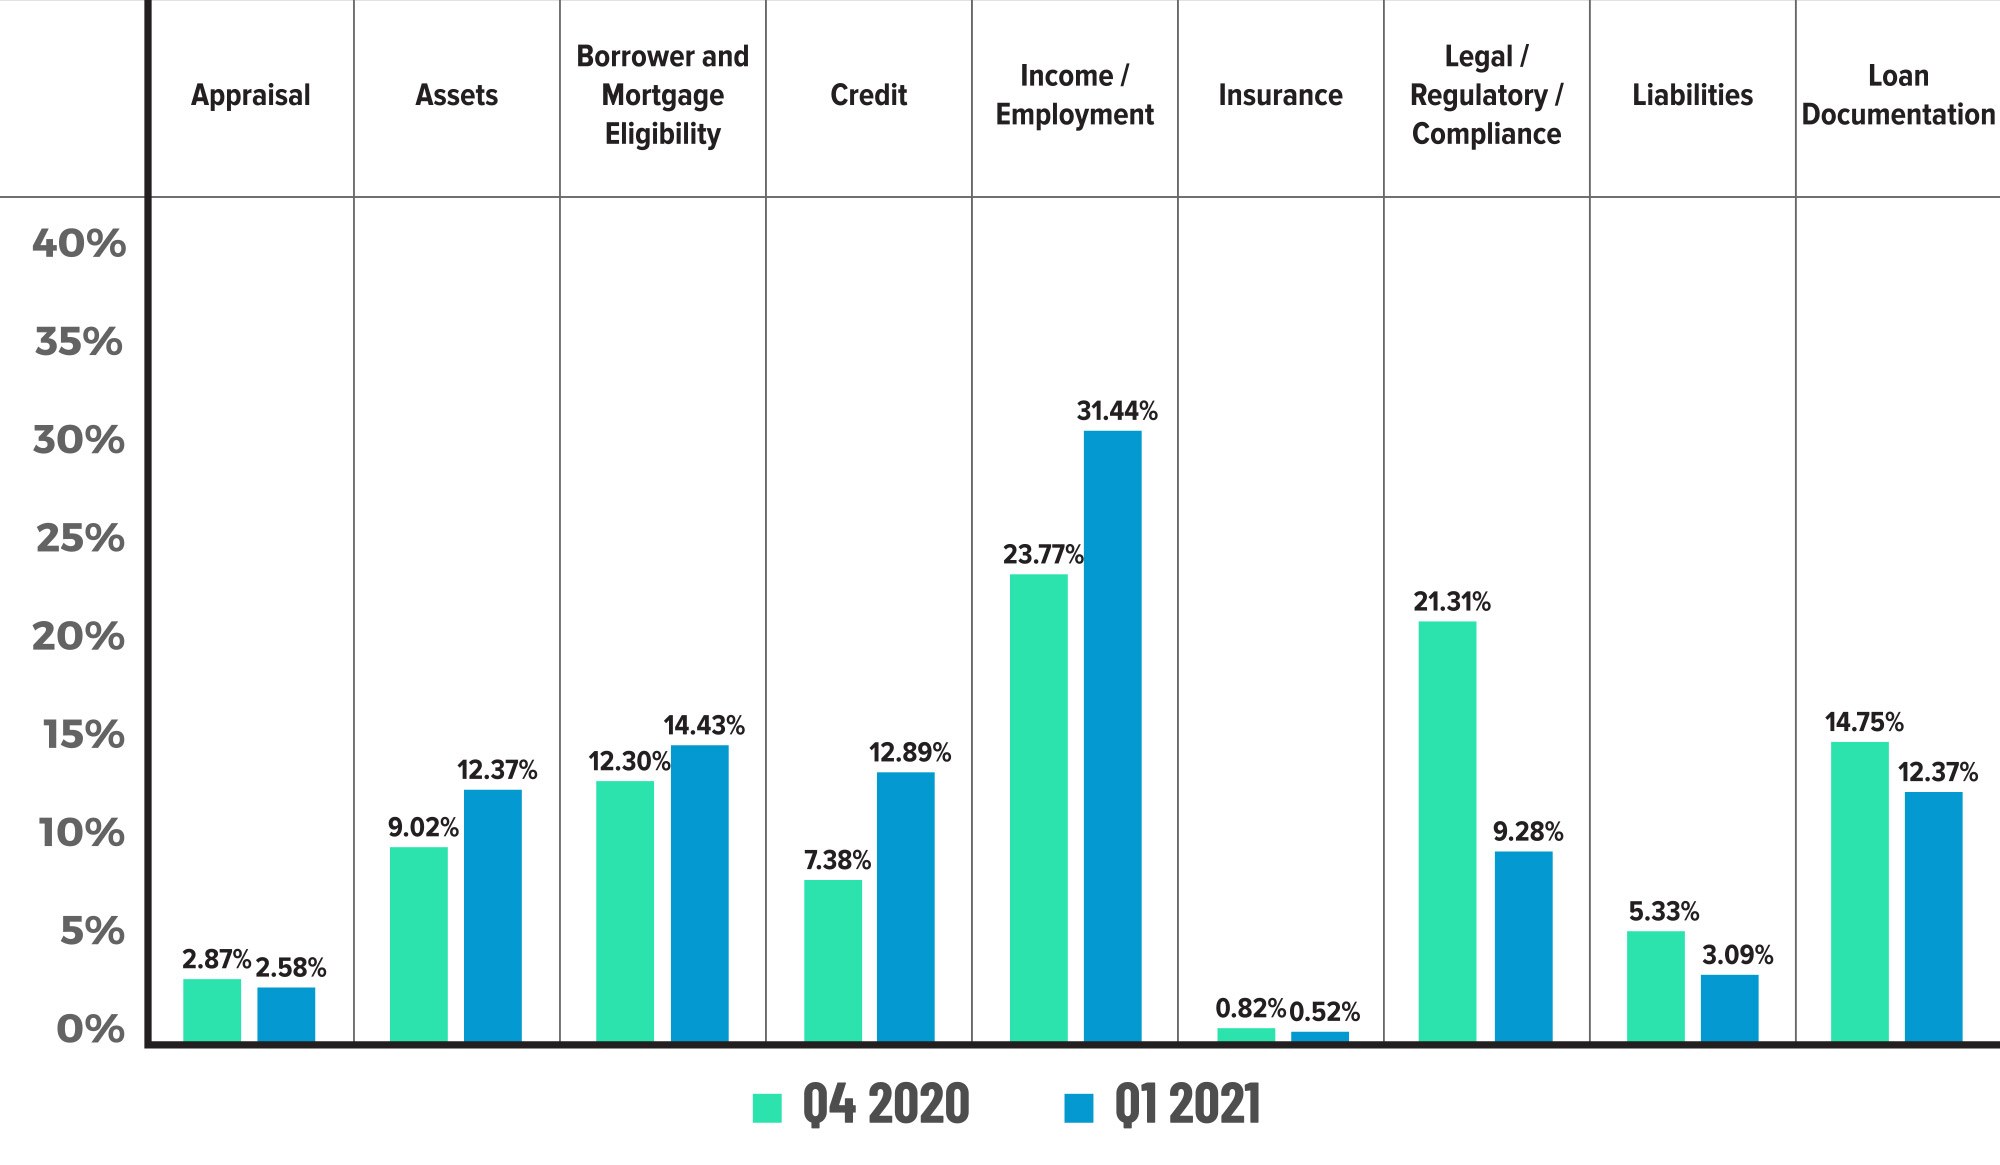
Figure 3 displays the critical defect rate by Fannie Mae category comparing Q4 2020 to Q1 2021.
Critical Defects by Fannie Mae Sub-Category: Q1 2021
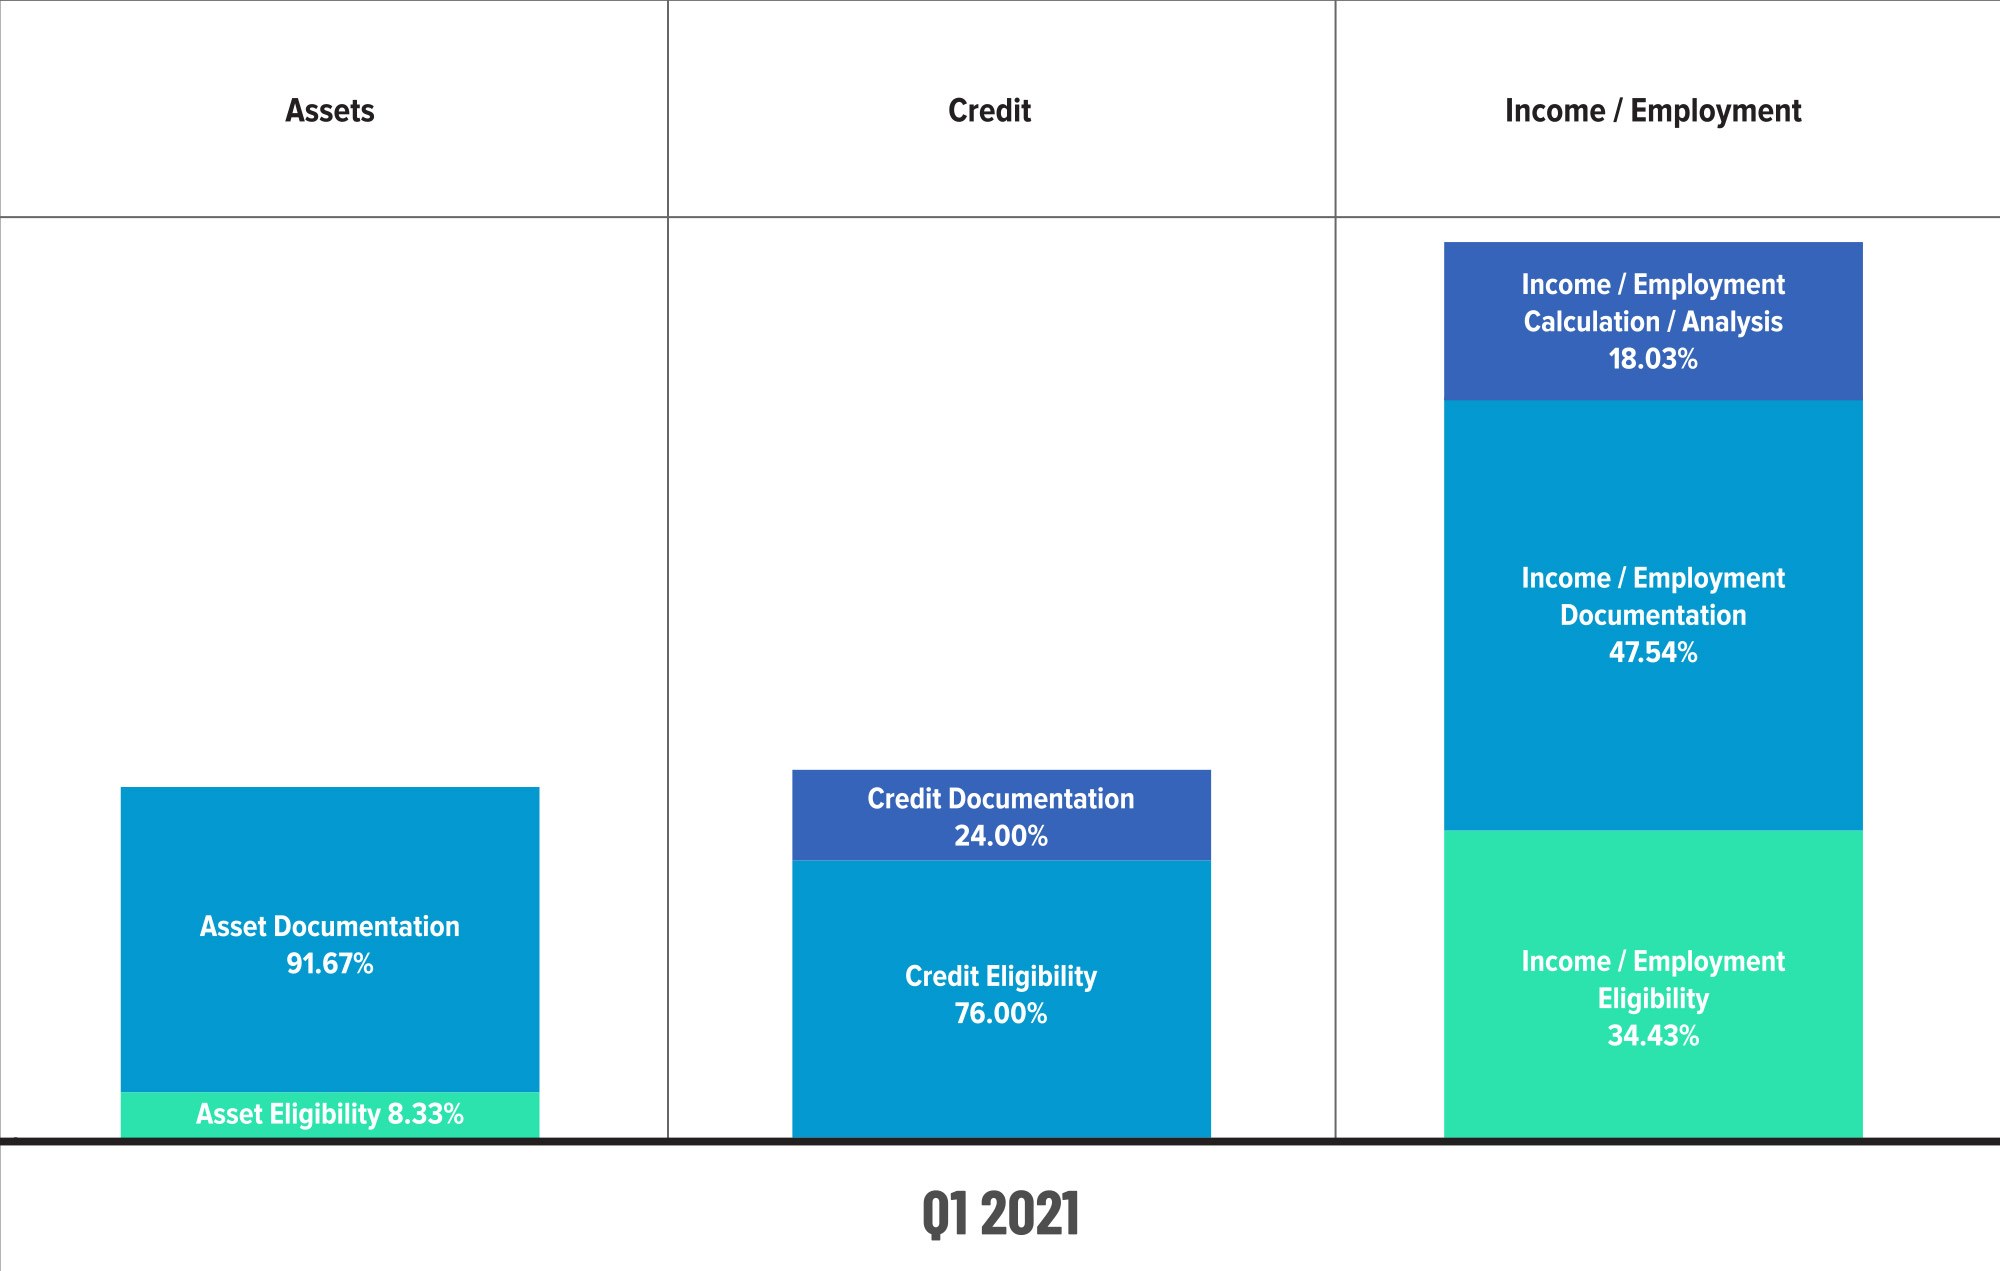
Figure 4 shows the defects by Fannie Mae sub-categories within selected categories for Q1 2021.
QC Industry Trends by Loan Purpose
Defects across the loan purpose spectrum reverted towards historical norms in Q1 2021. Refinances made up 58.56% of the QC reviews conducted during the quarter, but the defects associated with those reviews made up only 49.65% of all defects. The difference between these two numbers is referred to as the “defect spread.” A defect spread of ‘0’ (negative defect spread) means that the share of reviews and defects is equal, so a negative defect spread indicates improved loan quality performance. In Q1 2021, the defect spread was -8.91%, whereas the share of refinance reviews in the previous quarter was 54.20% and the defect share 53.77%, resulting in virtually no spread at all.
While refinance share and defect performance improved, we saw some deterioration in purchase transactions. The share of reviews conducted for purchases was 41.44%, down several percentage points from the prior quarter’s 45.80%. While 41.44% of the reviews were on purchases, those same loans accounted for 50.34% of the defects by loan purpose. That gave purchases a defect spread of +8.90%; meaning that purchases were more likely in Q1 2021 to result in defects than refinance loans.
A surprising discovery over the past year is that refinance performance was lower than historical numbers. In the prior quarter, the share of reviews and defects on refinances (54.20% and 53.77%, respectively) were roughly equal. Q1 2021 is in-line with historical performance and is an area to watch out for as we transition to a purchase-oriented market.
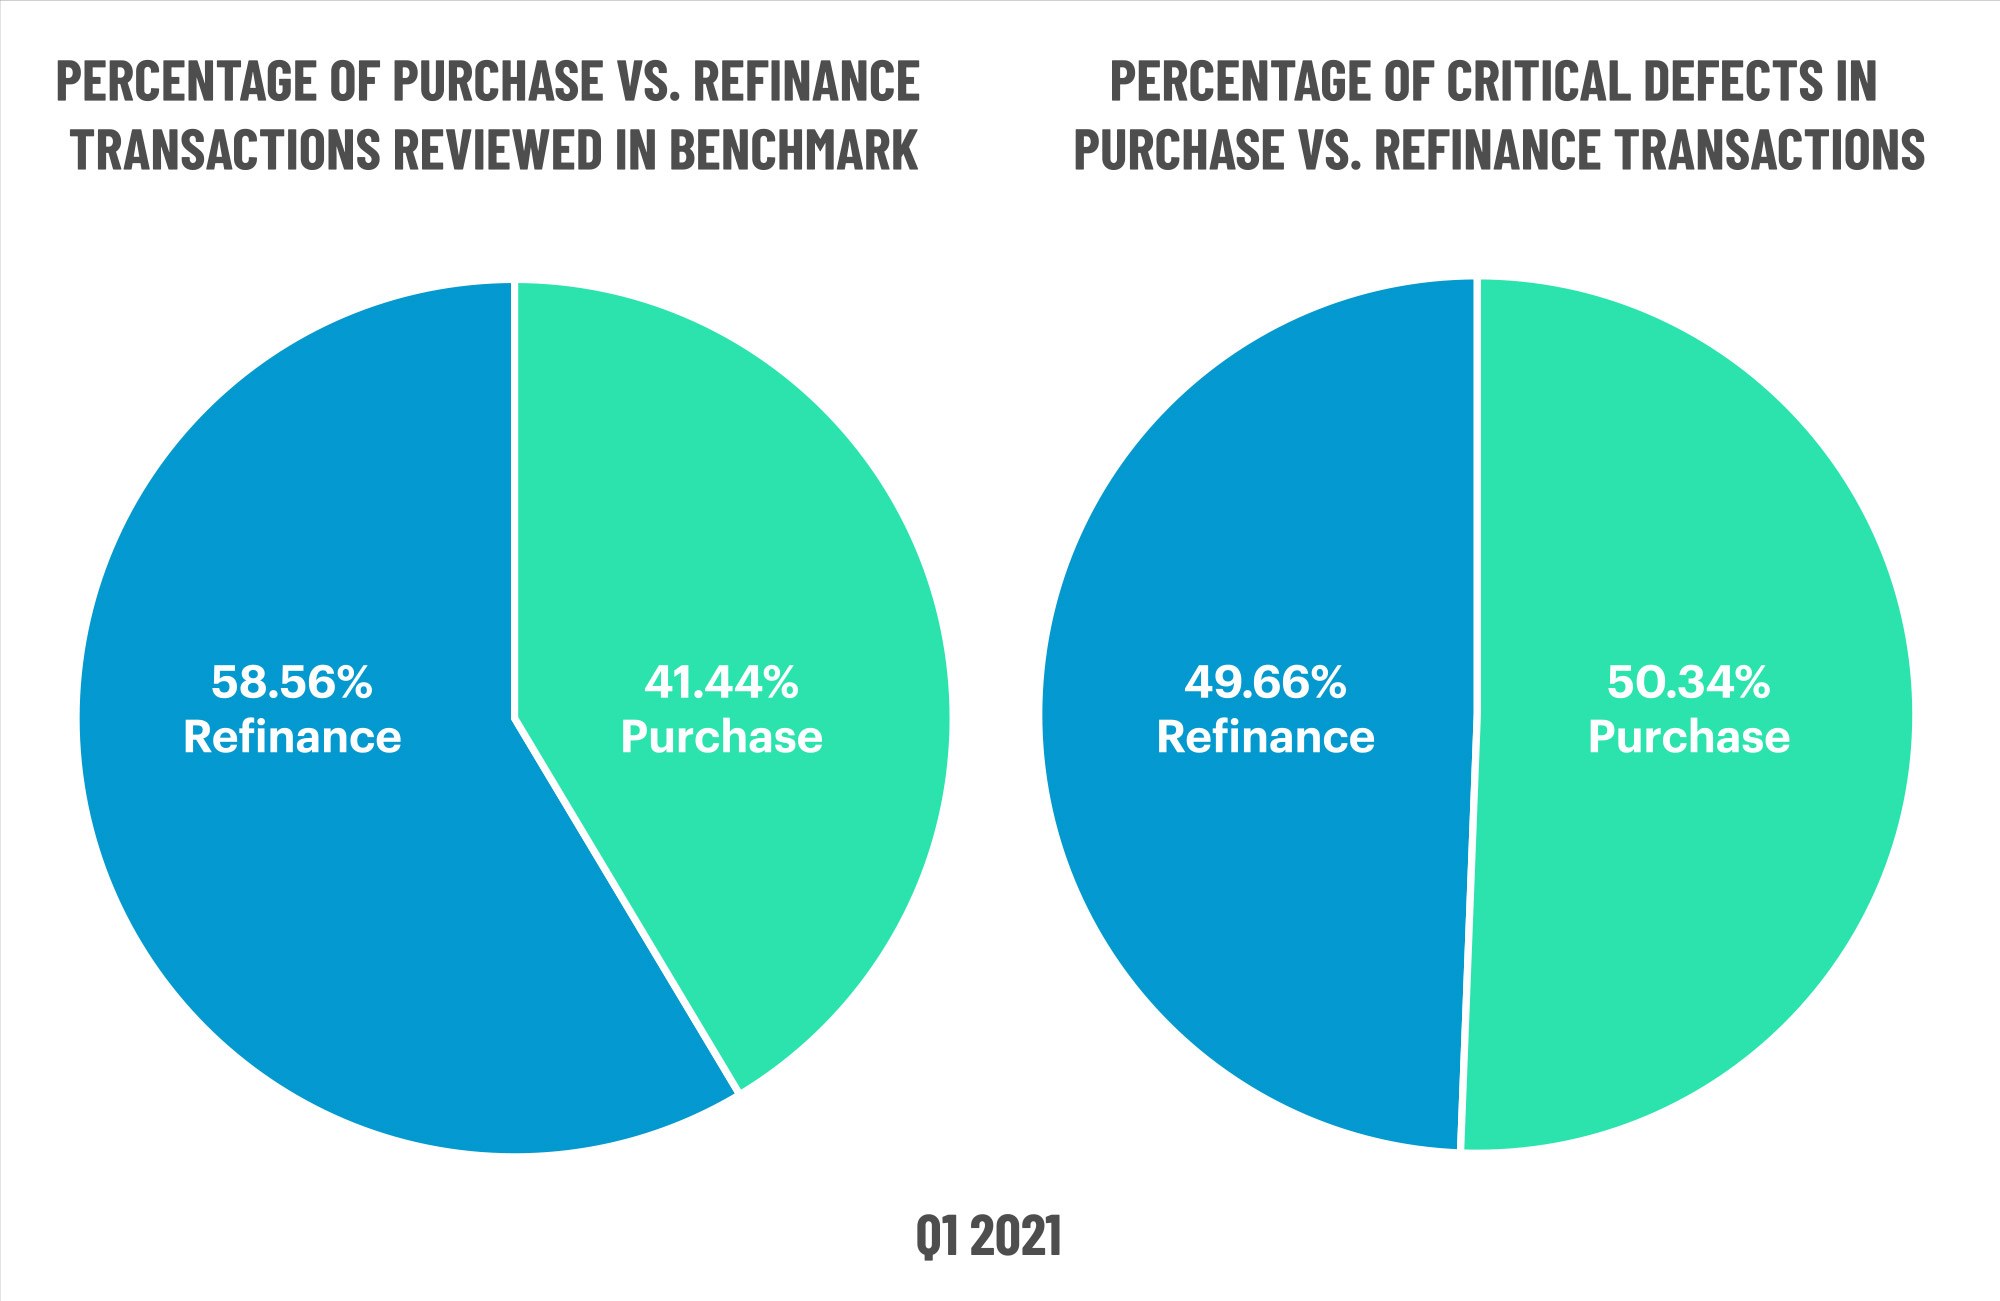
Figure 5 displays the loans reviewed and critical defects by loan purpose for Q1 2021.
QC Industry Trends by Loan Type
Conventional lending once again dominated the QC review share, ending Q1 2021 with 70.50% of all reviews conducted. While still the largest share of all loan types, that is down from the prior quarter’s share of 74.05%. Q4 2020 was the highest percentage of conventional loan share since we began tracking these metrics in 2016. As a result of the moderate decline in conventional loan share, FHA loans picked up a few percentage points and ended the quarter with a share of 21.93%, a slight increase from Q4 2020’s share of 16.16%. The share of VA loans was 6.01%, similar to the previous quarter’s 6.79%, while the quality control review share on USDA loans fell to 1.56% from last quarter’s 3.01%.
We are still seeing what could be considered underperformance in the defect share for conventional loans, which historically have had less defects than other loan types. In Q1 2021, the review share for conventional loans was 70.50% with a defect share of 74.50%. A good portion of the underperformance is due to improvements in FHA lending. FHA loans had a review share of 21.93%, and these loans represented only 18.92% of the defects. This will be another metric to watch closely as we transition into a purchase-driven market where more FHA loans are full purchase reviews and less are streamline refinances.
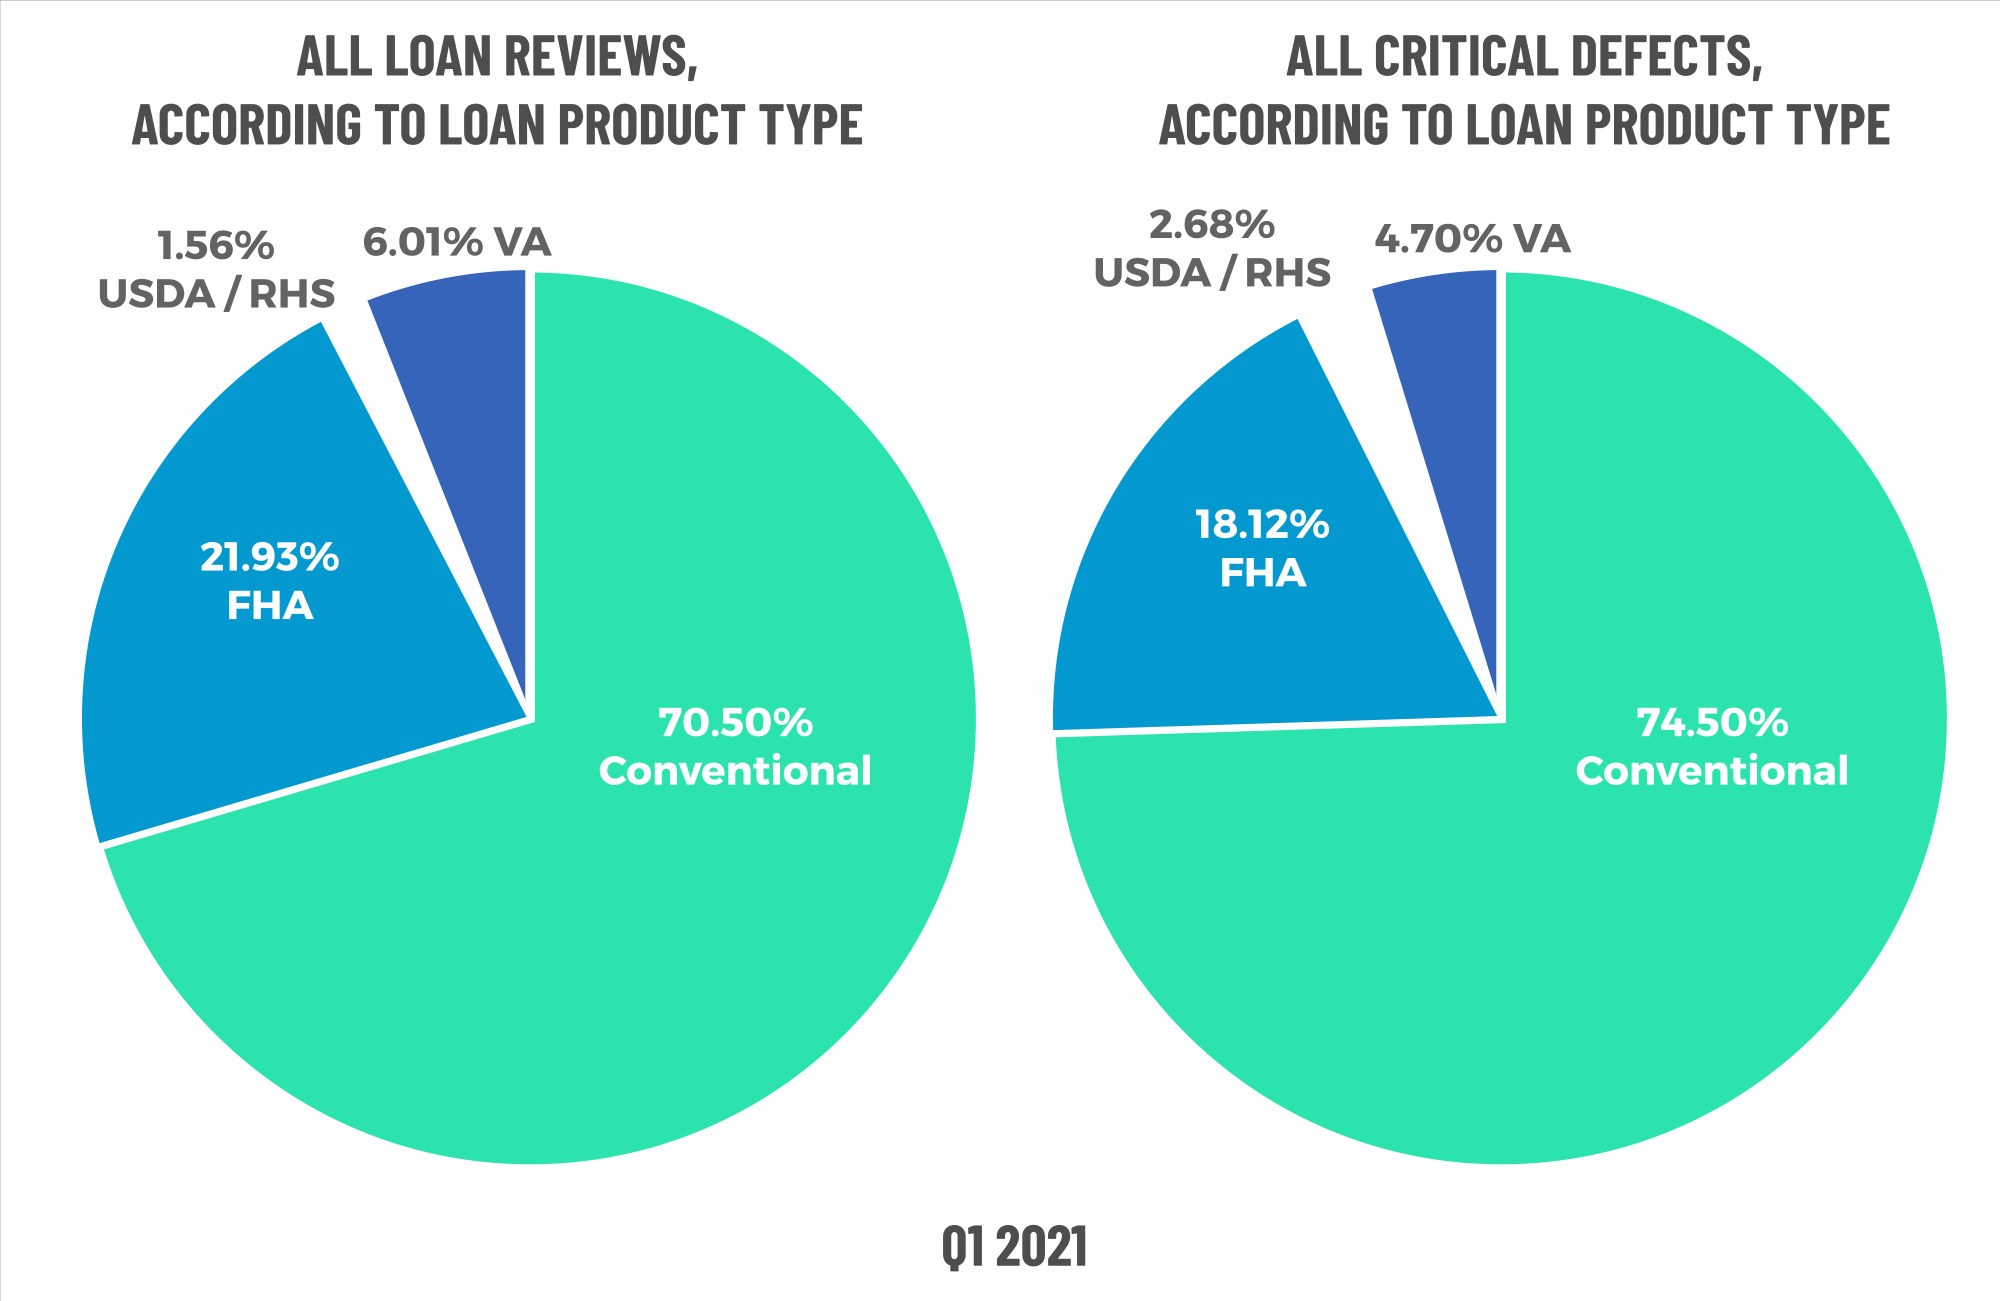
Figure 6 displays the loans reviewed and critical defects by loan type for Q1 2021.
Early Payment Defaults
Of all the metrics in this quarter’s report, Early Payment Defaults (“EPDs”) showed the most improvement. The level of EPDs for Q2 2021 fell below pre-pandemic levels for the first time. For Q2 2021, EPDs were 86.5% of the Q4 2019 numbers (Q2 2019 being the pre-pandemic benchmark).
EPDs overall appear to be on the decline which is in-line with the industry reporting roughly five straight months of declining levels of loans in forbearance. The number of forbearance requests for loans originated just prior to or during the pandemic seem to have tapered off, and EPDs amongst more recently originated loans have been nominal, thus more closely resembling historic levels.
Assuming EPD reviews remain below pre-pandemic levels in Q3 2021 and beyond, our industry can expect an overall lower repurchase risk moving forward. This allows servicers to direct more resources and attention to forbearances, which will undoubtedly prove to be a massive undertaking.
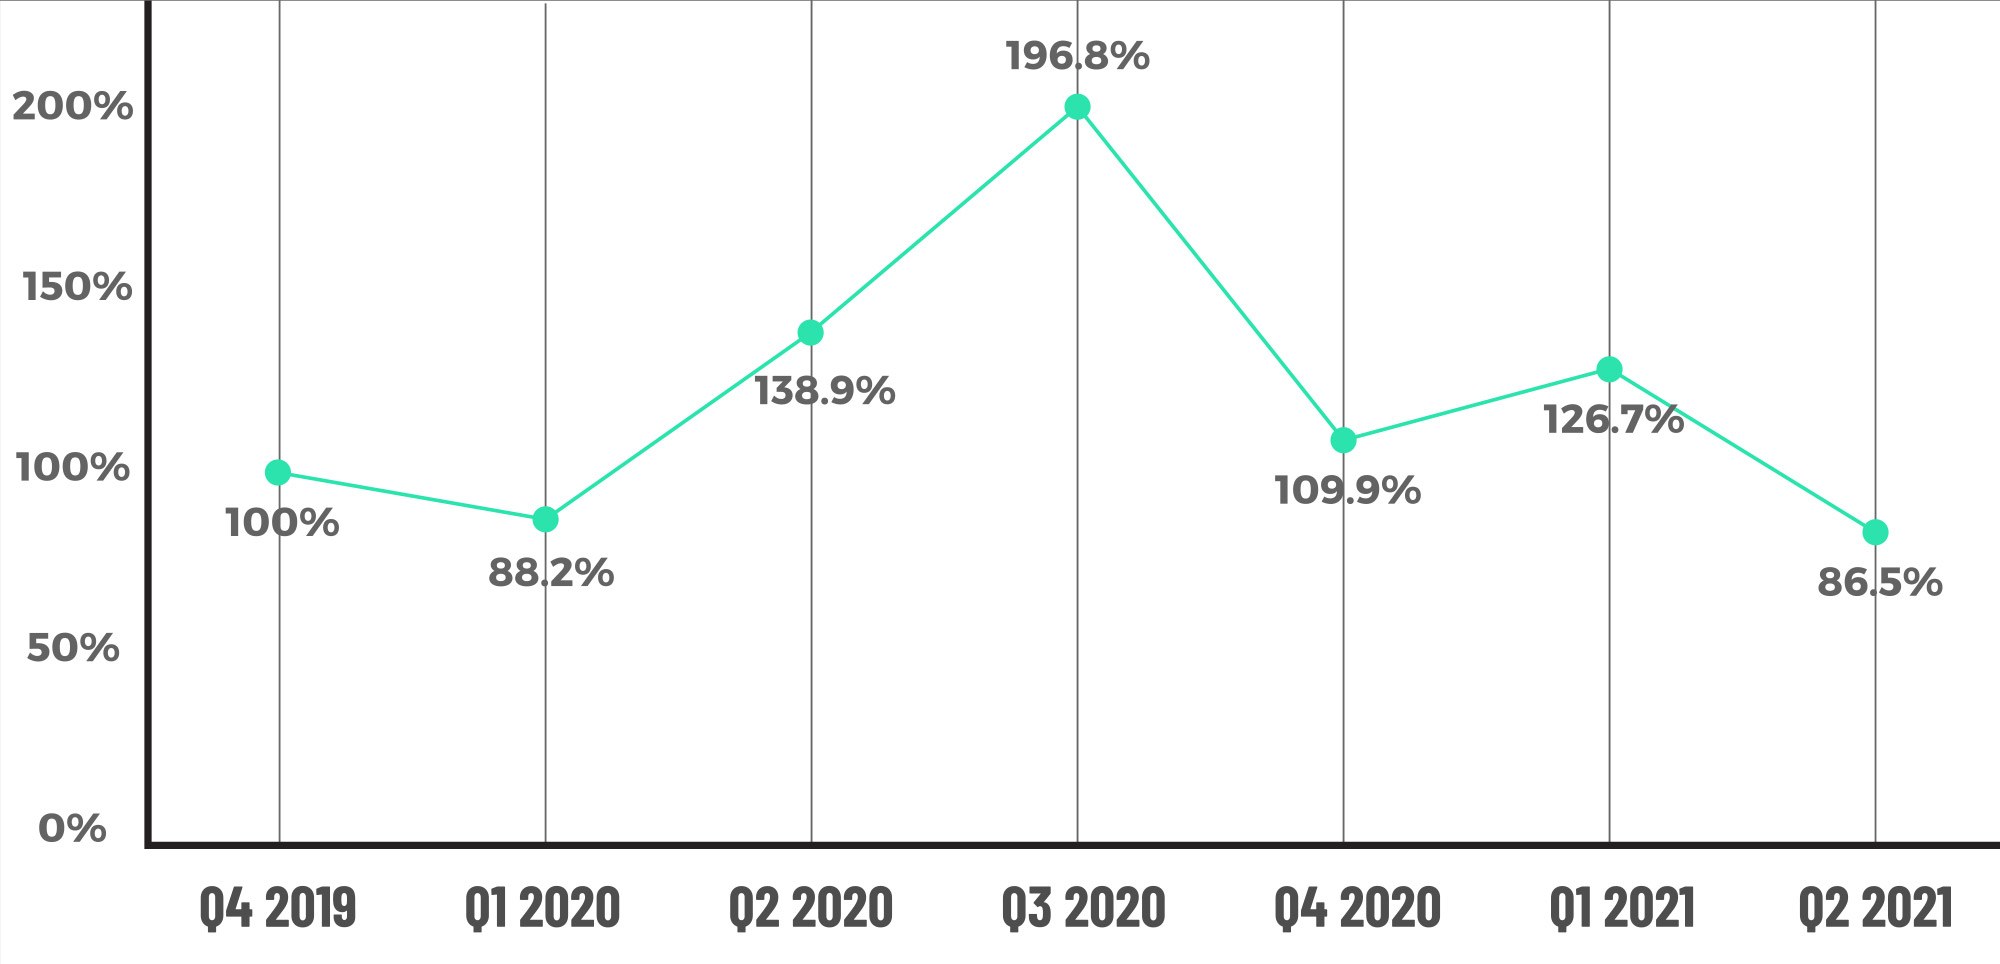
Figure 7 displays the EPD % by quarter from Q4 2019 to Q2 2021.
Conclusion
We see many positive signs from a loan quality and critical defect perspective. The overall defect rate peaked in the “COVID quarter” of Q2 2020 and has moderated since then, with EPDs appearing to return to pre-pandemic rates. Thanks to the steady decrease in interest rates, there is still a strong refinance market and overall housing demand, and the economy continues its rapid recovery. Despite all these positives, lenders and servicers should still be mindful of what is on the horizon. Here are a few areas to watch out for in the remainder of 2021.
2021 Is A Different Market
Most of the speculation for 2021 is centered around whether volumes will stay elevated after a historic 2020. The good news is that volumes are exceeding most forecasts. However, mortgage lending profitability is starting to decline overall. In August, publicly-traded lenders’ financial results for Q2 2021 showed a decline in revenue driven primarily by lower gain-on-sale rates. This is despite the strong increases in lending volume (as compared to the same quarter of 2020).
While several factors drive mortgage lending profitability, gain-on-sale is the single most important metric. The Q2 results for the four largest publicly-traded lenders bear this out. On average, volumes increased 54% compared to the same quarter last year. Total revenue, on average, decreased 49.5% over that same comparable. That’s because gain-on-sale margins came in about half of what they were in Q2 2020 and, in two of the cases, were below 1%. Gain-on- sale margins averaged ~2.5% in 2020. These numbers are important in relation to loan quality because profitability is intertwined with staffing costs (i.e. the largest costs any lender has), and ultimately, changes in staffing levels can have a negative effect on loan quality.
Also, a declining gain-on-sale is common towards the end of a refinance boom as lenders seek to protect (and potentially expand) market share. The filings for the most recent quarter indicate some pricing competition (if not a war), with wholesale being a particular area of concern and several of the lenders mentioning pricing pressure within that channel.
Eviction Moratorium Brings Uncertainty To The Housing Market
As you’ve undoubtedly heard, the Supreme Court blocked President Biden’s order extending the eviction moratorium. For those who have paid attention to this space, the decision was not surprising after the Court begrudgingly allowed the prior moratorium to stand in a July decision, mostly saying that the then in-place moratorium was set to expire on July 31. The July decision by the Court signaled that Congressional action would be required to extend it beyond that date so the administration was on shaky ground to begin with when they extended the moratorium through the end of October.
According to a recent report by Goldman Sachs2, upwards of 750,000 renters could be evicted by the end of 2021 and even more into 2022. That same report estimates that between 2.5 and 3.5 million tenants are behind on rent and owe a combined $12–$17 billion to landlords. Federal, State and local governments do not appear to have a unified strategy, and a main point of friction has been the distribution of assistance under the Emergency Rental Assistance program. The U.S. Treasury Department disbursed $25 billion to state and local governments and is authorized to disburse an additional $20 billion. According to the Goldman report, only $4.5 billion has been distributed to landlords and tenants. Given that the moratorium is now expired, and landlords can immediately begin eviction filings, it is unlikely, given the slow pace thus far, that meaningful amounts of assistance can be distributed in time.
There are very legitimate issues that each side of this debate have, and there appears to be no easy solution to balancing whether landlords/owners should continue to bear the brunt of the pain against the prospect of millions of Americans becoming homeless. For our industry, the biggest concern is what will become of the mortgages associated with these rental properties. Are they loans in forbearance? Will landlords be able to refinance the mortgages with diminished recent rental income? What percentage of the landlords will just sell the properties once they are vacant? Will newly vacant rental properties contribute to a rise in delinquencies? With so much uncertainty, it is important to pay close attention to how the eviction moratorium will affect the mortgage market.
Inflation Controls the Market
Inflation is running hot. Lumber and other raw building materials continue to suffer from supply shortages and elevated prices, and chip shortages are seriously hampering the auto industry, leading to record high prices for used cars and record low sales of new vehicles. Inflation can harm the mortgage industry in a very short period of time, primarily because the main tool that the U.S. government has to cool inflation is to raise short and long-term interest rates, which usually result in a rise in mortgage interest rates. Given the extended stretch of low interest rates, this could have a significant impact on volumes. Low volumes then cascade into staffing changes, pricing pressure, and affordability/underwriting problems.
At the beginning of Q1 2021, the annualized inflation was 1.4%, but by the end of July, the rate rose to 5.4%. When excluding food and energy, the rate was still at 4.3%3. Economists propose that these inflation numbers are elevated primarily due to the global supply chain disruptions resulting from the pandemic, which seems plausible. If these rates continue to rise, there’s a high probability the Federal Reserve will react, which will certainly have a ripple effect on our industry.
2 https://www.cnn.com/2021/08/30/business/household-evictions-goldman-sachs-warning/index.html
3 https://www.bls.gov/news.release/cpi.nr0.htm
About the ACES Mortgage QC Industry Trends Report
The ACES Mortgage QC Industry Trends Report represents a nationwide post-closing quality control analysis using data and findings derived from mortgage lenders utilizing the ACES Analytics benchmarking software.
This report provides an in-depth analysis of residential mortgage critical defects as reported during post-closing quality control audits. Data presented comprises net critical defects and is categorized in accordance with the Fannie Mae loan defect taxonomy.
About ACES
ACES Quality Management, formerly known as ACES Risk Management (ARMCO), is the leading provider of enterprise quality management and control software for the financial services industry. The nation’s most prominent lenders, servicers and financial institutions rely on ACES Quality Management & Control® Software to improve audit throughput and quality while controlling costs, including:
- 3 of the top 5 and more than 50% of the top 50 independent mortgage lenders;
- 7 of the top 10 loan servicers;
- 11 of the top 30 banks; and
- 1 of the top 3 credit unions in the USA.
Unlike other quality control platforms, only ACES delivers Flexible Audit Technology, which gives independent mortgage lenders and financial institutions the ability to easily manage and customize ACES to meet their business needs without having to rely on IT or other outside resources. Using a customer-centric approach, ACES clients get responsive support and access to our experts to maximize their investment.
For more information, visit www.acesquality.com or call 1-800-858-1598.
Media Contact: Lindsey Neal | DepthPR for ACES | (404) 549-9282 | lindsey@depthpr.com
View all reports