ACES’ Mortgage QC Industry Trends Report represents an analysis of nationwide quality control findings based on data derived from the ACES Quality Management & Control Software.
Executive Summary
QC Industry Trends – Overview
QC Industry Trends – by Category
QC Industry Trends – by Loan Purpose
QC Industry Trends – by Loan Product Type
Economic Discussion
Conclusion
About this Report
Executive Summary
This report represents an analysis of post-closing quality control data derived from loan files analyzed by the ACES Quality Management and Control® benchmarking system during the first quarter of 2022 (Q1 2022). The report incorporates data from prior quarters and/or calendar years, where applicable.
Findings for the Q1 2022 Trends Report were based on post-closing quality control data from thousands of unique records. Loan audits selected by lenders for full file reviews served as the basis for all reviews and defect data evaluated for this report.
Defects are categorized using the Fannie Mae loan defect taxonomy. Data analysis for any given quarter does not begin until 90-days after the end of the quarter to allow lenders to complete the post-closing quality control cycle, resulting in a delay between the end of the quarter and data publication.
NOTE: A critical defect is defined as a defect that would result in the loan being uninsurable or ineligible for sale. The critical defect rate reflects the percentage of loans reviewed for which at least one critical defect was identified during the post-closing quality control review. All reported defects are net defects.
Summary of Findings
Defect rates improved slightly in Q1 2022, and the overall critical defect for the quarter was 1.93%. While still higher than pre-pandemic levels, any rate below the 2% threshold is a good result. The mortgage lending environment remains incredibly challenging, with many lenders right-sizing for marked declines in volume and many more relying on mortgage servicing rights markups for most of their earnings. Q1 2022 also brought a material geopolitical event, which added to the inflation-driven increase in interest rates. Loan quality and defects in many categories improved, but performance in the closely watched Income category worsened. Purchase loan share remained primarily unchanged, while FHA lending picked up in this latest quarter.
Report highlights include the following findings:
- The overall critical defect moved down modestly in Q1 2022, ending the quarter at 1.93% and representing a .02% decline from Q4 2022. This comes despite a very difficult environment in the quarter, from rapidly rising interest rates to a geopolitical event that occurred mid-quarter.
- Declining volumes have helped stabilize lender processes, keeping defects at bay, but signs are starting to emerge that the credit box is widening in the hunt for volume.
- The Income/Employment category remains a glaring problem. With the credit box expanding and the fight for volume intensifying, lenders need to be careful not to stretch too far and exacerbate defects in this category.
- The share of appraisal-related defects fell in Q1 2022 after rising in the prior quarter. However, clouds are forming in the property appreciation area, and lenders should pay special attention to this part of the loan origination process going forward.
- Purchase and refinance share remained unchanged from the prior quarter. Conventional loan share continued its multi-quarter trend of decline, with FHA loans filling the void and VA loan share also on the rebound.
- Performance-wise, purchase defects, and more specifically FHA defects, rose, which is expected given purchase loans’ dominance in review share and the increase in FHA loans as part of that mix.
QC Industry Trends – Overview
Critical defects for Q1 2022 improved ever so slightly to 1.93%, a change of -.02% from the prior quarter. We view a defect rate of 2% as an important threshold, and despite an average critical defect rate of 2.01% for the full calendar year of 2021, Q1 2022 marks the second straight quarter that the quarterly defect rate was sub-2%. Thus, defects are trending in the right direction, and within the context of the current mortgage market environment, this improvement, if ever so slight, is a positive sign that lenders are maintaining an acceptable balance between risk and origination volume.
It’s also worth noting that this improvement occurred during a turbulent time in the financial markets and a tough period for mortgage lenders. Inflation caused interest rates to climb and was turbo-charged by the Russian invasion of Ukraine. The average interest rate on a 30-year fixed rate mortgage was 3.08%1 throughout Q4 2021. By mid-February 2022, the rate had risen .84 points to 3.92%, representing an overall increase of 27%. Geopolitics would intervene shortly thereafter when Russia invaded Ukraine on February 24, 2022. The average mortgage interest rate subsequently took off, quickly rising above 4% and ultimately reaching 4.67% by the end of Q1 2022. As a note, and outside of the timeframe of this report, the average mortgage rate continued to rise and peaked at 5.81% on June 23, 2022. The June interest rate peak means mortgage rates are more than double the pandemic low of 2.65%.
Inflation and property valuations remain of outsized importance to mortgage lenders going forward in terms of their effect on gaining new business, and the tide on both of these measurements seems to be working against our industry at the moment.
The Federal Reserve seems determined to raise benchmark rates aggressively, and there doesn’t seem to be a consensus on when that will end. Property valuations remain a wild card and have shown recent signs that increases are leveling, if not declining in some major markets. Unfortunately, very little of this is within the control of mortgage lenders.
1 http://www.freddiemac.com/pmms/
Critical Defect Rate by Quarter: Q2 2021 — Q1 2022

Figure 1 displays the percentage of loans with critical defects by quarter, for Q2 2021 through Q1 2022.
QC Industry Trends by Defect Category
In Q4 2021, defects in the Income/Employment category made up 26.63% of all defects, an improvement over the recent trend. That improvement was short-lived, as those defects roared back to capture a 34.27% share of all defects in Q1 2022. Despite the previous quarter’s improvement, lenders have been unable to shake this category as the largest contributor to defects. Q1 2022 is the tenth straight quarter that the Income/ Employment category had the largest share of critical defects. What is most concerning is that Income defects were high during an outstanding market for lenders. Now that the market has shifted, the likelihood of lenders expanding the credit box and stretching to qualify every loan in search of sustained volume only increases, which could drive defect rates even higher.
Qualifying borrowers was clearly more difficult in Q1 2022, with defects increasing in three of the four “core underwriting” categories. In addition to Income, defects within the Credit category increased from 9.05% last quarter to 11.89%, and the Liabilities category made up 12.59% of defects this quarter versus 10.05% last quarter. The only core underwriting category that saw a decline in defects was the Assets category, where defects were down from 16.08% last quarter to 11.89%.
The most considerable improvement was in the Loan Documentation category, which had a defect share of 9.09% in Q1 2022 compared to the prior quarter’s share of 14.57%. With lower volumes and better turn times, it appears that lenders were able to remove a significant amount of defects caused by missing or expired documents. Another area of improvement to note was in the Appraisal category, where defects fell 3% from last quarter’s share of 7.04% to 4.2%. As property appreciation continues to be volatile and highly localized, lenders should ensure quality control staff are paying extra attention to defects in this area. Overall, the defect share in five categories (Appraisal, Assets, Borrower Eligibility, Insurance, and Loan Documentation) declined from the prior quarter.
Figure 4 below details the issues that make up three key categories: Assets, Credit, and Income/Employment. As in prior quarters, documentation problems within the overall categories are a significant contributor to the credit defects. This is acute in the Assets category, where documentation problems made up 87.5% of all defects in that category. Eligibility problems have increased in all three categories compared to last quarter. In the problematic Income/Employment category, calculation and eligibility issues comprise 53% of all issues in the overall category.
Critical Defects by Fannie Mae Category: Q1 2022
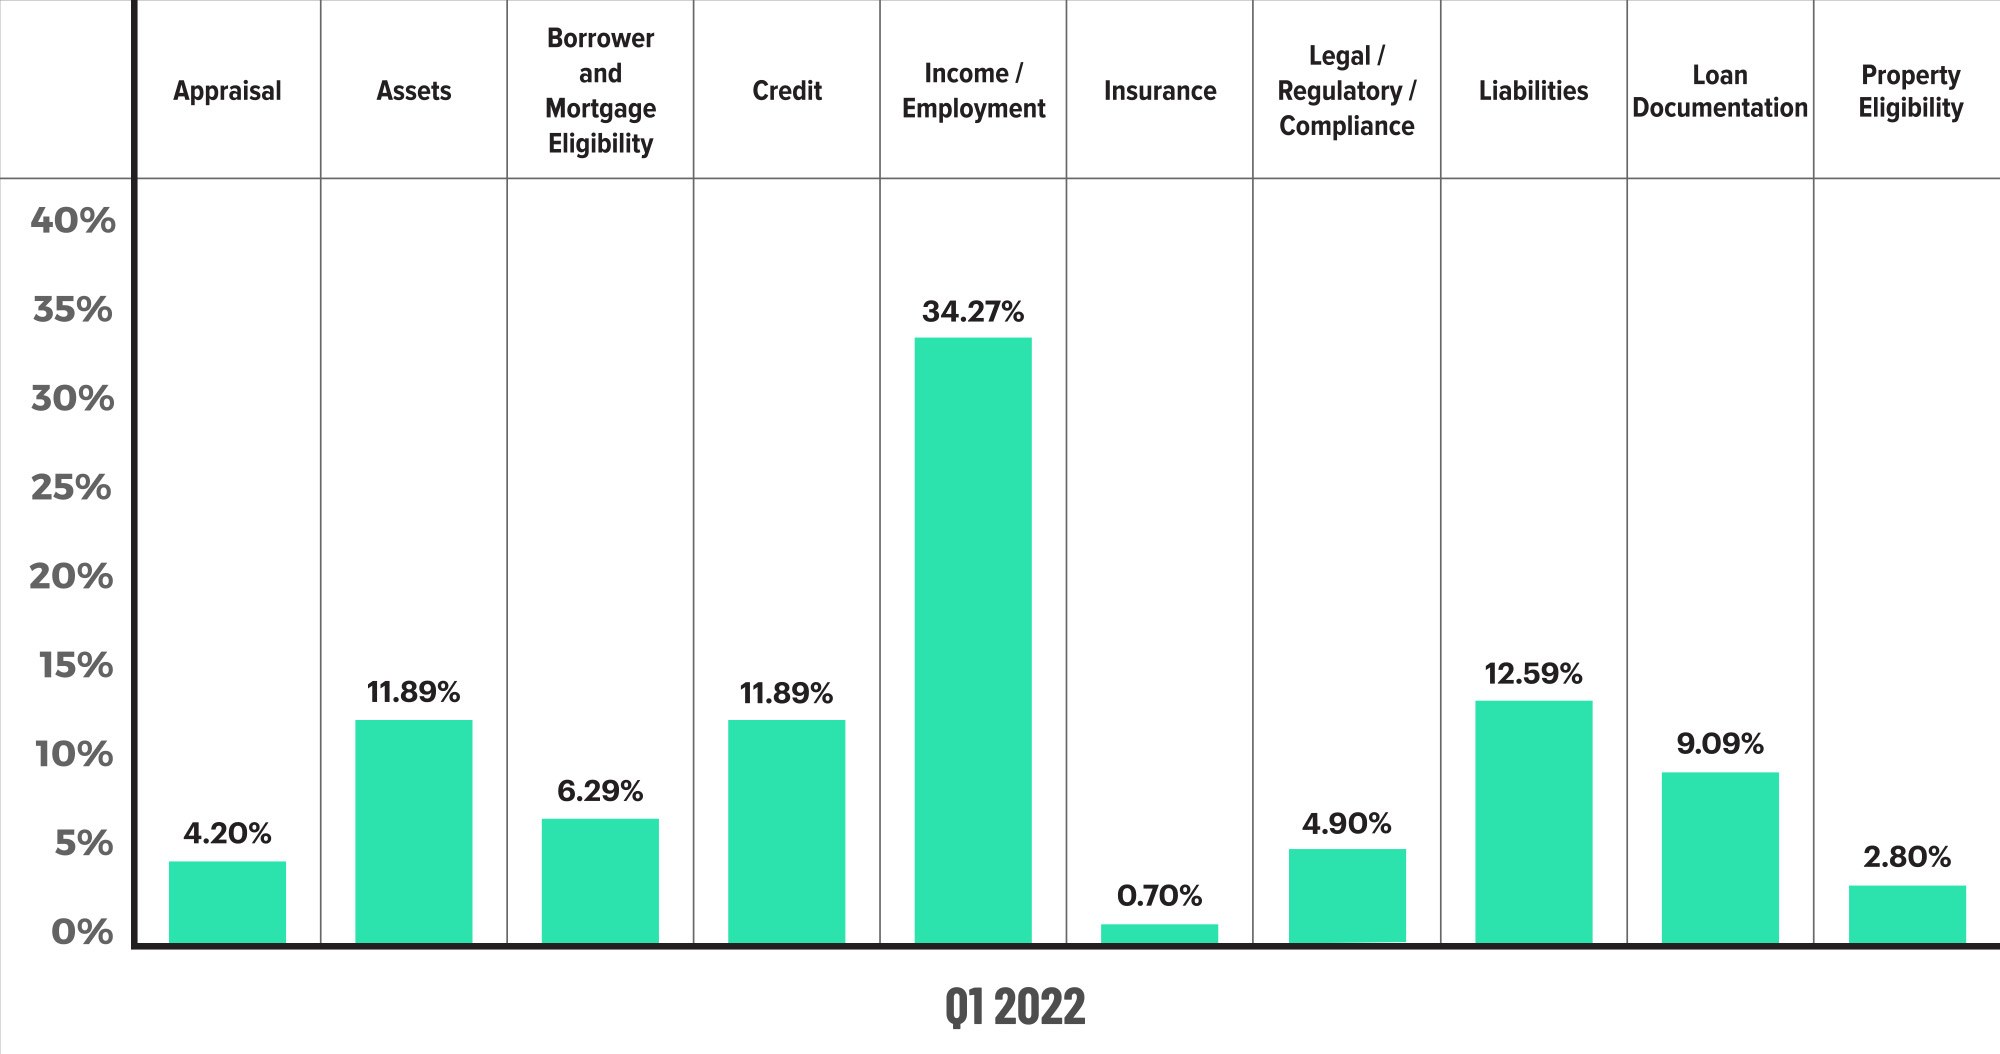
Figure 2 displays the dispersion of critical defects across Fannie Mae categories for Q1 2022.
Critical Defects by Fannie Mae Category: Q4 2021 vs. Q1 2022
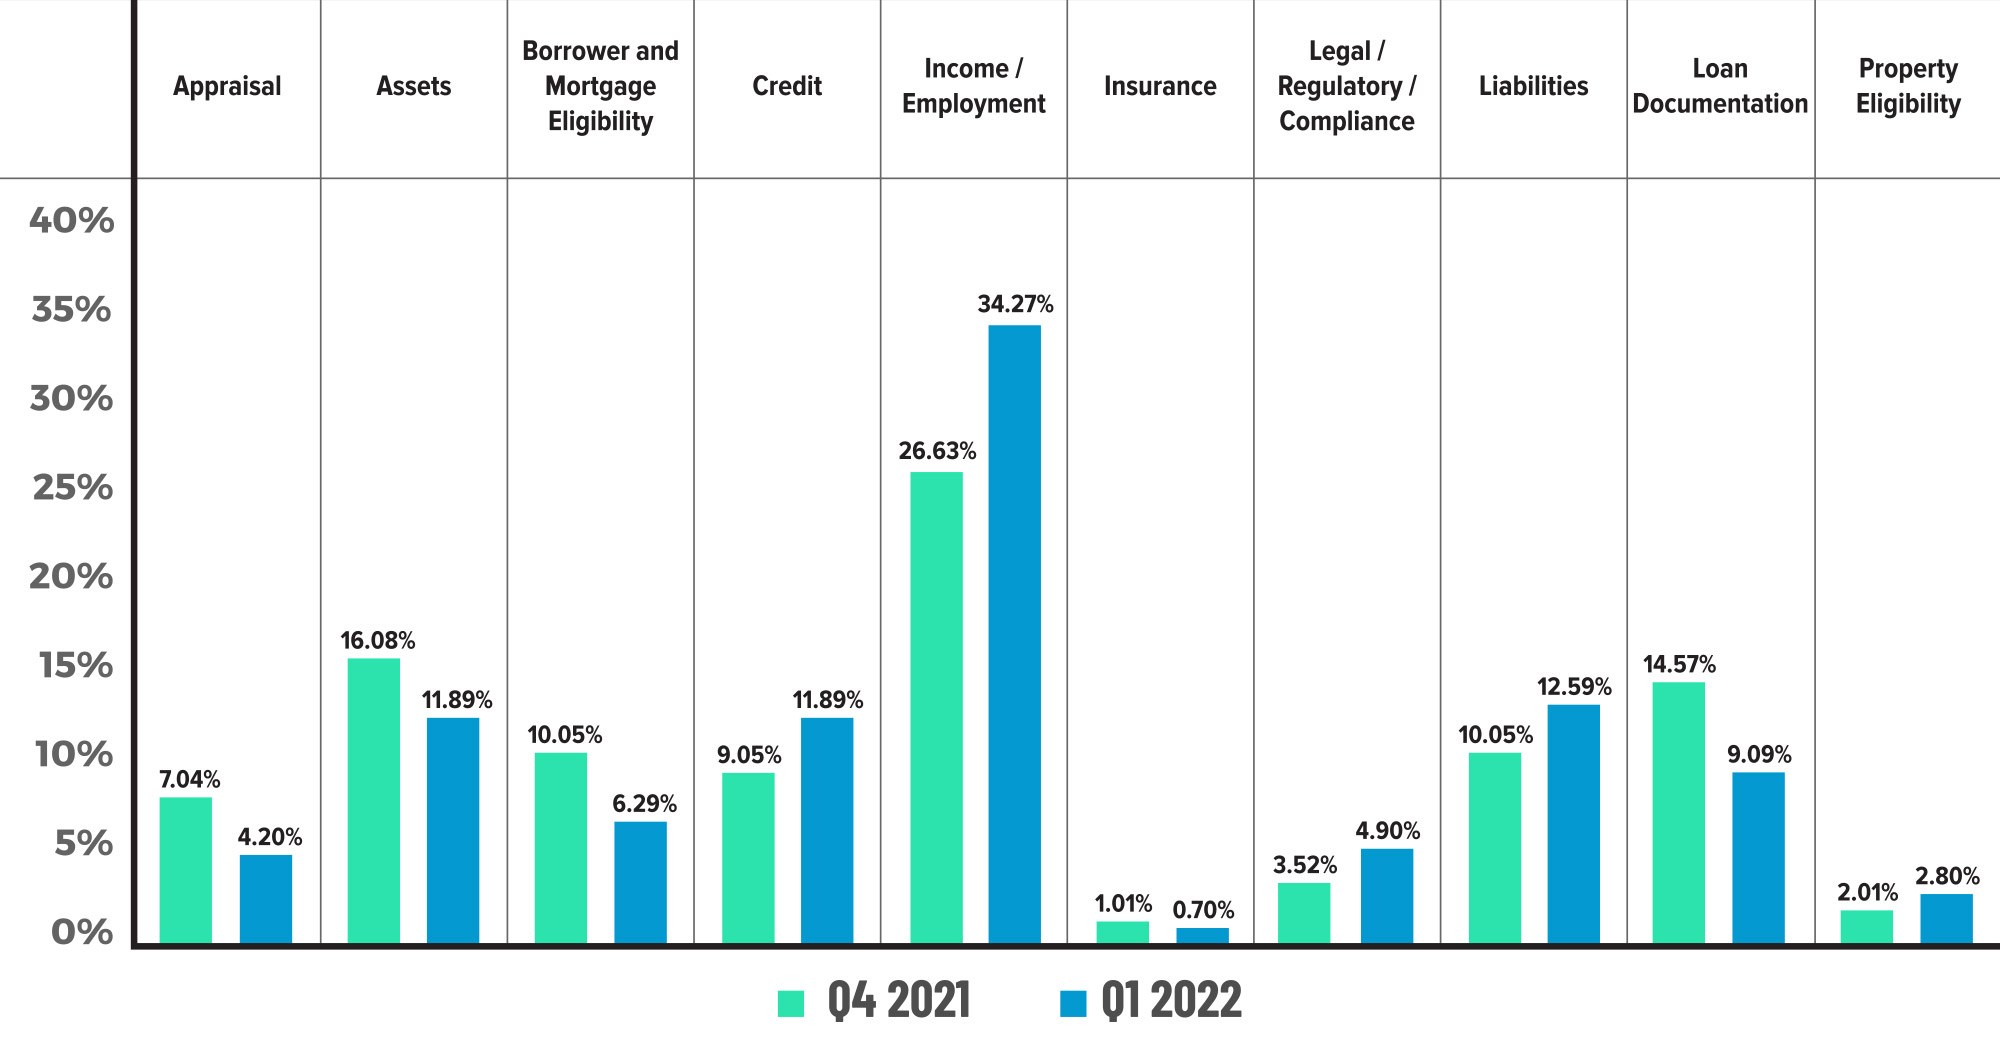
Figure 3 displays the critical defect rate by Fannie Mae category, comparing Q4 2021 to Q1 2022.
Critical Defects by Fannie Mae Sub-Category: Q1 2022
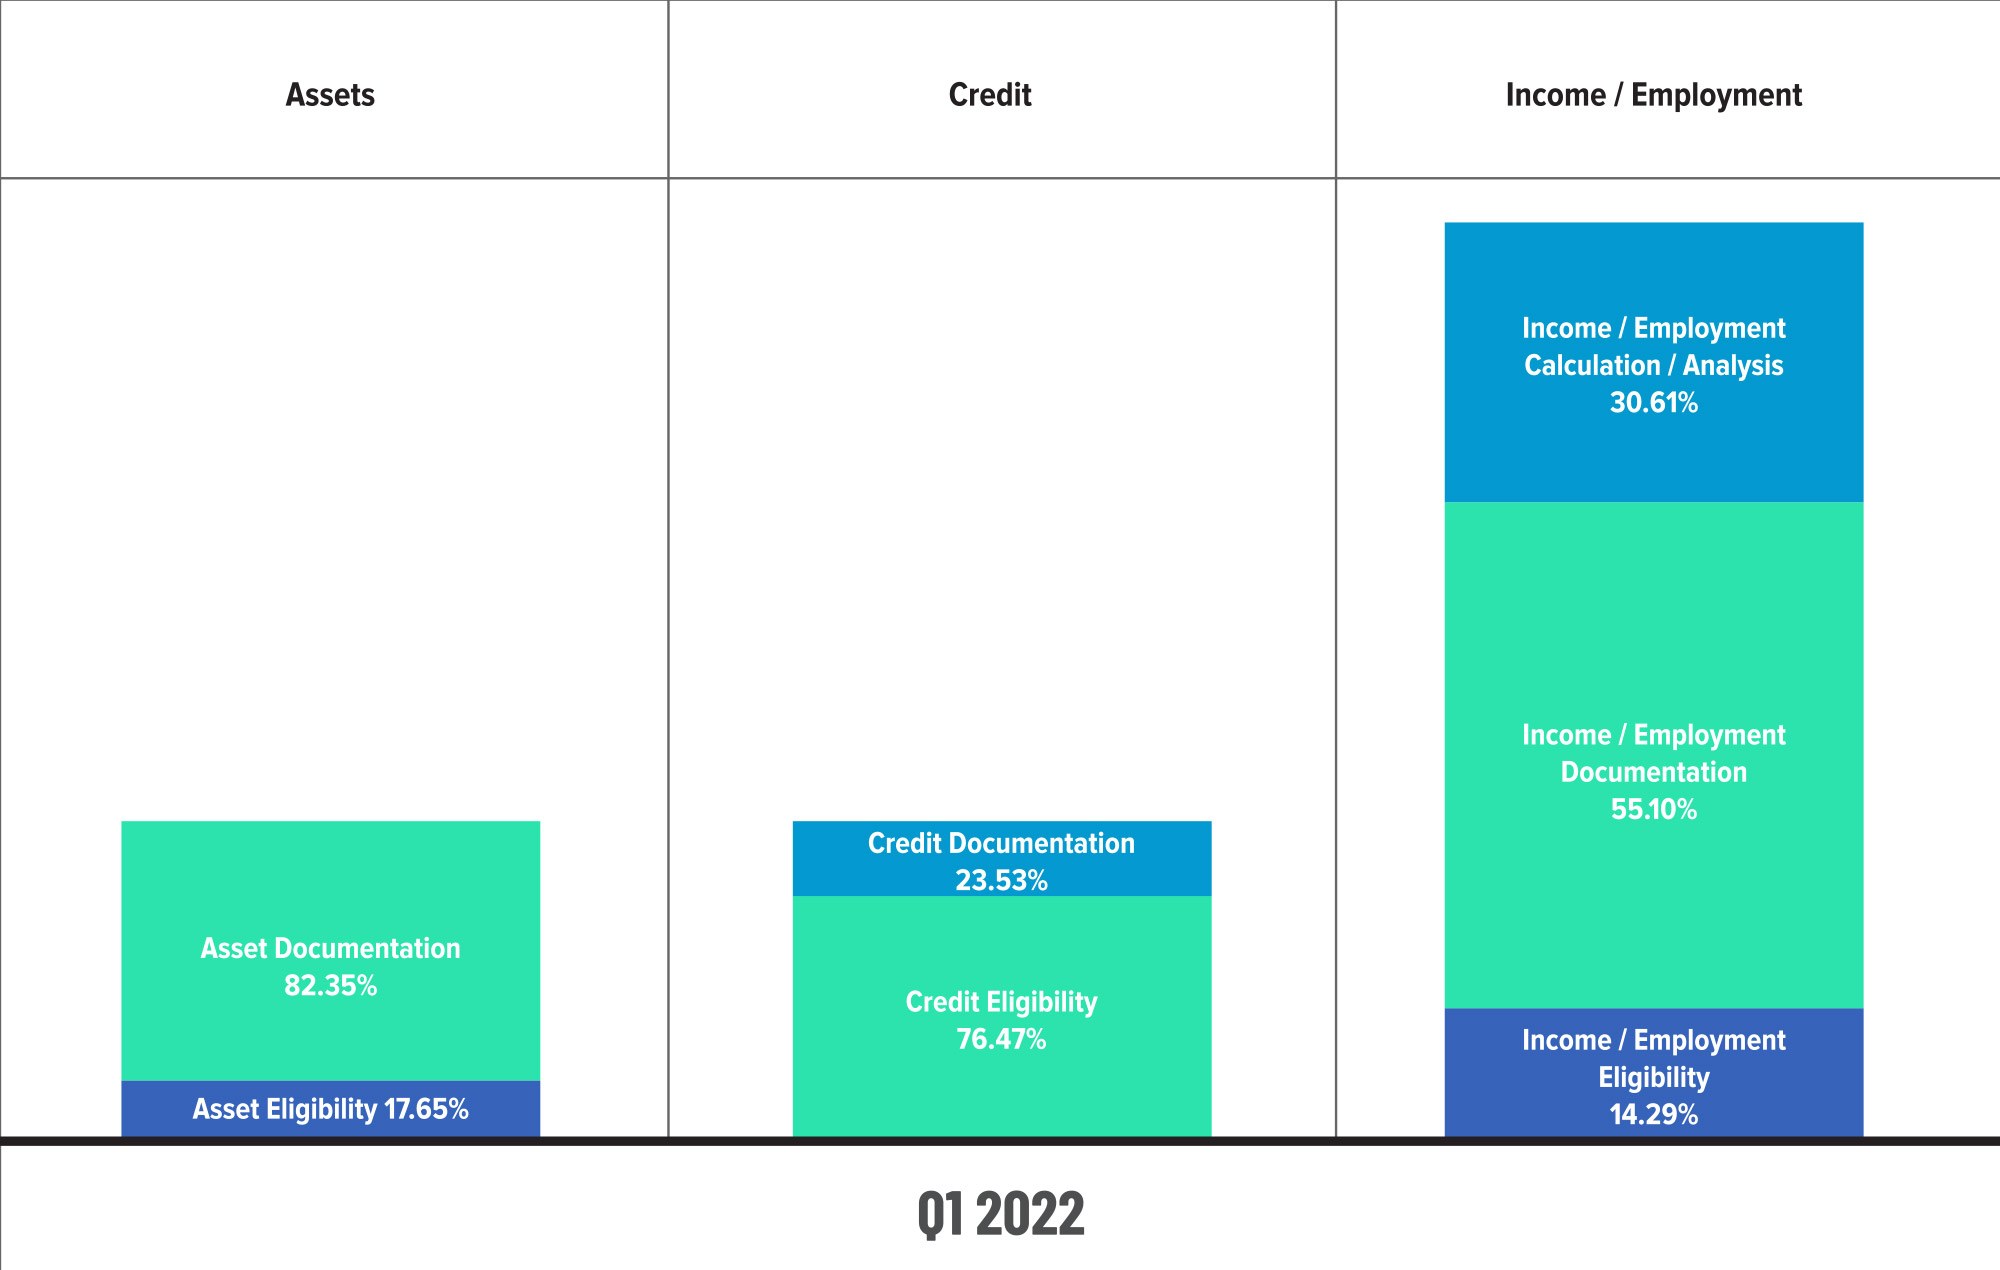
Figure 4 displays sub-category information for Q1 2022 within the Assets, Credit, and Income/Employment categories.
QC Industry Trends by Loan Purpose
Review share is virtually unchanged in Q1 2022, with purchases making up 60.22% of all reviews and refinances accounting for the remaining 39.87%. The current purchase share is up from the CY 2021 average of 53.38%, further solidifying the transition into a purchase-driven market. As overall volumes decline, we expect purchases to maintain and possibly increase their share in the coming quarters.
In contrast to the review share, the performance metrics did shift in Q1 2022. Refinances finished the quarter with a defect share of 39.82% versus 43.22% in the prior quarter. Conversely, purchases made up 60.18% of defects this quarter, up ~4% from the preceding quarter’s 56.78%. As FHA purchase lending increases, this is a metric to keep an eye on in future quarters given the prevalence of higher defect rates within this particular loan type, which we’ll cover more in depth in the next section.
Critical Defects by Loan Purpose: Q1 2022

Figure 5 displays the loans reviewed and critical defects by loan purpose for Q1 2022.
QC Industry Trends by Loan Product Type
While still dominating the review share metric, conventional loan share fell again this quarter to 63.53% from last quarter’s 66.31%. The share of conventional loans has now declined every quarter since peaking at 74.05% in Q4 2020. Of note, the review share for conventional loans prior to the pandemic averaged between 65%-70%. The numbers for this quarter mean we have fallen below that historical norm.
As conventional lending declined, FHA and VA review share picked up in Q1 2022. FHA loans comprised 23.29% of all loans reviewed, up from the prior quarter’s 22.11%. That is also now a multi-quarter trend, with FHA surging back after a multi-year decline during the refinance boom. VA loans had a significant increase in share this quarter, rising to 10.36% of all loans versus 8.82% in Q4 2021. The rise in VA share is now a multi-quarter trend and up from the pandemic low of 6.01% in Q1 2021.
Defects on conventional loans were flat quarter-over-quarter, ending Q1 2022 at 44.74% as compared to 45.39% in the prior quarter. FHA defects rose to 42.11% this quarter, up 6.5% from Q4 2021’s defect share of 35.46%. On a percentage basis, the increase in defects is 19% and mostly reflective of the defect risk inherent to originating FHA purchase loans. In the other products, the share of defects declined. VA loans made up 7.89% of the defects in Q1 2022, which was down from 8.51% in the prior quarter, and USDA loans made up 5.26%, a welcome improvement from Q4 2021’s level of 10.64%.
Critical Defects by Loan Product Type: Q1 2022

Figure 6 displays the loans reviewed and critical defects by loan type for Q1 2022.
Economic Discussion
Origination Volumes
The primary story of Q1 2022 was the rapid decline in mortgage volumes brought on by a similarly rapid increase in interest rates. Most in the industry anticipated the good times would eventually come to an end, and Q1 was that end. According to ATTOM’s U.S. Residential Property Mortgage Origination Report2 for Q1 2022, originations were down 18% from Q4 2021 and 32% from Q1 2021. Those numbers represent the largest drop in eight years, and the carnage was not limited just to refinance transactions, as purchase lending also fell. High interest rates, rising inflation and a still red-hot property market collectively stunted homebuying and mortgage origination. On the bright side, each loan originated is a potential refinance candidate once the interest rate tide changes, so the question at this point in terms of volume is how long until that tide changes. Regarding critical defect rates, lenders need volume to thrive but must also maintain adequate risk protocols to ensure that eligible loans are originated and repurchase risk going forward is manageable. Sacrificing quality for short-term volume gains will only lead to disaster down the road.
ARM Loans Poised for a Comeback
Adjustable rate mortgages are attractive options for borrowers in the current environment because they offer lower payments for the fixed period, usually the first five years. That hasn’t always been true, and in fact, during the latest refinance boom, there was a period in January and February of 2021 when a 5/1 ARM had a higher initial interest rate than a 30-year fixed rate mortgage. The spread between the 30-year fixed and the 5/1 ARM was -.1% during this period. Those spreads are starting to change. For all of 2021, the average spread between the 30-year fixed and the 5/1 ARM was .35% — meaning the initial interest rate for an ARM was .35% lower than the interest rate on a 30-year fixed. Thus far, in 2022, the average spread is 1.06%. Borrowers who opt for a 5/1 ARM today can save ~1% on the interest rate for the initial 5-year fixed period. You can see where the incentive is for borrowers, particularly for those trying to increase their home purchasing power. Expect the number of ARMs originated in 2022 to show a marked increase over 2020 and 2021. Quality control groups should look at discretionary and targeted sampling of these loans to mitigate any risks.
Lender Profitability
Industry headlines show that the “price wars” phase of the mortgage lending cycle has begun. This has implications for all lenders, and you can already see that large banks have lowered expectations for their mortgage operations. Non-banks appear to be the most aggressive at this stage. The headlines also show that many lenders are exiting specific channels that have been a drag on profitability, most notably the wholesale channel. Higher interest rates make different investment classes more attractive to investors, and as a result, mortgage investments (MBS and similar vehicles) have lost their luster. This has the effect of dragging down gain-on-sale margins that lenders profit from when selling loans on the secondary market. It’s been a rapidly changing metric, with gain-on-sale margins hitting more than 3.5% in 2020, then dropping to 2.3% for 2021 and now hovering near 1.5% on average. Because of rising interest rates, the average gain-on-sale will likely decline in future quarters. Lender pricing wars also have an effect on profitability, especially when combined with declines in gain-on-sale. At some point, that process will normalize. The question is when and how much carnage will there be in the meantime? Pay attention to quarterly filings for the dozen or so publicly traded lenders to follow this area of our industry.
Conclusion
We are conditioned not to look the proverbial gift horse in the mouth, so we appreciate that the overall critical defect rate is lower this quarter. There are so many headwinds at this point that it is hard to predict whether we are in the early part of a sustained downward trend. If you are looking for light at the end of the tunnel, keep an eye on inflation and the war in Ukraine. While the rate of growth of inflation has slowed, we need inflation to decline, not just go up slower. A large driver of the inflation problem is energy-related, and that is directly impacted by the war in Ukraine, so any positive development on either front could bring us closer to the end of this current cycle. In the meantime, we encourage lenders to responsibly chase the volume out there – always with an eye towards originating defect-free, high-quality loans.
About the ACES Mortgage QC Industry Trends Report
The ACES Mortgage QC Industry Trends Report represents a nationwide post-closing quality control analysis using data and findings derived from mortgage lenders utilizing the ACES Analytics benchmarking software.
This report provides an in-depth analysis of residential mortgage critical defects as reported during post-closing quality control audits. Data presented comprises net critical defects and is categorized in accordance with the Fannie Mae loan defect taxonomy.
About ACES
ACES Quality Management is the leading provider of enterprise quality management and control software for the financial services industry. The nation’s most prominent lenders, servicers and financial institutions rely on ACES Quality Management & Control® Software to improve audit throughput and quality while controlling costs, including:
- 4 of the top 5 and more than 60% of the top 50 independent mortgage lenders;
- 8 of the top 10 loan servicers;
- 11 of the top 30 retail banks; and
- 1 of the top 3 credit unions in the United States.
Unlike other quality control platforms, only ACES delivers Flexible Audit Technology, which gives independent mortgage lenders and financial institutions the ability to easily manage and customize ACES to meet their business needs without having to rely on IT or other outside resources. Using a customer-centric approach, ACES clients get responsive support and access to our experts to maximize their investment.
For more information, visit www.acesquality.com or call 1-800-858-1598.
Media Contact: Lindsey Neal | DepthPR for ACES | (404) 549-9282 | lindsey@depthpr.com
View all reports