ACES’ Mortgage QC Industry Trends Report represents an analysis of nationwide quality control findings based on data derived from the ACES Quality Management & Control Software.
Executive Summary
QC Industry Trends – Overview
QC Industry Trends – by Category
QC Industry Trends – by Loan Purpose
QC Industry Trends – by Loan Product Type
Economic Discussion
Conclusion
About this Report
Executive Summary
This report represents an analysis of post-closing quality control (QC) data derived from loan files analyzed by the ACES Quality Management and Control® benchmarking system during the first quarter of 2023 (Q1 2023). The report incorporates data from prior quarters, where applicable.
Findings for the Q1 2023 Trends Report were based on quality control data from tens of thousands of unique records. Volumes are essential to this analysis, and the included records reflect trends in overall origination volumes. However, data from additional lenders is added to this analysis once the lender's QC review seasoning within the ACES software reaches the 12-month bar. Therefore, the overall volume in the QC Trends Report does not precisely mirror the overall market. All reviews and defect data evaluated for this report were based on post-close loan audits selected by lenders for full file reviews.
Defects are categorized using the Fannie Mae loan defect taxonomy. Data analysis for any given quarter does not begin until 90 days after the end of the quarter to allow lenders to complete the post-closing quality control cycle, resulting in a delay between the end of the quarter and our publication of the data.
NOTE: A critical defect is defined as a defect that would result in the loan being uninsurable or ineligible for sale. The critical defect rate reflects the percentage of loans reviewed for which at least one critical defect was identified during the post-closing quality control review. All reported defects are net defects.
Summary of Findings
The overall critical defect rate for Q1 2023 continued the downward trend observed in Q4 2022, declining to 1.78%. Similar to last quarter, defects increased in two of the four major underwriting categories, and more than half of all defect categories experienced increases in Q1. While defect share declined quarter-over-quarter for FHA and USDA loans, VA loans experienced a significant increase in defects. Conventional loans saw only a slight increase.
Highlights include the following findings:
- The overall critical defect rate declined 3.26%, ending at 1.78% and marking the second straight quarter of decline.
- In the major underwriting categories, Assets and Income/Employment improved, while Credit and Liabilities deteriorated.
- Despite its improvement this quarter, Income/Employment remained the leading defect category, followed by Assets and Legal/Regulatory/Compliance.
- The sub-category analysis showed increases in eligibility-related defects for both the Assets and Credit categories, whereas this seems to have been the primary driver of improvements in the Income/Employment category. However, analysis- and documentation-related errors both increased this quarter, with documentation remaining the largest sub-category of defects for both the Income/Employment and Asset categories.
- Appraisal defects increased, albeit nominally, for the second straight quarter.
- Purchase and refinance shares held steady in Q1, achieving defect parity for the second consecutive quarter.
- FHA defect share declined after two consecutive quarters of increase. While USDA defects continued to improve, VA defects increased significantly in Q1, and conventional defects grew slightly as well.
QC Industry Trends – Overview
After two quarters of defect rates above the 2% threshold – not to mention Q3 2022's historic high, the decline in the overall critical defect rate for a second consecutive quarter is a welcome sight from both a loan quality and a profitability perspective.
One of the factors influencing this quarter's defect rate is the interest rate environment. The average 30-year fixed rate remained below 7% throughout the quarter, starting at around 6.48% before dropping to 6.09% in early February. From there, rates steadily rose, peaking at 6.73% and then ending the quarter at around 6.32%1. Entering 2023 with a relatively more stable rate environment than 2022 certainly helped keep the defect rate under control, as lenders did not have to combat rate volatility when qualifying borrowers.
However, the other market factor at play in this quarter is the origination environment, which was less rosy entering the year. Total residential lending declined 19% from Q4 2022 to Q1 2023 and 56% from a year-over-year perspective, representing the lowest number of units originated since 2000. Volume-wise, originations declined 20% quarterly and 45% annually2. Fewer loans coming in the door results in less strain on lenders' underwriting and processing teams, thus enabling those groups to conduct even more thorough file analyses to ensure loan quality, despite increased pressure from sales teams to qualify as many borrowers as possible.
1 https://fred.stlouisfed.org/series/MORTGAGE30US
2 https://www.attomdata.com/news/market-trends/mortgage-origination/attom-q1-2023-u-s-residential-property-mortgage-origination-report/
Critical Defect Rate by Quarter: Q2 2022 — Q1 2023
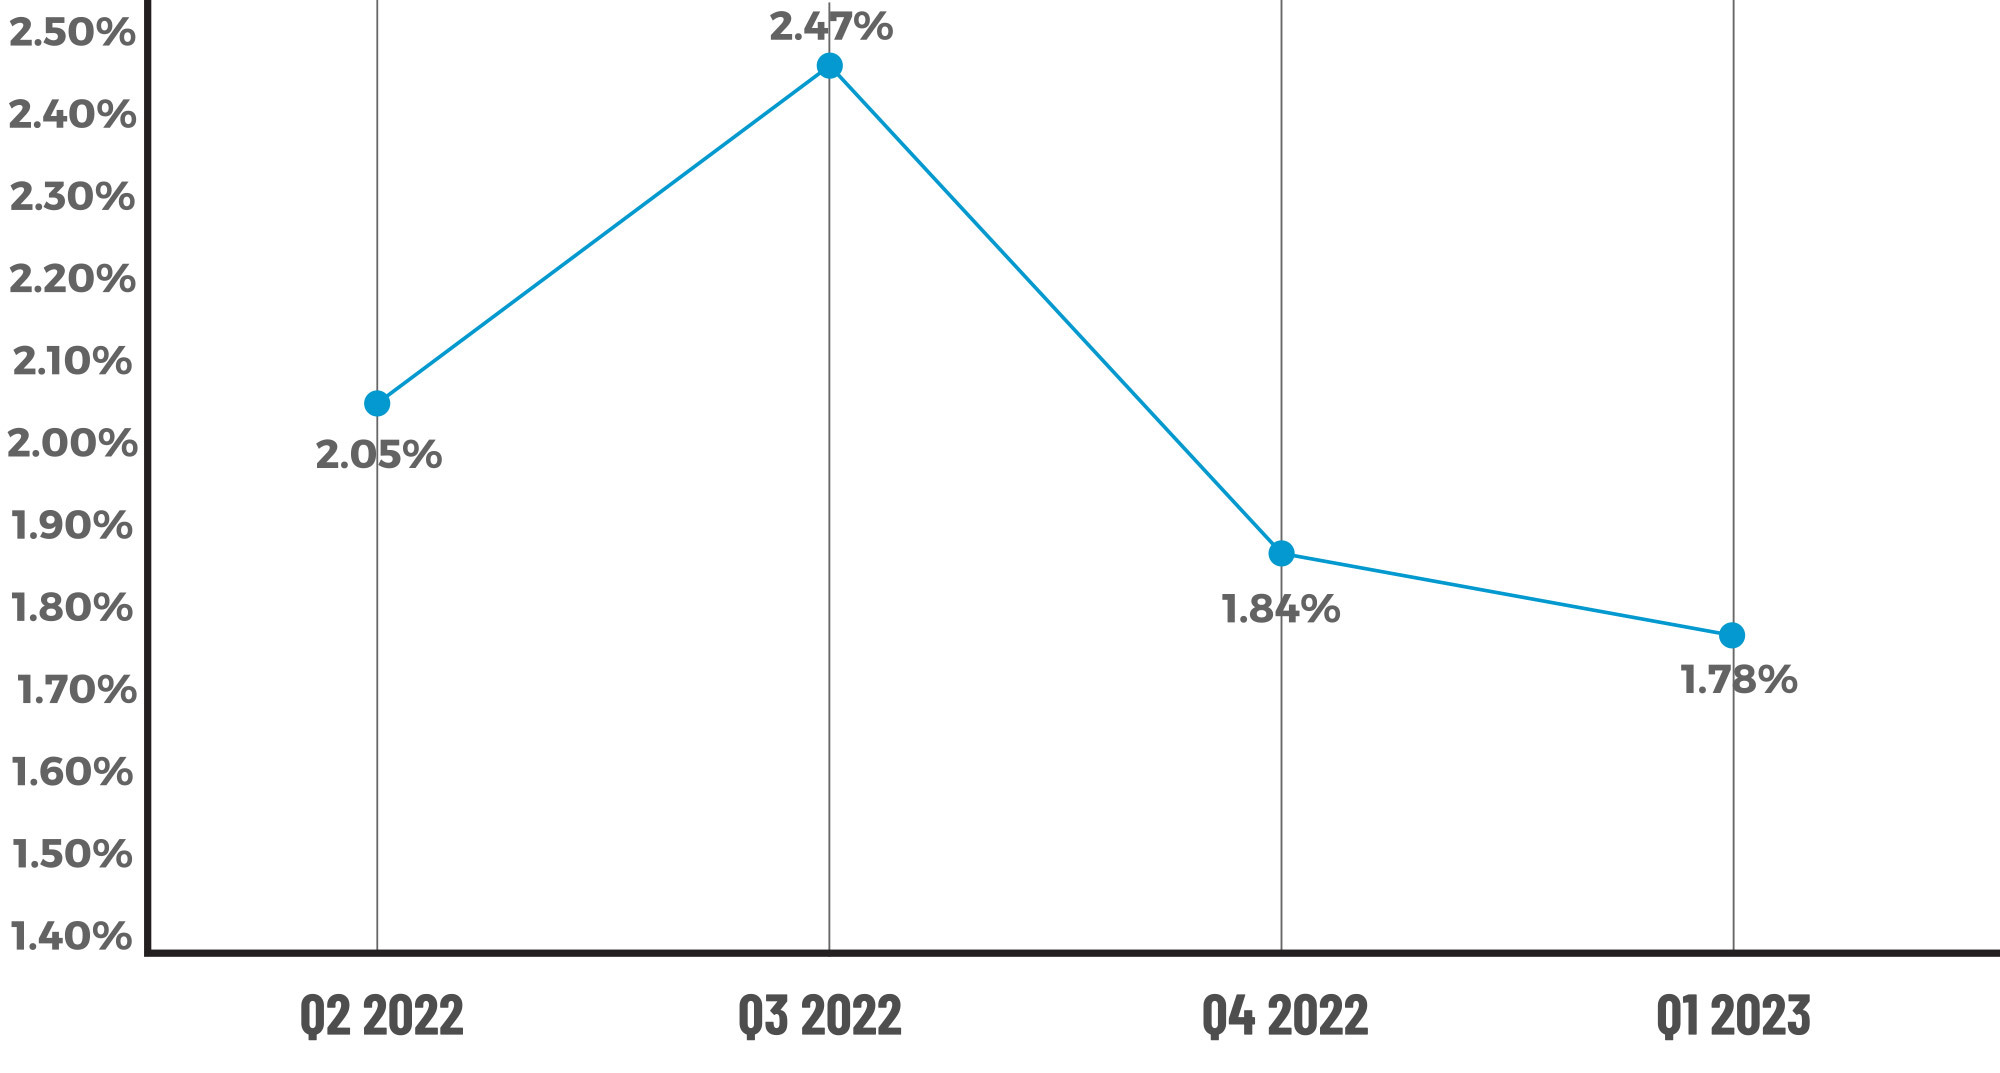
Figure 1 displays the percentage of loans with critical defects by quarter, for Q2 2022 through Q1 2023
QC Industry Trends by Defect Category
In what should come as no surprise, the Income/Employment category is the leading area of defects for the thirteenth straight quarter, representing 31.5% of all defects observed in Q1 2023. Despite leading all defect categories, this area did experience a 14.66% decline in defects over the previous quarter, a positive sign considering the spike in defects in Q4 2022 after two consecutive quarters of decline.
In addition to Income/Employment, the Assets category represents the other area of defect improvement out of the "big four" underwriting categories, declining 8.72% from 18.12% in Q4 to 16.54% in Q1. The downward trend in these two categories is heartening given their importance to the overall mortgage approval process. However, the fact that these categories are also the top two leading categories of defects this quarter is cause for concern for much the same reason.
Adding to that concern are the increases in the other two major underwriting categories. Credit defects increased 36.72% from 4.03% in Q4 to 5.51% in Q1. Similarly, Liabilities increased to 7.87% of all defects this quarter, representing a 17.29% increase over Q4's 6.71% share. While these increases are noteworthy, these categories of defects rank among the lowest this quarter.
The sub-category analysis for Assets, Credit and Income/Employment points to varying defect drivers in each of these areas. While Asset defects improved overall, there was a shift in the defect types within this category. In Q4, the sole driver of Asset-related defects was documentation. That sub-category did improve 14.29% in Q1, but eligibility-related defects went from non-existent in Q4 to 14.29% in Q1. The Credit category tells a similar story regarding defect performance, with documentation-related errors declining 14.28% and eligibility-related issues increasing 7.14% quarter-over-quarter. Yet, eligibility remains the primary driver of Credit-related defects, whereas documentation comprises the majority of defects in the Asset category.
With regard to Income/Employment-related defects, eligibility drove the overall improvement in the category, as defects declined 57.03% from Q4. This seemed to balance out the 37.52% increase in analysis-related defects and 15.51% growth in documentation errors, both of which comprised the majority of defects within this category.
Fannie Mae has identified income calculation/analysis in particular as a major problem area, and the increase in defects this quarter is likely a result of lenders scrutinizing their calcula- tions more assiduously because of Fannie's increased oversight to find it before Fannie does. As lenders stretch for volume, they are trying to qualify every loan and running into much more complicated income situations. So, it is unsurprising that, between the increased focus and current market conditions, lenders are identifying some real errors in this area.
Overall, the takeaway for lenders regarding defects in the underwriting categories is not just to be aware of the specific areas in which defects occur in these critical categories but also to examine the growth and/or decline of defects in these areas within the larger context. Although Asset and Income/Employment defect performance improved quarter-over- quarter, their position as the top two categories of defects overall bears additional scrutiny. Conversely, the growth in the Credit and Liabilities categories is perhaps less concerning than the numbers would indicate when taken in isolation, though still worthy of a closer look from a trending perspective.
In addition to Income/Employment and Assets, Legal/Regulatory/Compliance was the third largest category of defects in Q1, which more than doubled from the prior quarter. Based on compliance dates and deadlines tracked by the ACES Compliance NewsHub, nearly three dozen regulatory changes issued by the GSEs and state/federal agencies went into effect during Q1 2023, which could explain the 134.64% increase in defects in this category. In addition, compliance is one of the most costly areas to staff within a mortgage company, and the industry could be experiencing the effects of cuts that went too deep in this area.
One area we typically do not highlight and is often lacking in reported defects in some quarters is the insurance category. However, this category is worth noting this quarter due to the uptick in defects and issues related to coverage. Given major insurance carriers' decision to pull back or stop issuing policies for properties in high-risk weather areas (mainly the Southeast and California), the increase here is unsurprising and perhaps indicative of future challenges in this category. At the very least, lenders should pay close attention to Insurance-related defects in the coming quarters.
Loan Documentation also increased slightly in Q1 after significant improvement in Q4. Although volatility is quite common in this category, an 8.94% increase from 9.4% in Q4 to 10.24% in Q1 should not necessarily give the industry pause. What may be cause for more concern, despite nominal quarter-over-quarter growth, is the continued increase in Appraisal defects.
While Appraisal defects only increased 0.43% from Q4 2022 to Q1 2023, it is important to remember that defects increased by more than 70% between Q3 and Q4 last year. Declining volumes in Q1 may account for the marginal increase, but the talk track from the GSEs indicates more severe issues than the data shows.
Industry press and comments by the Agencies indicate that significant valuation problems are driving a portion of rising repurchase requests to lenders. Historically, our data showed that lenders more often cited Appraisal exceptions less frequently and those issues that were cited were considered “workmanship” issues related to the production of the appraisal report as opposed to issues directly related to the property’s value. For this quarter, we delved deeper into the sub-category analysis for the Appraisal category and Figure 6 below shows that General Appraisal Requirements comprise two-thirds of all defects in this area. Meanwhile, Appraisal Adjustments – which is how issues related to the property's appraised value would be classified – only account for 16.67% of defects. Based on this analysis, it seems that the data lenders find themselves does not align with anecdotal industry findings. Thus, lenders should start paying attention to the actual home values appraisers submit and the comps used to determine those values versus checking for a valid license or identifying minor paperwork errors.
On a more positive note, Borrower/Mortgage Eligibility improved over Q4, decreasing 38.54% to end Q1 at 8.66%. Given that this represented the third largest category of defects in Q4, improvement in this category is particularly reassuring, as the volume decline noted earlier in this report would indicate lenders are still fighting to qualify and approve every borrower possible.
Critical Defects by Fannie Mae Category: Q1 2023
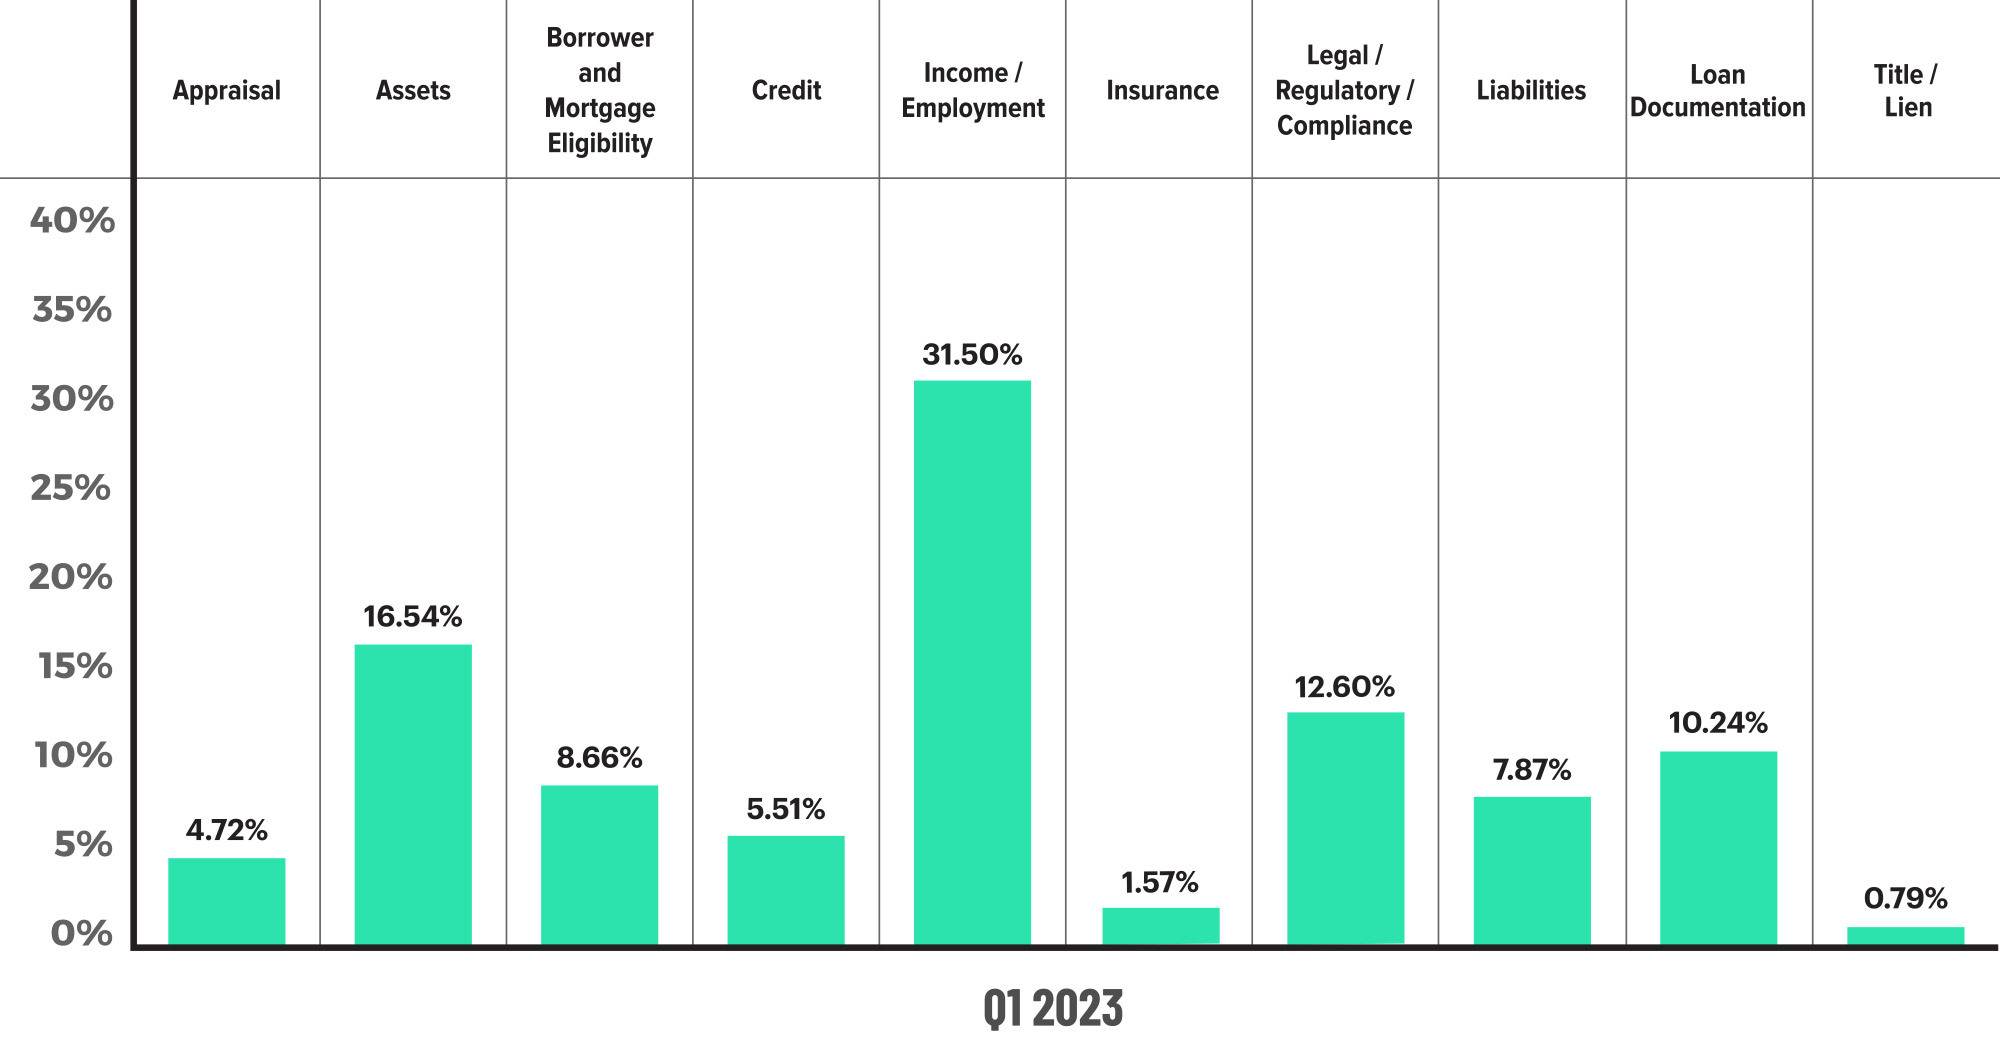
Figure 2 displays the dispersion of critical defects across Fannie Mae categories for Q1 2023.
Critical Defects by Fannie Mae Category: Q4 2022 vs. Q1 2023
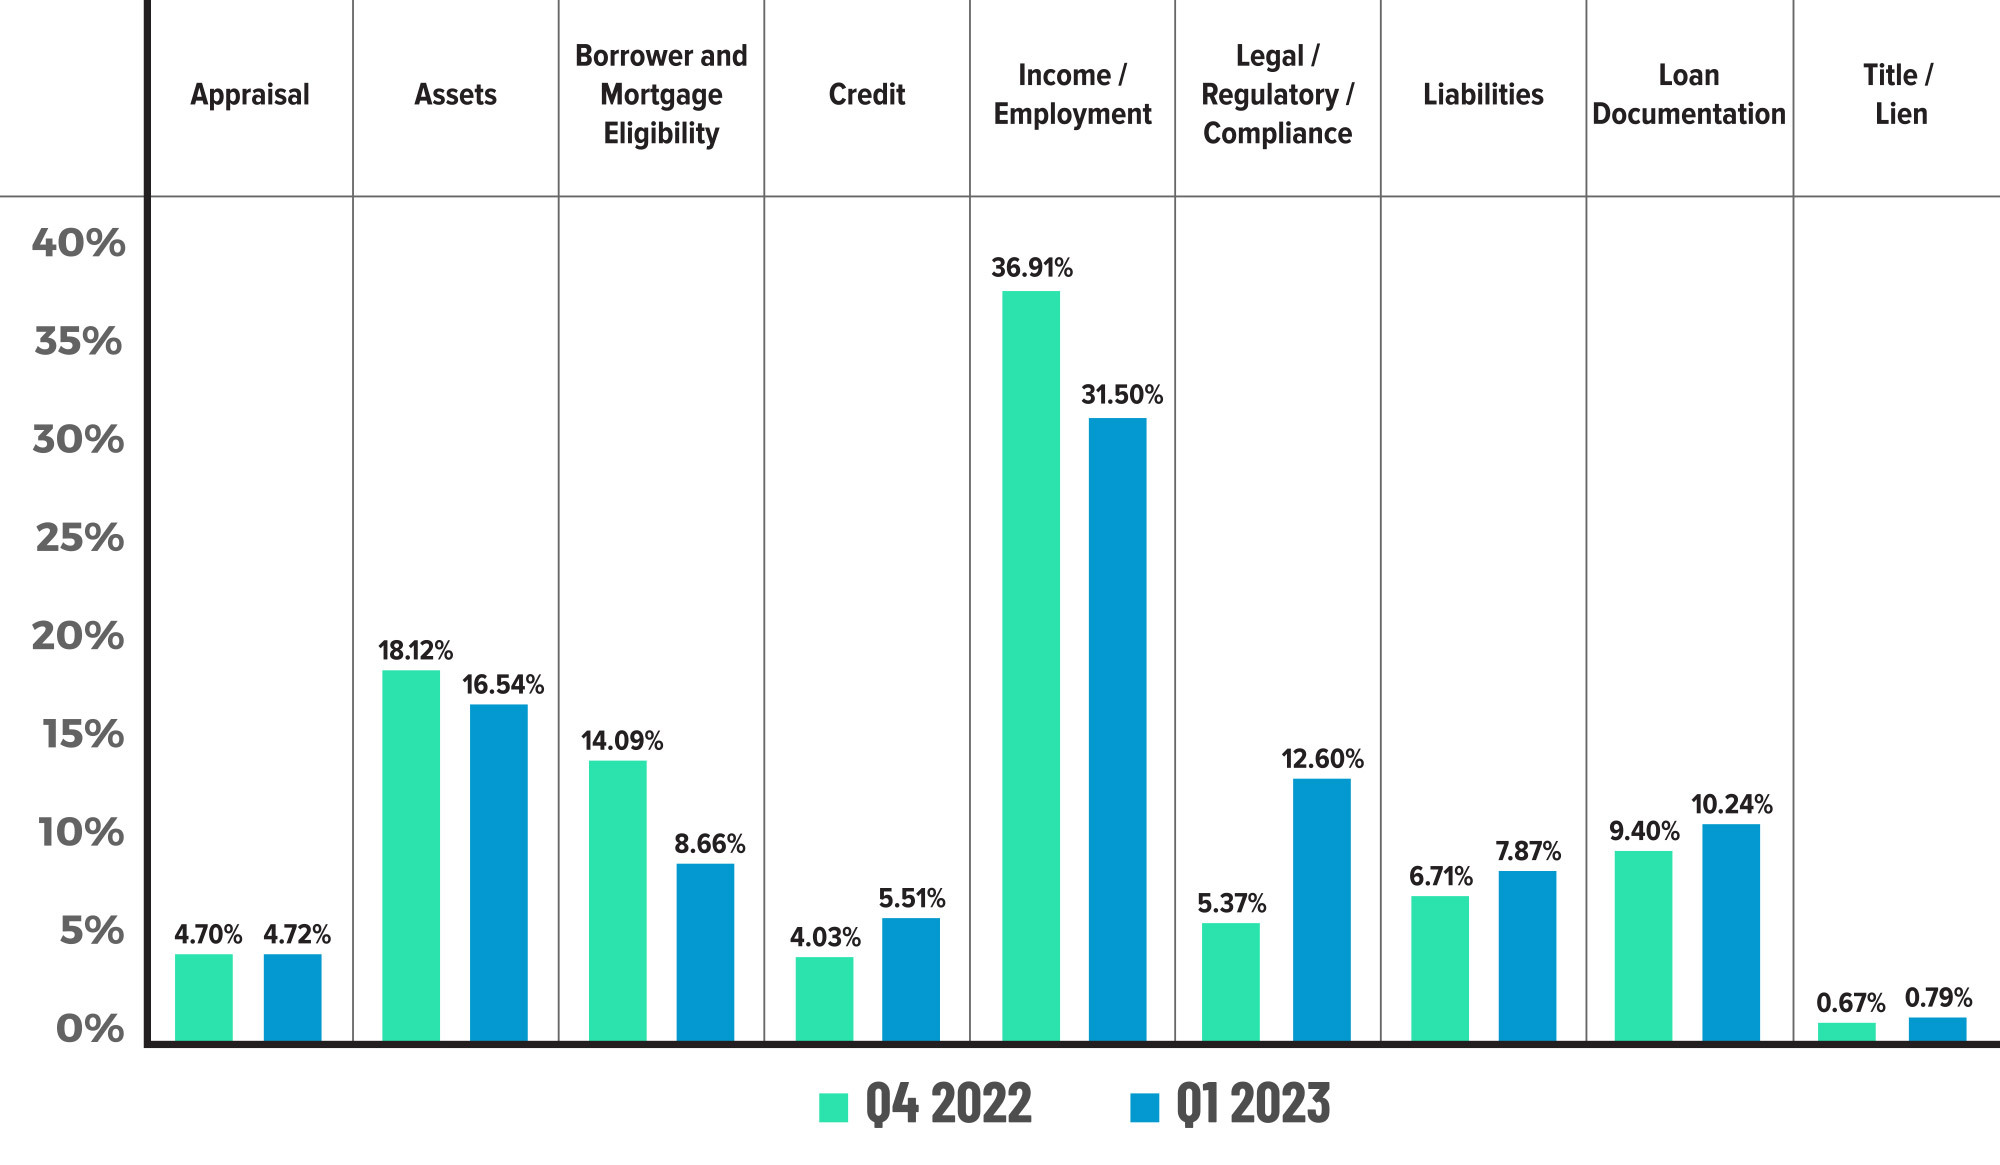
Figure 3 displays the critical defect rate by Fannie Mae category, comparing Q4 2022 to Q1 2023.
Critical Defects by Fannie Mae Sub-Category: Q1 2023
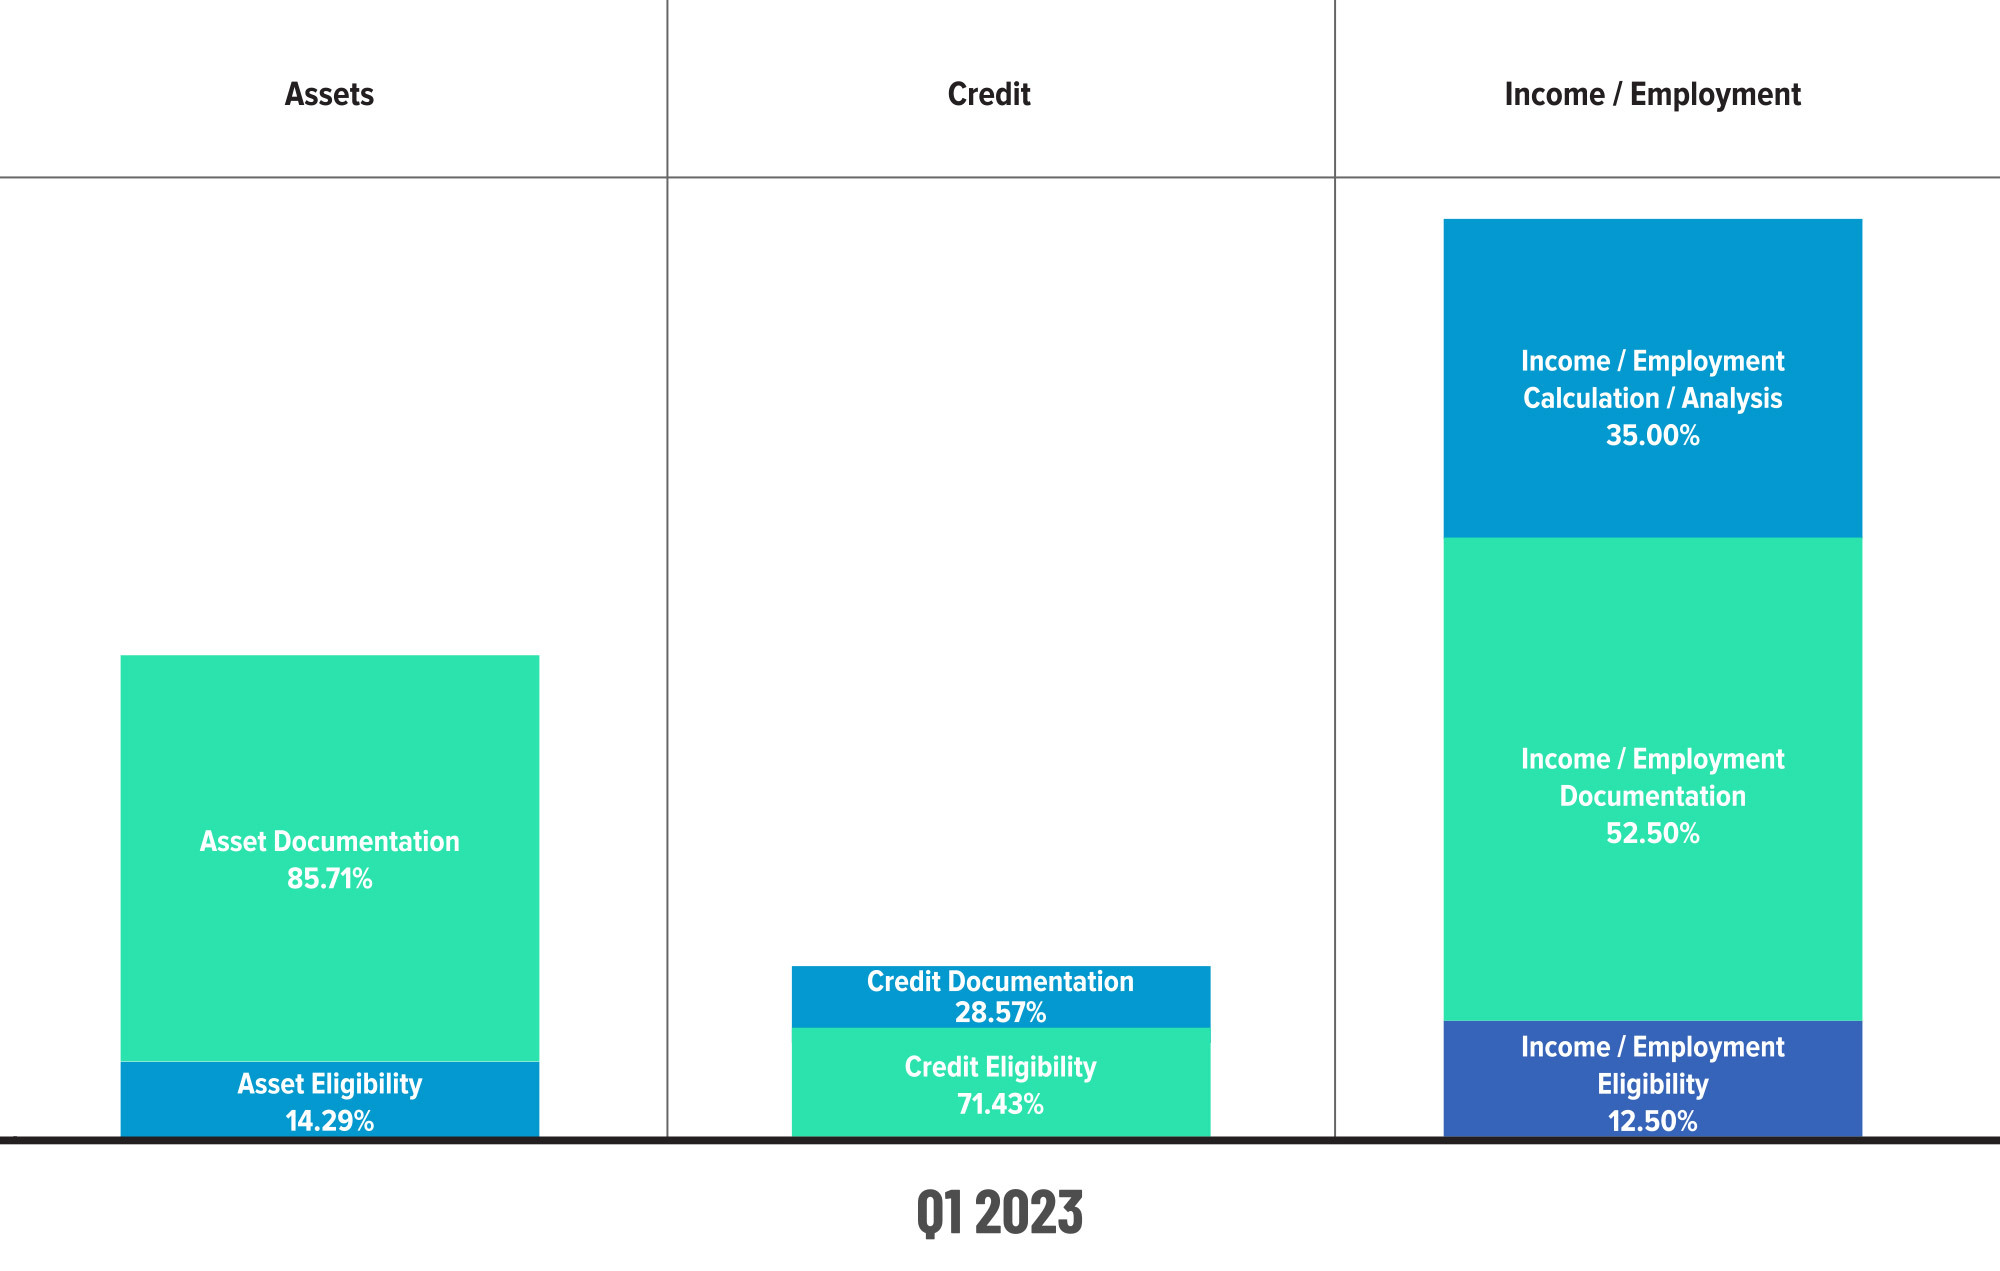
Figure 4 displays sub-category information for Q1 2023 within the Assets, Credit and Income/Employment categories.
Critical Defects by Fannie Mae Sub-Category: Q4 2022 vs. Q1 2023
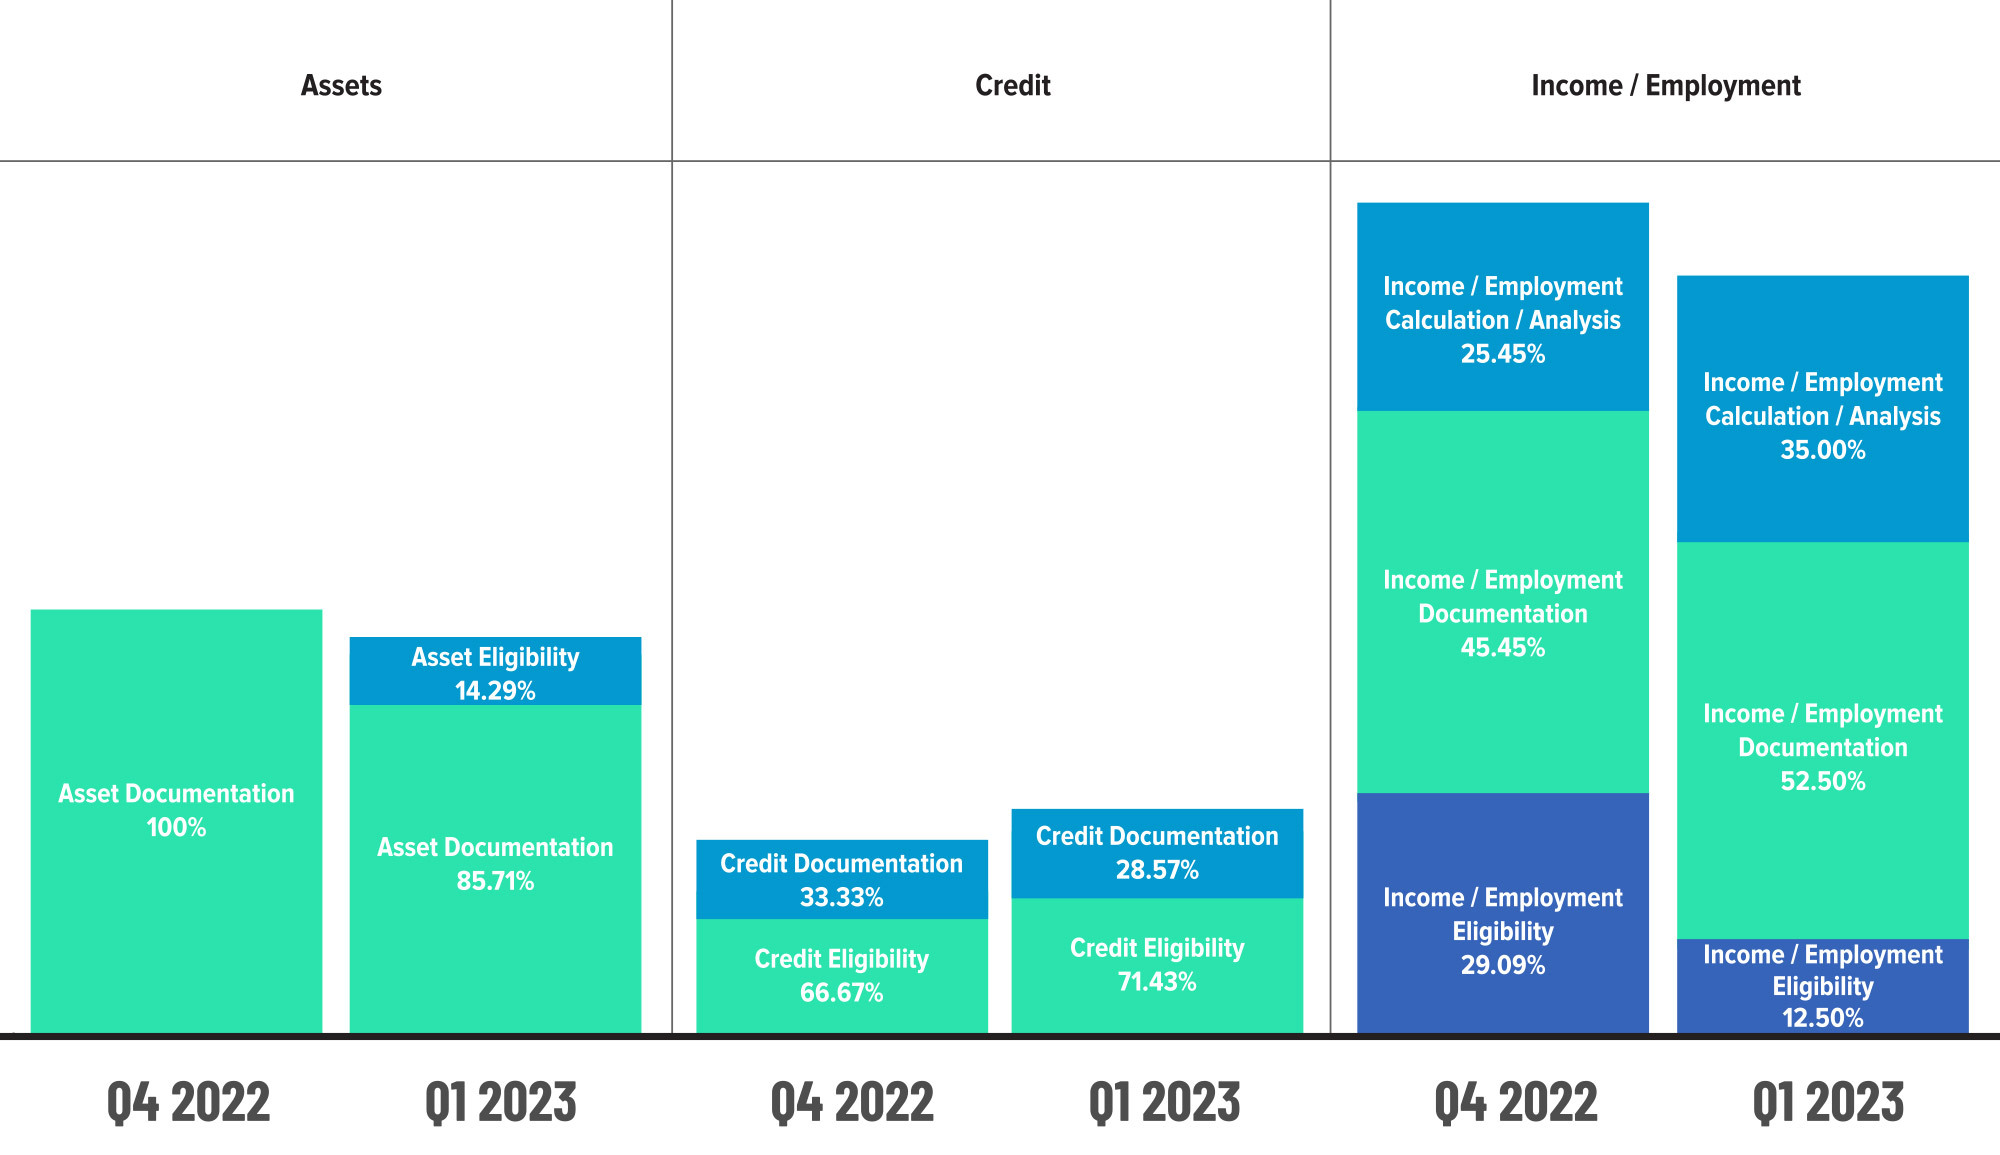
Figure 5 displays sub-category information within the Assets, Credit and Income/Employment categories, comparing Q4 2022 to Q1 2023.
Critical Defects by Fannie Mae Appraisal Sub-Category: Q1 2023
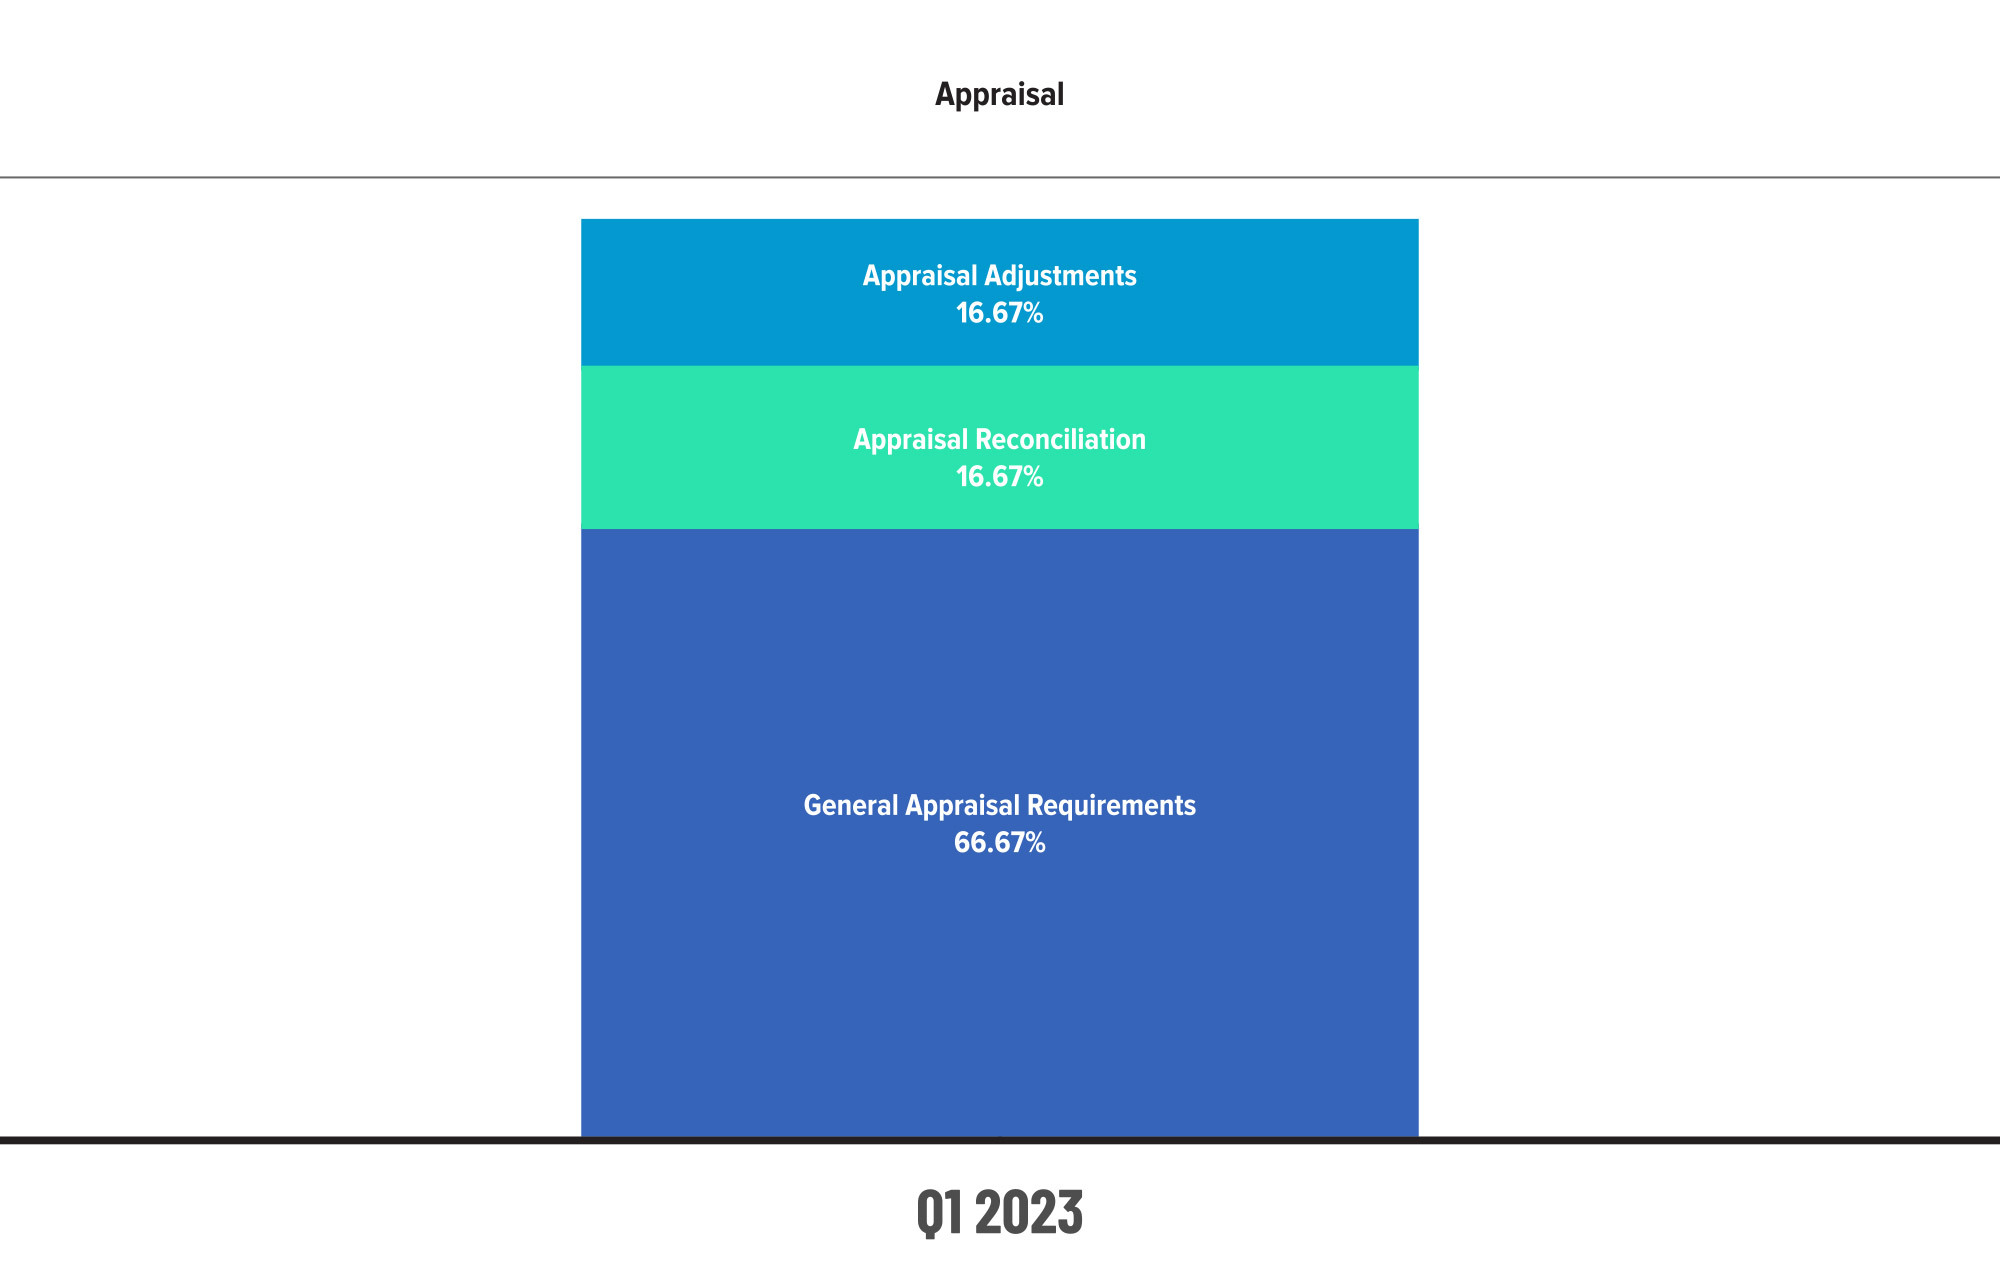
Figure 6 displays sub-category information for Q1 2023 within the Appraisal category.
QC Industry Trends by Loan Purpose
The story regarding Loan Purpose in Q1 2023 is virtually unchanged from Q4 2022, with purchase transactions once again achieving defect parity. Lenders did increase their review of refinance transactions by 2.87% this quarter, which is understandable given that refinances in a rising rate environment are not the norm. As a result of this increased scrutiny, refinance defect share also increased 7.39% this quarter.
Critical Defects by Loan Purpose: Q1 2023
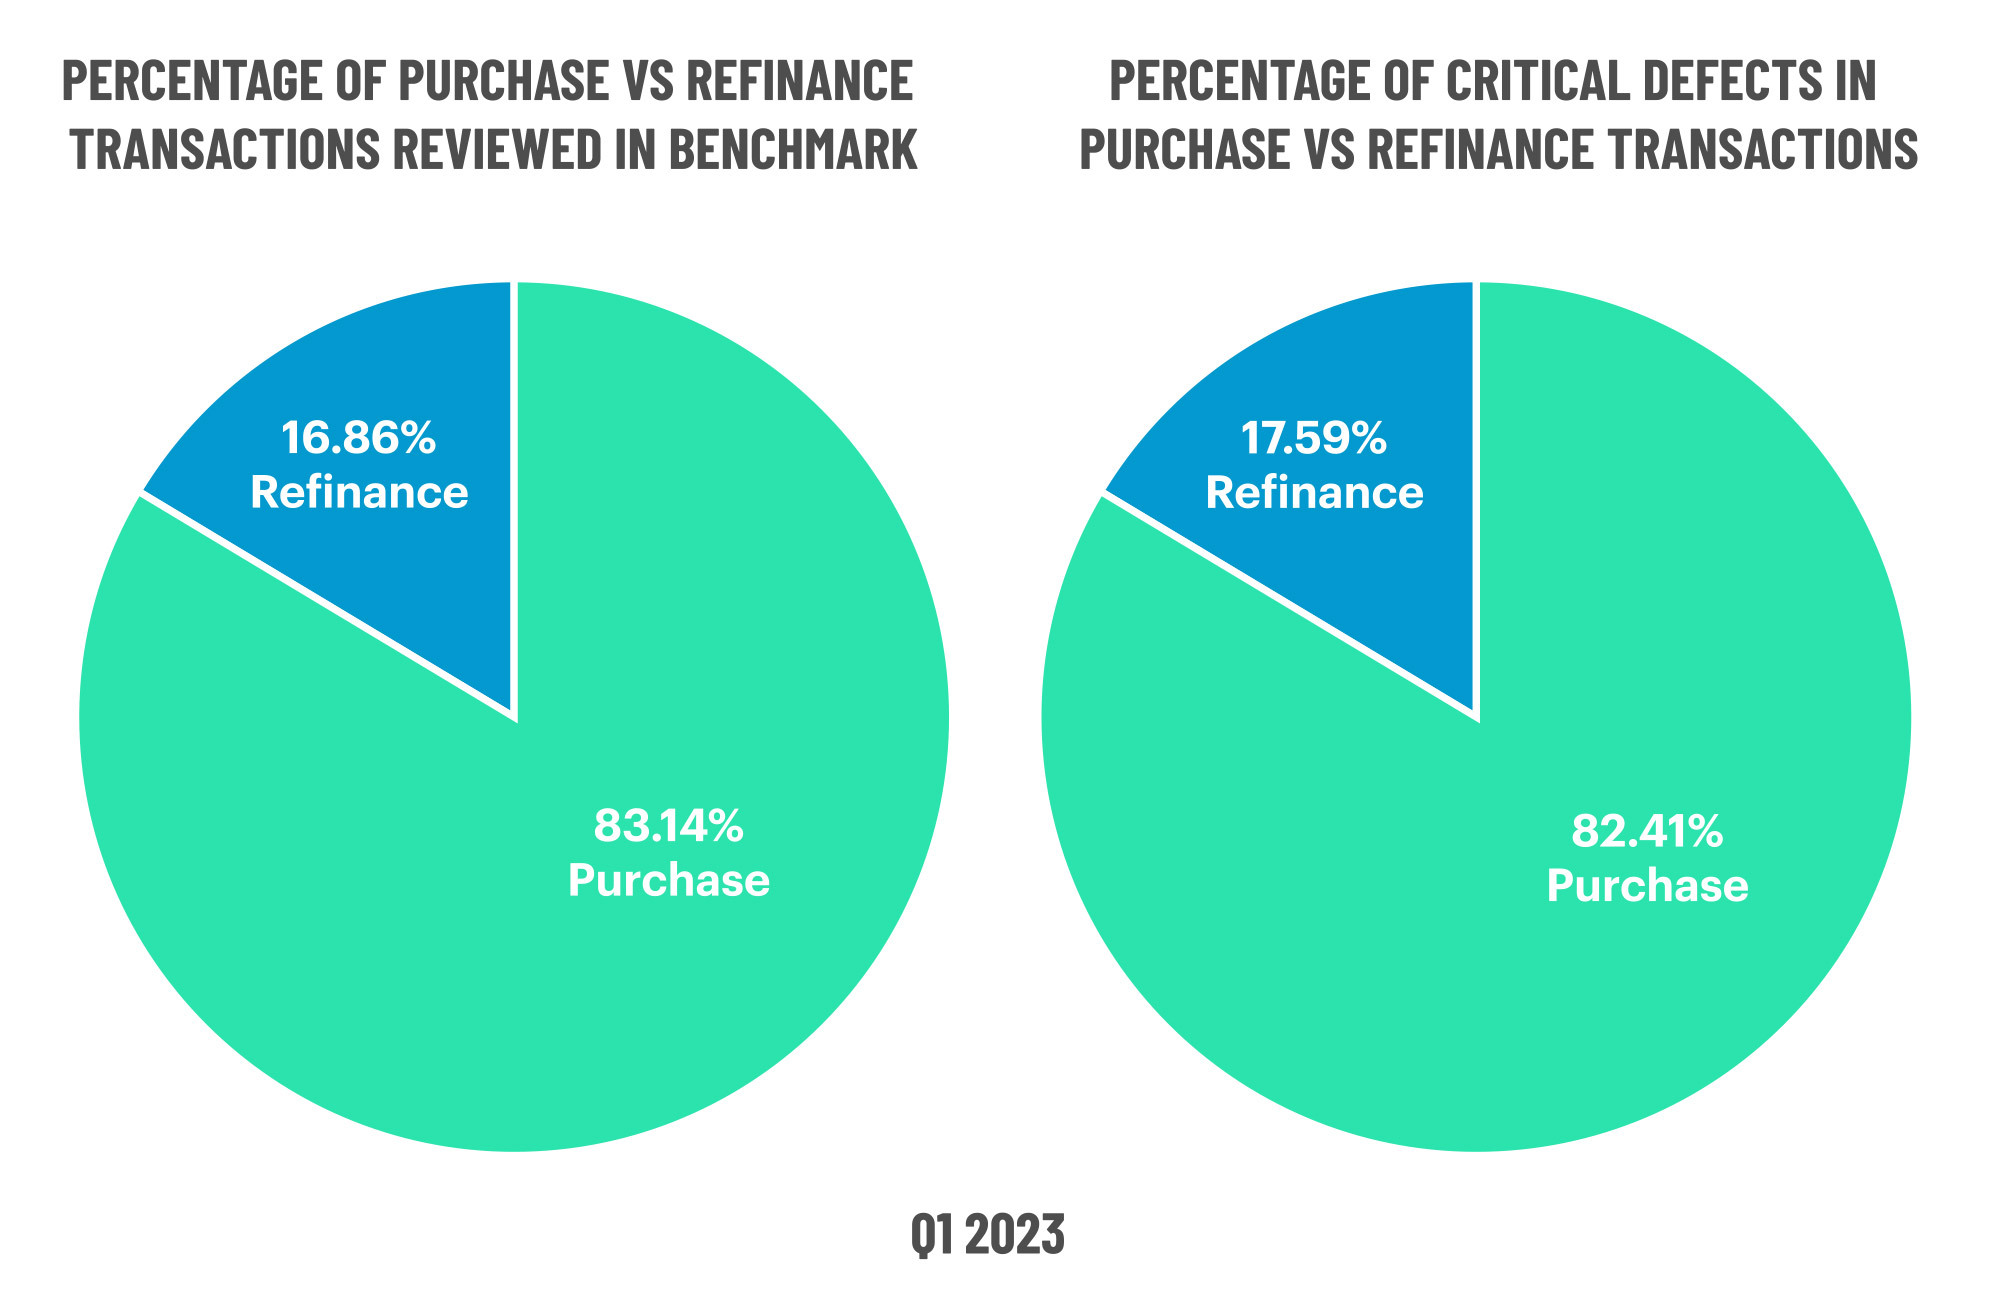
Figure 7 displays the loans reviewed and critical defects by loan purpose for Q1 2023.
QC Industry Trends by Loan Product Type
Review share for conventional and FHA loans decreased slightly in Q1 2023 as lenders focused their efforts on USDA and VA originations. Performance-wise, FHA loans improved this quarter, falling 13.7% over Q4 2022, while conventional loans increased 2.9%. The most significant improvement in loan performance was in the USDA category, which decreased 45.69% despite increased review share. The same cannot be said for VA loan performance, as defects increased 68.71% from the previous quarter.
A couple of themes emerge from this quarter's findings related to loan product type. The first is, "Beware the decline." Although FHA defect share declined, review share also declined, and even then, defects still outstripped review share. Thus, while FHA defects are seemingly trending in the right direction, there is still work to be done to improve loan performance in this category. These efforts will be especially critical now that FHA is back in full force and conducting on-site audits. If they aren't already, lenders should be accounting for FHA loans separately in their QC reviews and paying particular attention to those loans to improve performance and quality.
The other takeaway is, "Diversify with care." As the industry continues to struggle with affordability challenges, VA loans are especially attractive for those who qualify because of the more favorable terms/rates offered, 0% down payment options and no private mortgage insurance requirements. However, much like FHA loans, VA loans are tricky to originate, as they come with more complex qualification rules, underwriting guidelines and boxes to check than a standard conventional loan and are, thus, ripe for human error. Therefore, lenders must balance their need to offer a diverse array of loan products with maintaining loan quality to remain both profitable and compliant in today's market.
Defects by Loan Product Type: Q1 2023
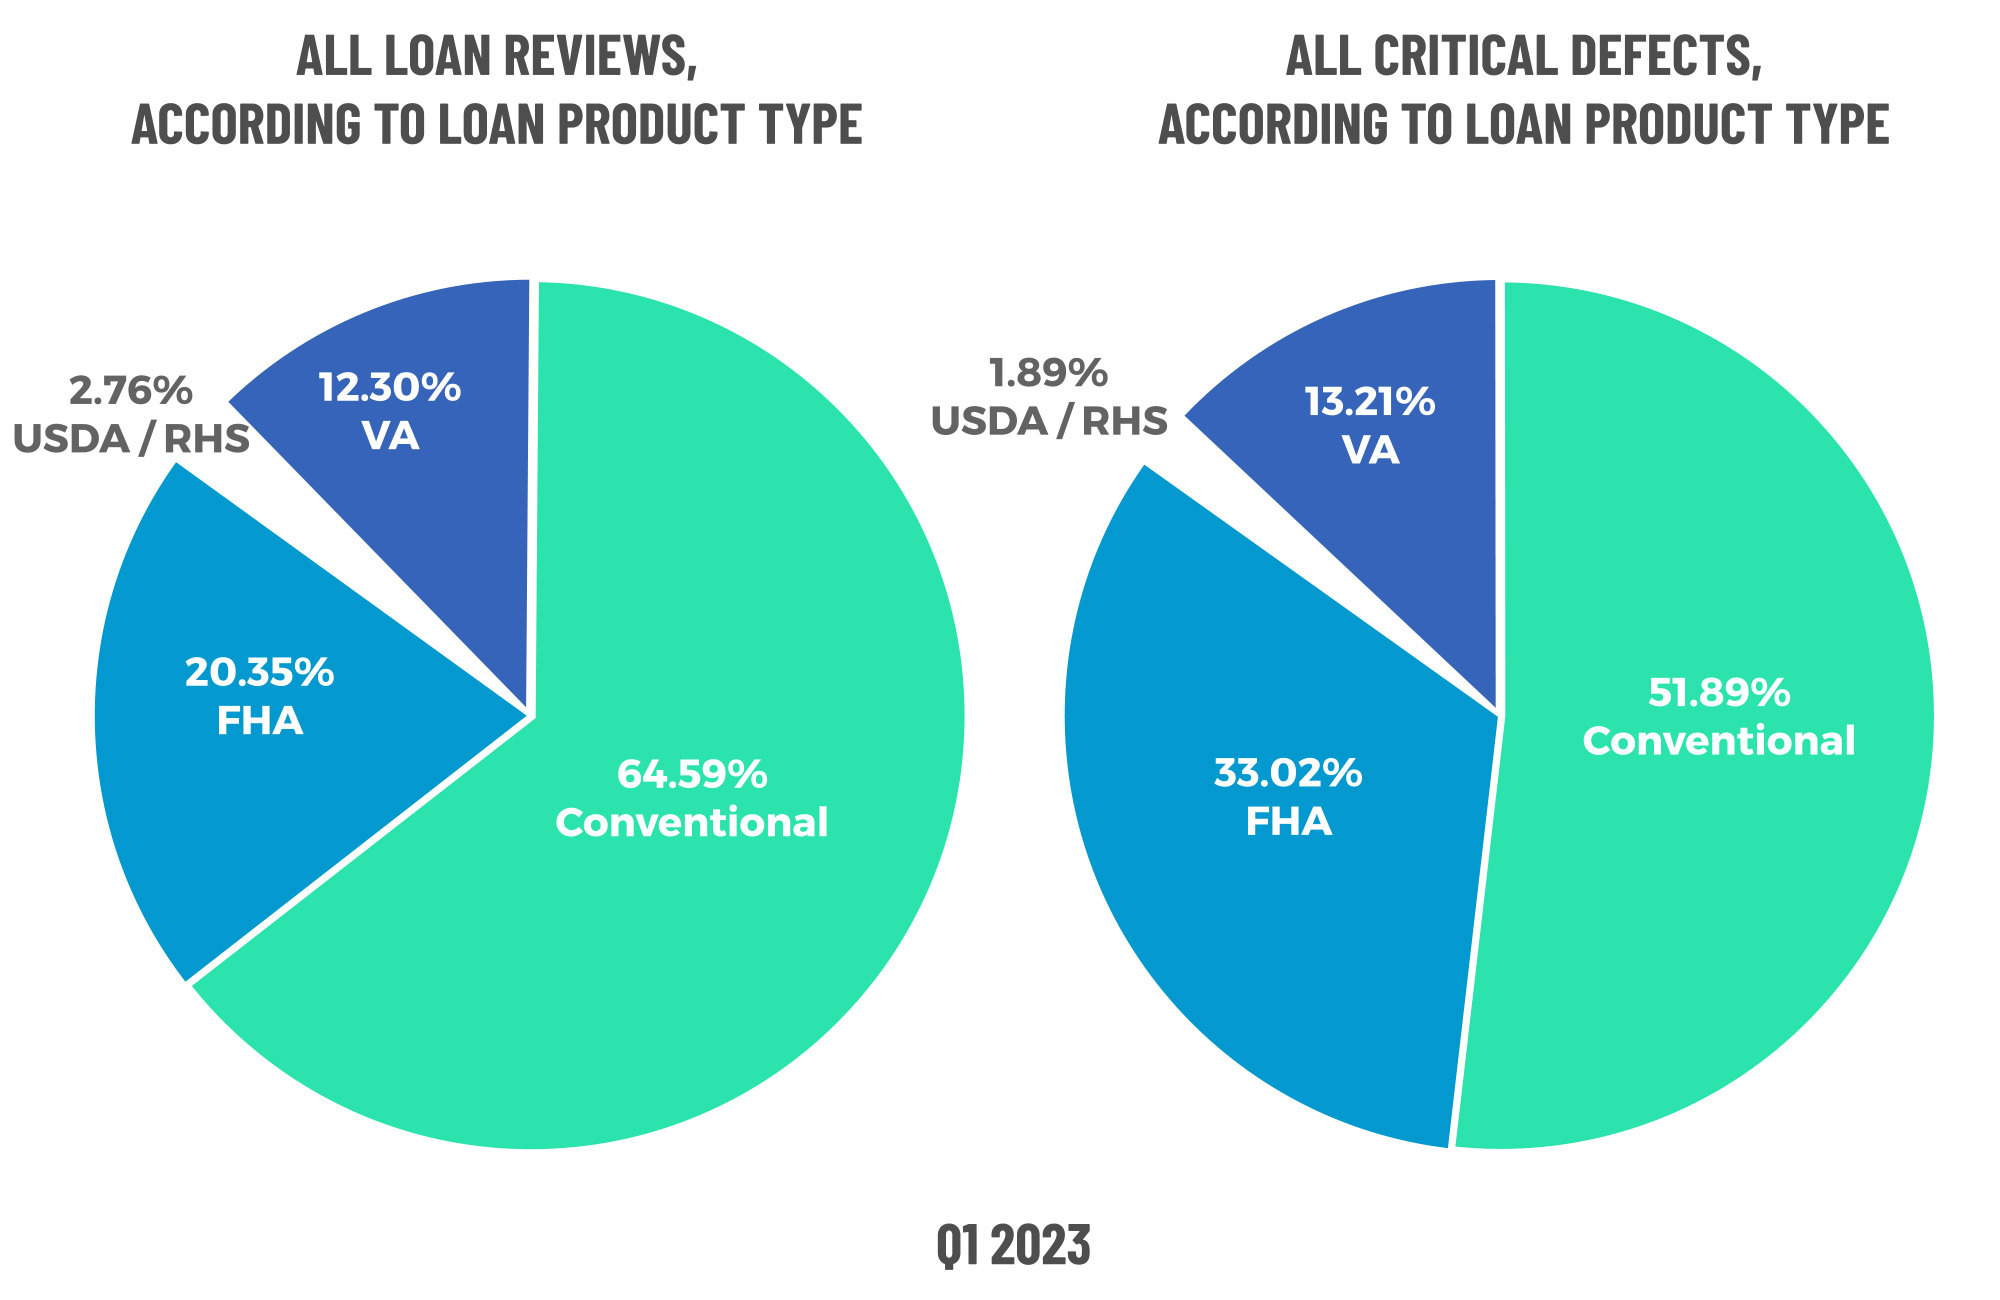
Figure 8 displays the loans reviewed and critical defects by loan type for Q1 2023.
Economic Discussion
In what has become a familiar refrain, interest rates and volumes are the main story behind this quarter's results. By Q1 2023, most lenders had "right-sized" their operations and were beginning to see the results of those efforts. While lenders reported a pre-tax, per-loan net loss of $1,972, or 68 basis points (BPS), in Q1, this result is an improvement over Q4 2022's record $2,812/99 bps per-loan loss and reverses the trend of production losses that began in Q4 20203. Moreover, total production revenue increased to 358 bps, resulting in a 16% increase in per-loan production revenue to $11,199 in Q1. Overall, 32% of lenders reported being profitable in Q1 versus 25% in Q4 2022.
Looking ahead, the data for Q2 2023 shows continual improvement, with pre-tax net losses dropping to $534 per loan and profitability reported by 58% of companies. In addition, total loan production expenses decreased to $11,044 per loan in Q2 2023. While that number is still higher than most lenders would like, production costs seem to be heading in the right direction after multiple quarters of growth.
Thus, it would seem that many of the worst staffing disruptions and layoffs are behind us, and the industry is now clearly in the space where the strong are trying to eat the weak. Many lenders are going out of business or simply closing their doors, while others have become prime acquisition targets.
According to the most recent MBA Mortgage Market Forecast available during the creation of this report, lenders should brace for continued pain throughout 2023 and pin their hopes on a better 2024. Larger macroeconomic events outside the U.S. (which we've discussed in previous reports) and concerns regarding budget deficits and U.S. Treasury refunding have driven rates higher despite cooling inflation4. However, with a mild recession expected in the first half of 2024, mortgage interest rates are expected to gradually decline towards the end of 2023, driving a rebound in origination volume throughout 2024 and 2025.
3 https://www.mba.org/news-and-research/newsroom/news/2023/05/18/imbs-report-pre-tax-net-production- losses-in-the-first-quarter-of-2023
4 https://www.mba.org/docs/default-source/research-and-forecasts/forecasts/2023/mortgage-finance-forecast-aug-2023.pdf?sfvrsn=ab7c1f86_1
Conclusion
Despite the multitude of challenges plaguing lenders in today's market, those who have weathered the storm thus far are seemingly doing so with an eye toward quality, which is encouraging. Mistakes are bound to happen, even when business is slow, and quality is a constantly moving target. Thus, seeing the continued decline in the overall critical defect rate on the heels of last year's historic high would indicate that lenders have not let the desire for volume override the need to reduce errors and mitigate risk.
What will be interesting to observe is the effect of Fannie Mae's required pre-funding QC reviews and truncated post-closing QC cycle times in the quarters leading up to and following the September 1, 2023, effective date. How did lenders respond to the directive after it was issued in March 2023, and what will be the short- and long-term implications of these changes on lenders' QC operations and loan quality in general? Until then, we encourage lenders to keep calm, stay the course, remain vigilant and carry on as best they can.
About the ACES Mortgage QC Industry Trends Report
The ACES Mortgage QC Industry Trends Report represents a nationwide post-closing quality control analysis using data and findings derived from mortgage lenders utilizing the ACES Analytics benchmarking software.
This report provides an in-depth analysis of residential mortgage critical defects as reported during post-closing quality control audits. Data presented comprises net critical defects and is categorized in accordance with the Fannie Mae loan defect taxonomy.
About ACES
ACES Quality Management is the leading provider of enterprise quality management and control software for the financial services industry. The nation’s most prominent lenders, servicers and financial institutions rely on ACES Quality Management & Control® Software to improve audit throughput and quality while controlling costs, including:
- 4 of the top 5 and more than 50% of the top 50 independent mortgage lenders;
- 8 of the top 10 loan servicers;
- 11 of the top 30 banks; and
- 3 of the top 5 credit unions in the USA.
Unlike other quality control platforms, only ACES delivers Flexible Audit Technology, which gives independent mortgage lenders and financial institutions the ability to easily manage and customize ACES to meet their business needs without having to rely on IT or other outside resources. Using a customer-centric approach, ACES clients get responsive support and access to our experts to maximize their investment.
For more information, visit www.acesquality.com or call 1-800-858-1598.
Media Contact: Lindsey Neal | DepthPR for ACES | (404) 549-9282 | lindsey@depthpr.com
View all reports