ARMCO’s Mortgage QC Industry Trends Report represents an analysis of quality control findings throughout the United States using extensive data derived from the ACES Analytics benchmarking software. This report is designed to provide business leaders and mortgage quality control professionals meaningful information on nationwide loan quality trends.
Executive Summary
QC Industry Trends – Overview
QC Industry Trends – by Category
QC Industry Trends – by Loan Purpose
QC Industry Trends – by Loan Type
Conclusion
About this Report
Executive Summary
This report presents industry trends in mortgage quality control for the second quarter of 2016 based on analysis of loan files and defects captured in the ACES Analytics benchmarking system. The ACES Analytics benchmarking dataset includes post-closing quality control data from over 60 lenders, comprising more than 50,000 unique loans. Defects are categorized using the Fannie Mae loan defect taxonomy. An analysis of top-ranking defect categories for 2016 shows that Legal/Regulatory/Compliance and Loan Package Documentation continue to be the leading defect categories.
Report highlights include:
- Overall Critical Defect Rate drops to 1.63%, ending the upward swing that reaches back to Q3 2015.
- In Q2 2016, the Legal/Regulatory/Compliance defect category edged downward for the first time in 9 months.
- Loan Package Documentation defects continue to be one of the most frequently occurring individual defect categories, although only a slight uptick is noted in Q2.
QC Industry Trends - Overview
Figure 1 displays the overall percentage of critical defects reported over the past four quarters. According to the ACES Analytics data, the upward trend of the critical defect rate peaked in Q1 2016 and the second quarter data provides the first notable decrease in a year. The Q2 data documents the first quarter to quarter drop in the benchmark Critical Defect Rate since mid-2015.
Critical Defect Rate, Q3 2015 – Q2 2016
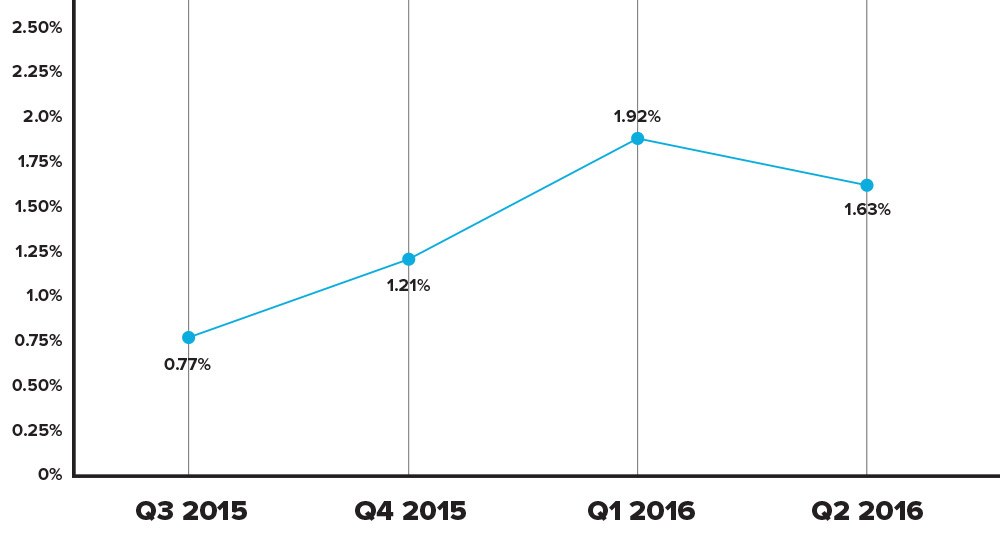
Figure 1: Percentage of all critical defects by quarter
QC Industry Trends – By Category
Figure 2 shows a breakdown of reported net defects in accordance with Fannie Mae defect categories along with the percentage of defects found in both Q1 and Q2 of 2016. Legal/Regulatory/Compliance and Loan Package Documentation continue to be the top two defect categories. However, a positive trend is evident in Q2 with an overall reduction in the reported defects attributed to the Legal/Regulatory/ Compliance category. Reaching a high of 50% in Q1 2016, a reduction to 34% in Q2 provides a sign of relief for all organizations battling with the implementation of TRID. Loan Package Documentation saw little change in our Q2 results, holding steady at just over 26% of the overall loan defects. A few of the more credit driven defect categories saw increases, including Assets (6.8%), Borrower and Mortgage Eligibility (8.9%) and Income/Employment rounding out as the 3rd highest defect category at 9.8%.
Defect Rates by Fannie Mae Category, 2016 Q1 vs. Q2
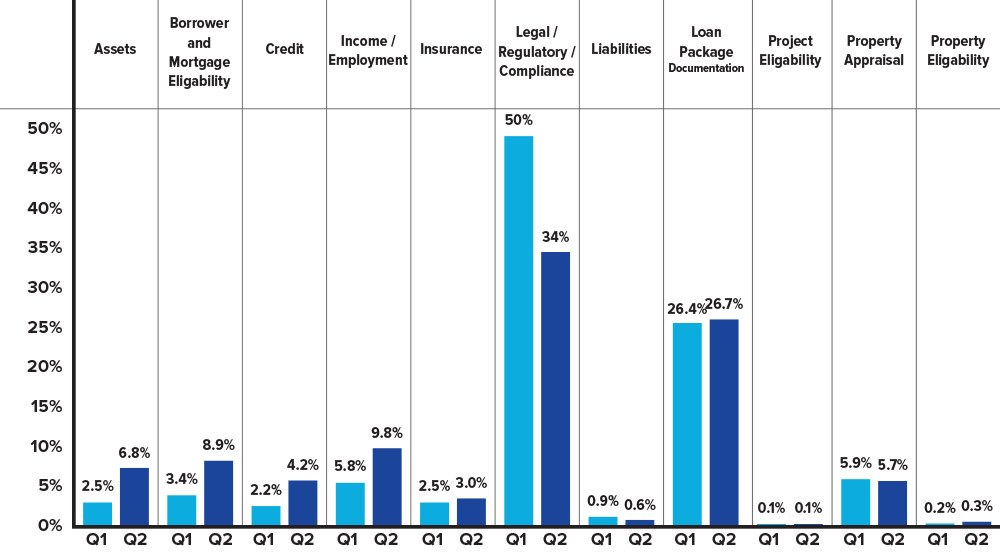
Figure 2: Breakdown of defects by Fannie Mae categories for Q1 vs. Q2 2016.
Figure 3 highlights a focused breakdown of the Legal/Regulatory/Compliance defect category by the percentage of defects found in the most recent four quarters. The Legal/Regulatory/Compliance category showed a notable decrease in reported defects in Q2, although it is still the top reported defect category.
Based upon input from many of the contributing lenders, we have identified a few commonalities with respect to corrective action planning that are driving down the defect rate for this category. The top reported corrective action has been lenders working diligently with their loan origination system (LOS), internal personnel and external providers during the first six months post-TRID to implement automated solutions to mitigate many of the common data errors seen earlier in the implementation phase. An example of this collaboration is the concerted effort to standardize the naming conventions of all loan fees to provide consistency in how fees are disclosed from the initial LE thru the final CD.
To provide quick and efficient corrective action, many lenders are conducting ad-hoc training to address emerging process errors that have been identified during early implementation. Many lenders contributing to our benchmark have identified and implemented newly defined 'best practices' and additional process risk controls to mitigate errors identified during early implementation.
Loan/Regulatory/Compliance as a Percentage of the Total Defects, Q3 2015 — Q2 2016

Figure 3: Legal/Regulatory/Compliance defects as percentage of total defects by quarter.
Figure 4 provides a 12-month trending of the Legal/Regulatory/Compliance defect category as a percentage of overall defects. As the top defect category for the previous 3 quarters, the data provides a detailed view of how the implementation of TRID in October 2015 has directly affected reported defects across the industry.
As Legal/Regulatory/Compliance defects are beginning to trend down in Q2, lenders are attributing at least part of this success to a deeper comfort level with the secondary market reviews/findings (e.g. the mortgage industry has a much better feel for how the TRID loans are being reviewed and how violations are being interpreted by the secondary market).
Loan/Regulatory/Compliance Defects, Monthly Trending

Figure 4: Breakdown of defect category Legal/Regulatory/Compliance by month.
Figure 5 shows the trend for the Income/Employment defect category as a percentage of overall defects. The Income/Employment category represented 9.80% of all defects in Q2 of 2016, a 70% increase from the previous quarter.
Income/Employment, as a Percentage of the Total Defects, Q3 2015 – Q2 2016
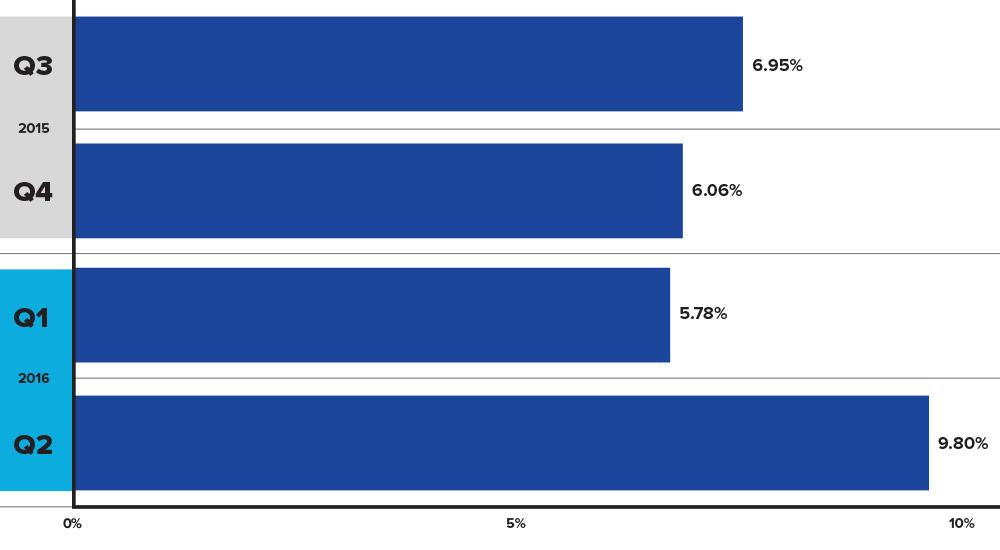
Figure 5: Breakdown of defect category Income/Employment by quarter.
Income and Employment Q2 2016
Figure 6 shows a breakdown of the Income/Employment defects by sub-categories. This deeper view provides necessary detail for lenders to address the root cause of their loan level defects. When followed by the identification of the actual loan level defects that are attributed to the Income Documentation sub-category, it can enable lenders to take the appropriate corrective action planning.
By an overwhelming margin, defects relating to Income Documentation are the top sub-category of our Income and Employment category. As we look closely and analyze the loan level defects, we have identified these top 3 contributors:
- Verbal Verifications of Employment (VVOE) not completed in accordance with the timing requirements of the Investor.
- Income Documentation does not support the requirements outlined in the AUS and or Investor guidelines.
- Income and/or Employment information differs from that contained in the final AUS.
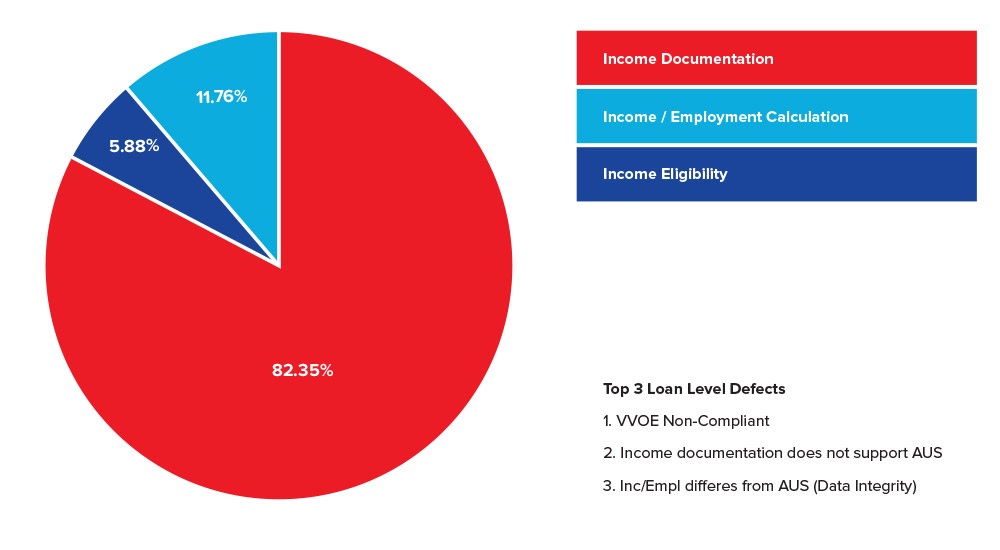
Figure 6: Breakdown of Income/Employment by sub-categories.
Conclusion
The quality control trends outlined in this report provide insights on all reported defects identified during the post-closing quality control process. In Q2 2016, as in the previous quarter, Legal/Regulatory/Compliance defects were the major driver of the overall defect rate as lenders continued to struggle with implementation of TRID requirements. At the same time, the reported decrease in Q2 provides initial evidence that industrywide improvement is beginning to take hold. Lenders are gaining confidence that their corrective action planning is working and that the proper protocols are in place to successfully administer TRID in accordance with the comprehensive requirements. As we begin to key in on other defect categories, the ability to dive deeper and clearly identify the root cause of all loan defects and defect categories will continue to provide insight and improvement of the overall manufacturing process.
About the ARMCO Mortgage QC Industry Trends Report
The ARMCO Mortgage QC Industry Trends Report represents post-closing quality control analysis throughout the United States using data and findings derived from mortgage lenders utilizing the ACES Analytics benchmarking software. This report provides an in-depth analysis of residential mortgage defects as reported during post-closing quality control audits. Data presented comprises net defects and is categorized in accordance with the Fannie Mae loan defect taxonomy.
About ARMCO
ARMCO – ACES Risk Management delivers web-based audit technology solutions, as well as powerful data and analytics, to the nation’s top mortgage lenders, servicers, investors and outsourcing professionals. A trusted partner devoted to client relationships, ARMCO offers best-in-class quality control and compliance software that provides U.S. banks, mortgage companies and service providers the technology and data needed to support loan integrity, meet regulatory requirements, reduce risk and drive positive business decisions. ARMCO’s flagship product, ACES Flexible Audit Technology®, is available at any point in the mortgage loan lifecycle, to any size lender, and is user-definable. ACES standardizes audit requirements, ties pre-funding reviews to post-closing quality control audits, enables seamless trend analysis, identifies credit, compliance and process deficiencies and helps create manageable action plans. For more information, visit www.acesquality.com or call 1-800-858-1598.
MEDIA CONTACT:
Depth Public Relations
Telephone: 404-549-9282
Email: lindsey@depthpr.com