ARMCO’s Mortgage QC Industry Trends Report represents an analysis of nationwide quality control findings based on data derived from the ACES Analytics benchmarking software.
Executive Summary
QC Industry Trends – Overview
QC Industry Trends – by Category
QC Industry Trends – by Loan Purpose
QC Industry Trends – by Loan Type
Conclusion
About this Report
Executive Summary
This report represents an analysis of post-closing quality control data derived from loan files analyzed by the ACES Analytics benchmarking system during the second quarter of 2019 (Q2 2019). The analysis and commentary include prior quarter data and prior year data.
Findings for the Q2 2019 Trends Report are based on post-closing quality control data from over 90,000 unique loans. All reviews and defect data that were evaluated for this report were based on loan audits selected by lenders for full file review.
Defects are categorized using the Fannie Mae loan defect taxonomy. Data for any given calendar quarter is analyzed no earlier than 90 days after the end of the quarter to allow sufficient time for lenders to complete the post-closing quality control cycle. Hence, ARMCO releases analyses for Q2 2019 in Q4 2019.
NOTE: A critical defect is defined as a defect that would result in the loan being uninsurable or ineligible for sale. The critical defect rate reflects the percentage of loans reviewed for which at least one critical defect was identified during the post-closing quality control review and all reported defects are net defects.
Summary of Findings
Overall loan quality remained high in Q2 2019 as the critical defect rate continued to decline, returning to levels similar to the first half of 2018.
Report highlights include the following findings for Q2 2019:
- Loan quality trends are positive: the overall critical defect rate in Q2 2019 fell 5.5% from the preceding quarter, and a 9.0% decline from the 2018 peak rate of 1.93% (Q4 2018). In Q2 2019, defects in Income/Employment and Credit, both core underwriting functions, declined 32.0% and 22.0% respectively, from the preceding quarter.
- Interest rates in Q2 2019 were roughly a full point lower than Q2 2018 (3.3% vs 4.2%), which fueled a high refi-to-purchase ratio.
- In Q2 2019, refinances comprised a higher percentage of all loans reviewed when compared to previous quarters, and were a driver in the quarter’s lower critical defect rates.
In Q2 2019, critical defects on FHA loans underperformed conventional loans by a greater percentage than previous quarters.
QC Industry Trends – Overview
The mortgage market was humming on all cylinders in early 2019 and loan quality is along for the ride. After a somewhat tumultuous second half of 2018, lenders started to go on offense again in the first part of 2019.
In Q2 2019, several factors contributed to an upswing in overall loan quality, most notably, moderating rates and manageable increases in volume. Refinance volume stayed steady and lenders were able to keep staffing stable and maintain underwriting turn times at normal pacing. As a result, the critical defect rate dropped to its lowest level in six quarters.
In Q2 2019, the overall critical defect rate was 1.72%, a 5.5% decline from the preceding quarter and a 9.0% decline from the 2018 peak rate of 1.93% (Q4 2018). More importantly, the Q2 2019 critical defect rate continued a downward trend, with numbers approaching the average rate for 2017 (1.68%).
Many economists continue to report on the market’s sizable percentage of loans with economic incentive to refinance. This news reinforces stability among lenders, which aids the manufacturing process and particularly underwriting turn-time stress as the origination process is more under the lender’s control with less counterparties and less documentation and steps required. Refinances generally have lower defect rates overall and given the strong refinance opportunities that remain in the marketplace, we anticipate that defect rates will remain steady or slightly decline over the rest of the year.
Going forward into the remainder of 2019, we will be evaluating the market impact of seasonality (i.e. the third quarter/end of the summer buying season). More specifically, we will watch for cause-and-effect movement such as whether seasonality disrupts the increasing loan volumes we have seen in 2019 as compared to 2018 or if interest rates increase and act as a lever for the effects of seasonality (lower loan volumes overall).
Critical Defect Rate by Quarter: Q3 2018 – Q2 2019
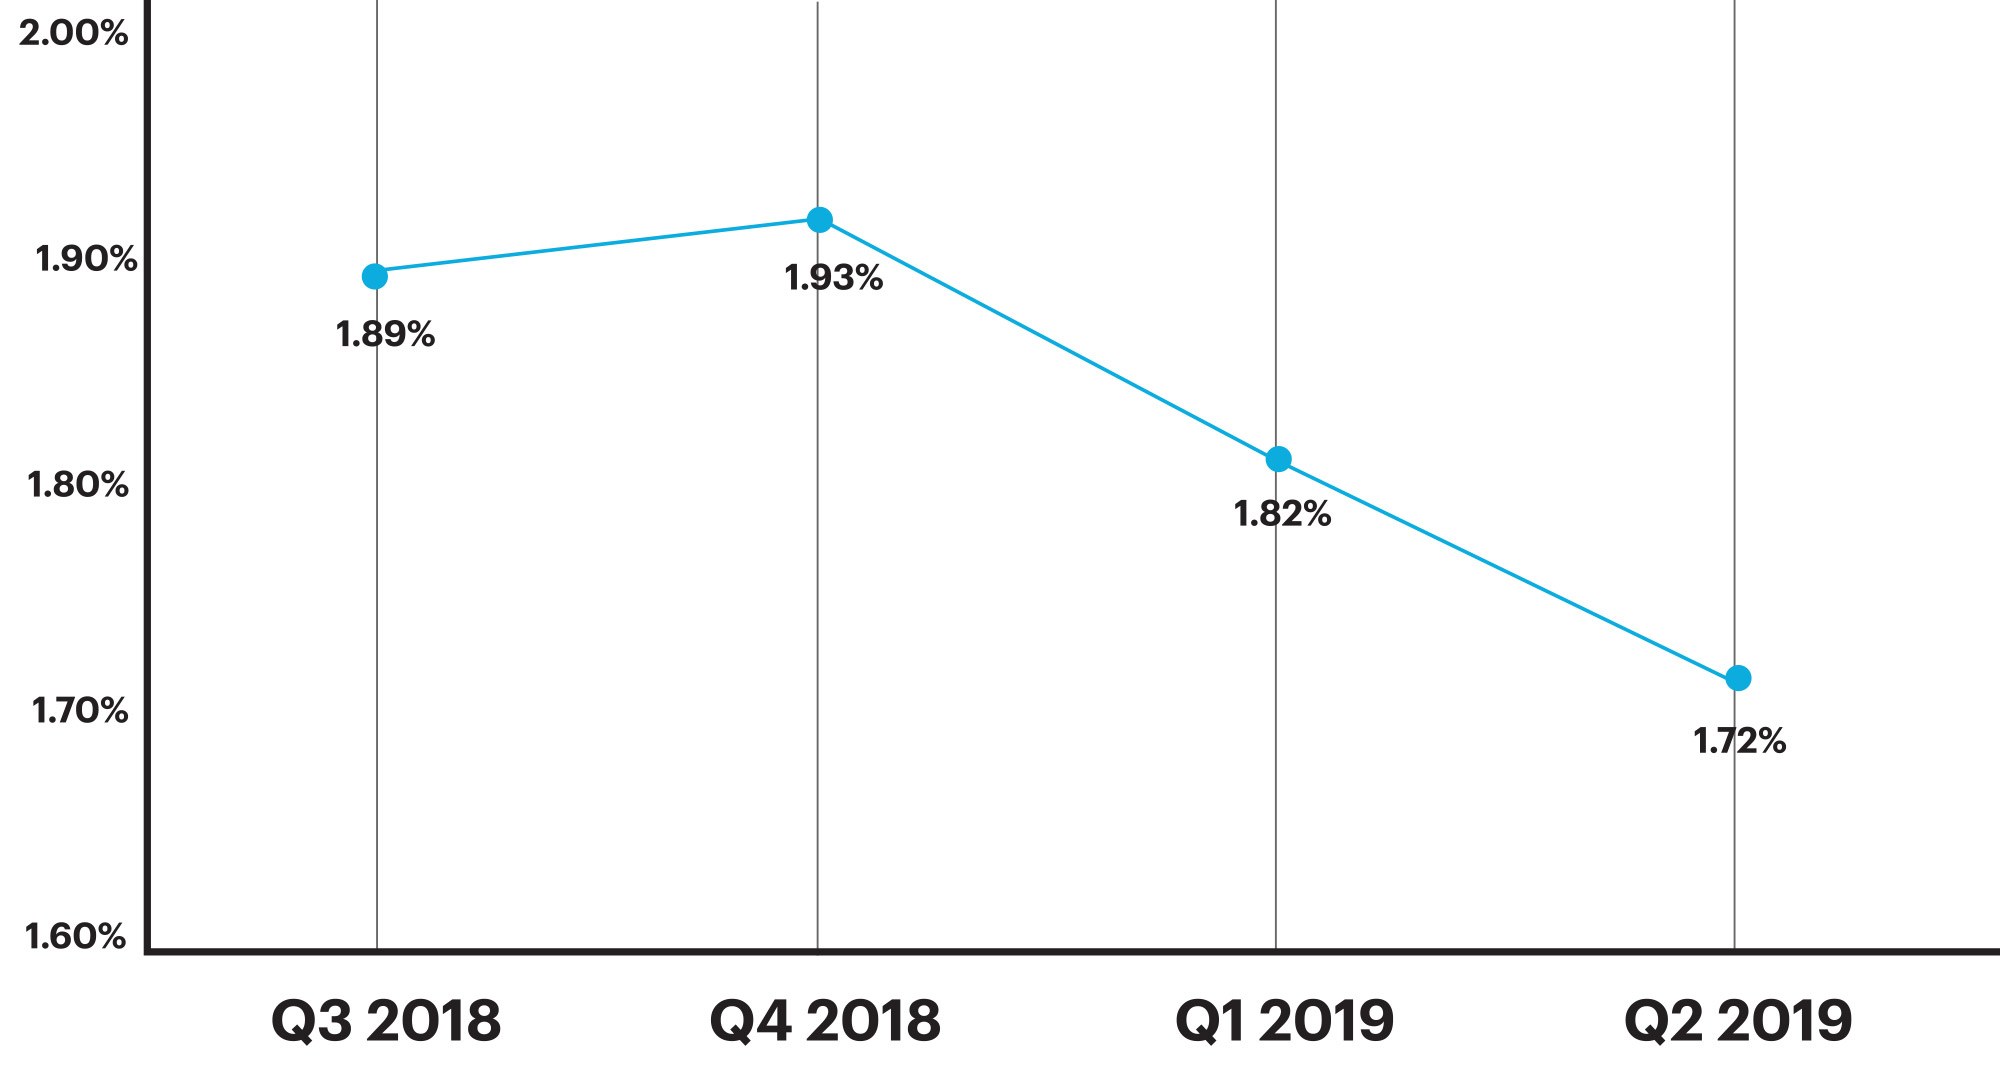
Figure 1: Percentage of loans with critical defects, by quarter. Figures reflect the number of loans containing at least one critical defect as a percentage of the total closed loans reviewed.
QC Industry Trends by Defect Category
Q2 2019 revealed several factors contributing to the industry’s continued positive movement with respect to loan quality. Of significant note is the dramatic decline in defects related to the category of Income/Employment. Loans with income-related defects declined 32.0%, falling from 27.78% of all critical defects in Q1 2019 to 18.85% of all critical defects in Q2 2019.
Defects attributed to the Loan Package Documentation category declined 35.0% from 24.07% in Q1 2019 to 15.71% in Q2 2019. While dramatic, this change is characteristic of the considerable fluctua- tion seen in this category over the past twelve months. In Q4 2018, the category’s defect rate was 15.53%. In the preceding quarter (Q3 2018) it was 23.61%.
These dramatic fluctuations demonstrate how sharp surges and downturns in loan origination volume can impact lenders. Loan origination volume declined during the last two quarters of 2018, causing staffing and other process disruption with lenders and resulted in multi-year highs in defect rates. Then, in Q1 2019, loan volume increased and Loan Package Documentation defects increased along with it. Sudden or dramatic changes in loan volumes almost always impact the number of defects attributed to Loan Package Documentation. When volume declines, as it did in Q3 2018 and Q4 2018, lenders tend to downsize and reassign staff. When volume increases quickly, lenders’ staff deficit often leads to extended underwriting turn times, a key contributor to defects related to Loan Package Documentation. When underwriting turn times increase, more documents expire prior to closing, compromising loan quality, and closing times are longer than normal. When volume stabilizes, as it did in Q2 2019, lenders’ systems have a chance to adapt. As a result, the number of defects related to Loan Package Documentation decreases.
Critical Defects by Fannie Mae Category: Q2 2019
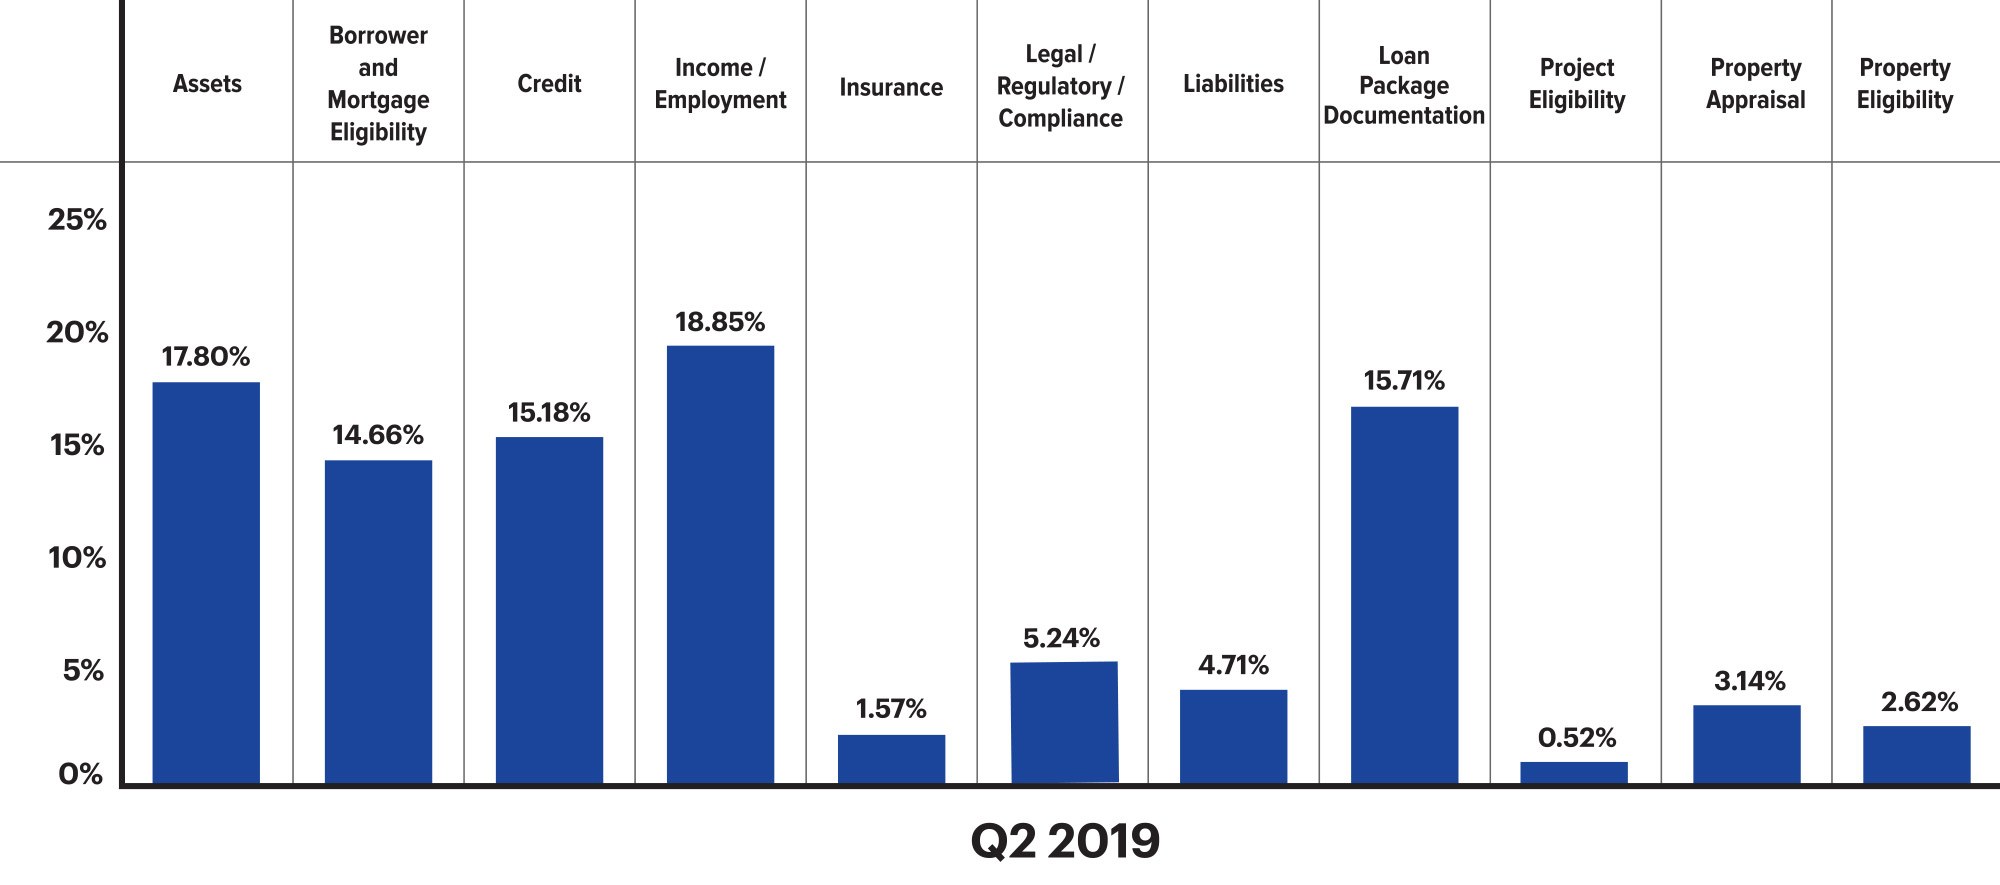
Figure 2: displays Q2 2019 net critical defects as a percentage of all critical defects, according to Fannie Mae defect category.
Critical Defects by Fannie Mae Category: Q1 2019 vs. Q2 2019
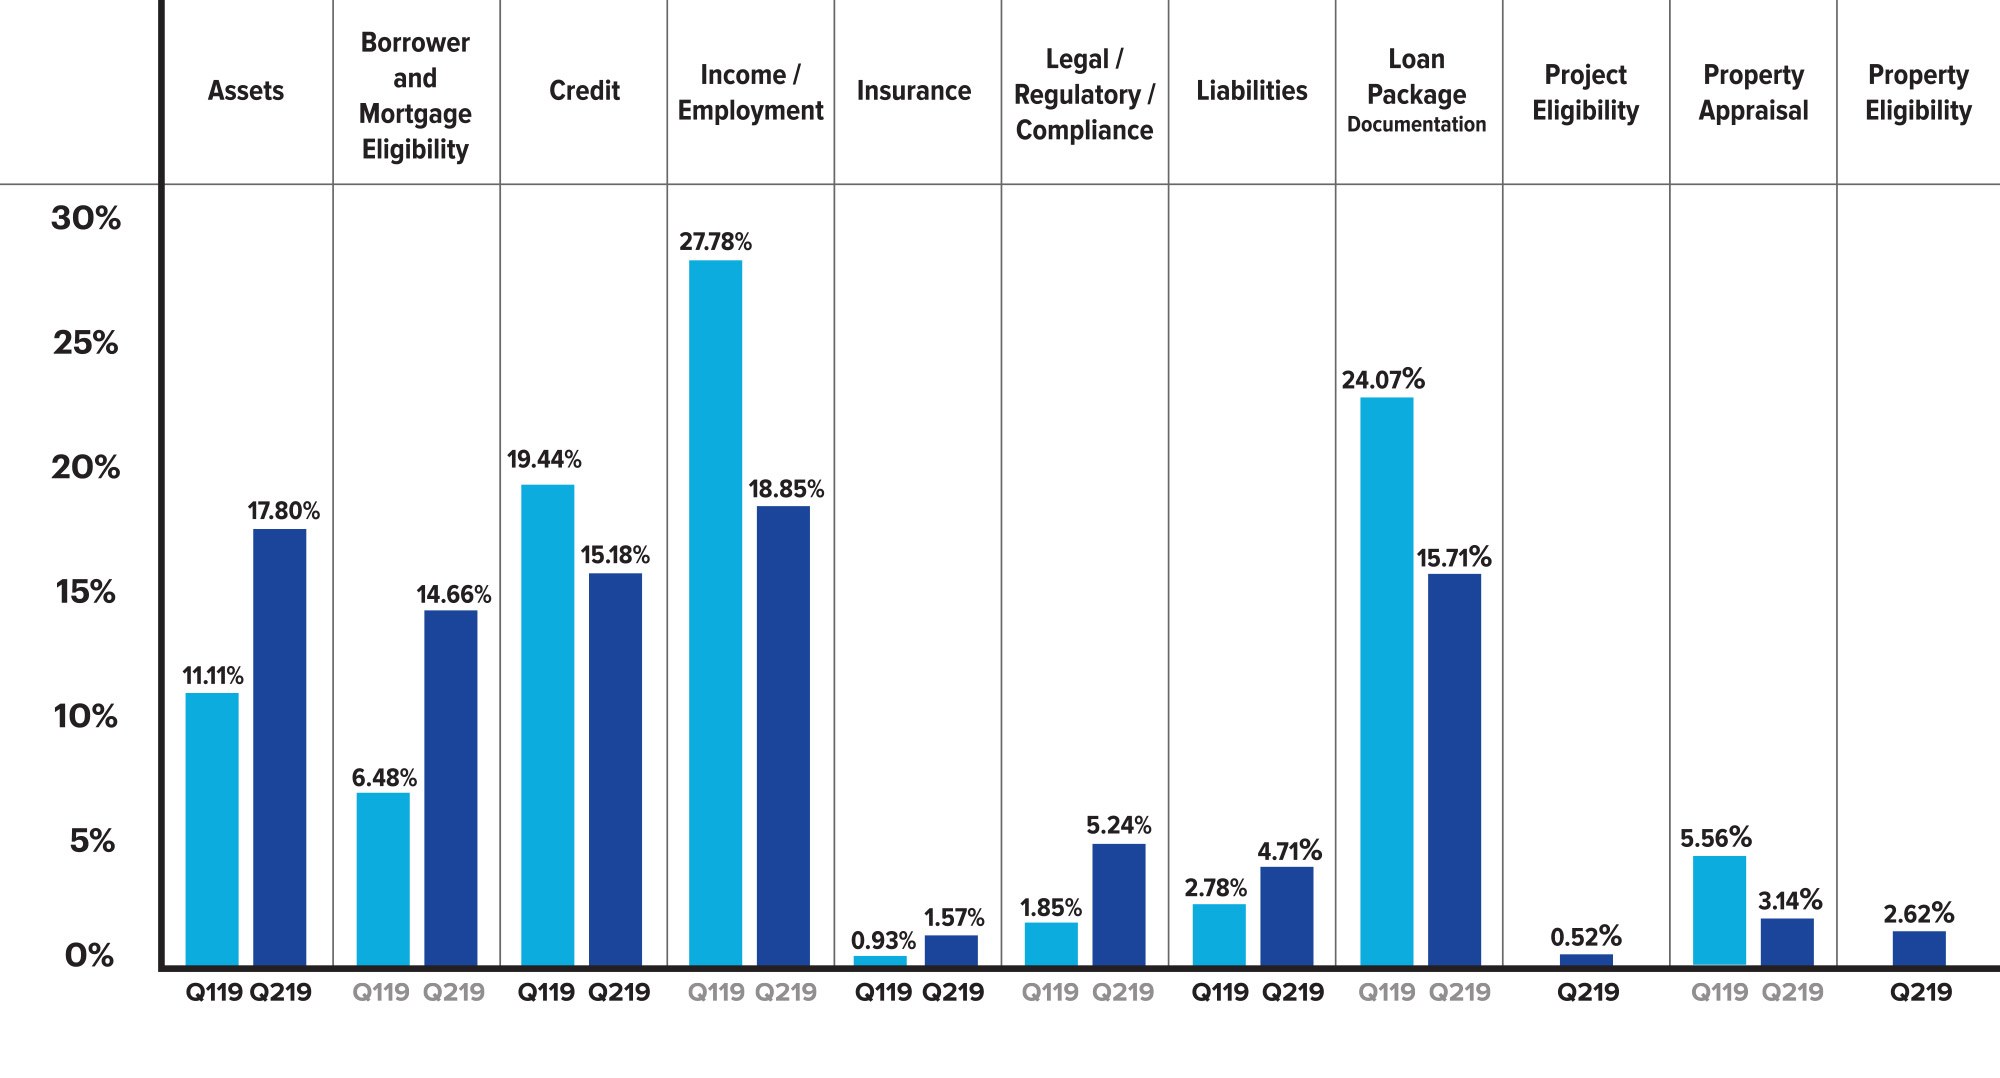
Figure 3: Q1 2019 vs. Q2 2019 share of net critical defects according to Fannie Mae Category.
While data on the distribution of defects and in-category fluctuation can inform on a macro level, a granular assessment reveals information that can inform strategies and decisions at the lender level.
Figure 4 looks into the subcategories of the three top defect categories for Q2 2019. In the Income/Employment category, defects attributed to Income Documentation fell 15.16%, from 66.67% in Q1 2019 to 56.56% in Q2 2019. Similarly, those attributed to Income Eligibility fell 16.6%, from 6.67% in Q1 2019 to 5.56% in Q2 2019. However, defects attributed to Income Calculation increased 45.82%, from 26.67% in Q1 2019 to 38.89% in Q2 2019.
Within the Loan Package Documentation category, quarter-over-quarter changes in subcategories reveal the primary driver for the dramatic decline in overall category defects: a large decline in Closing/Title-related defects, which fell 27.03%, from 73.08% in Q1 2019 to 53.33% in Q2 2019.
Critical Defects by Fannie Mae, by sub-categories: Q2 2019
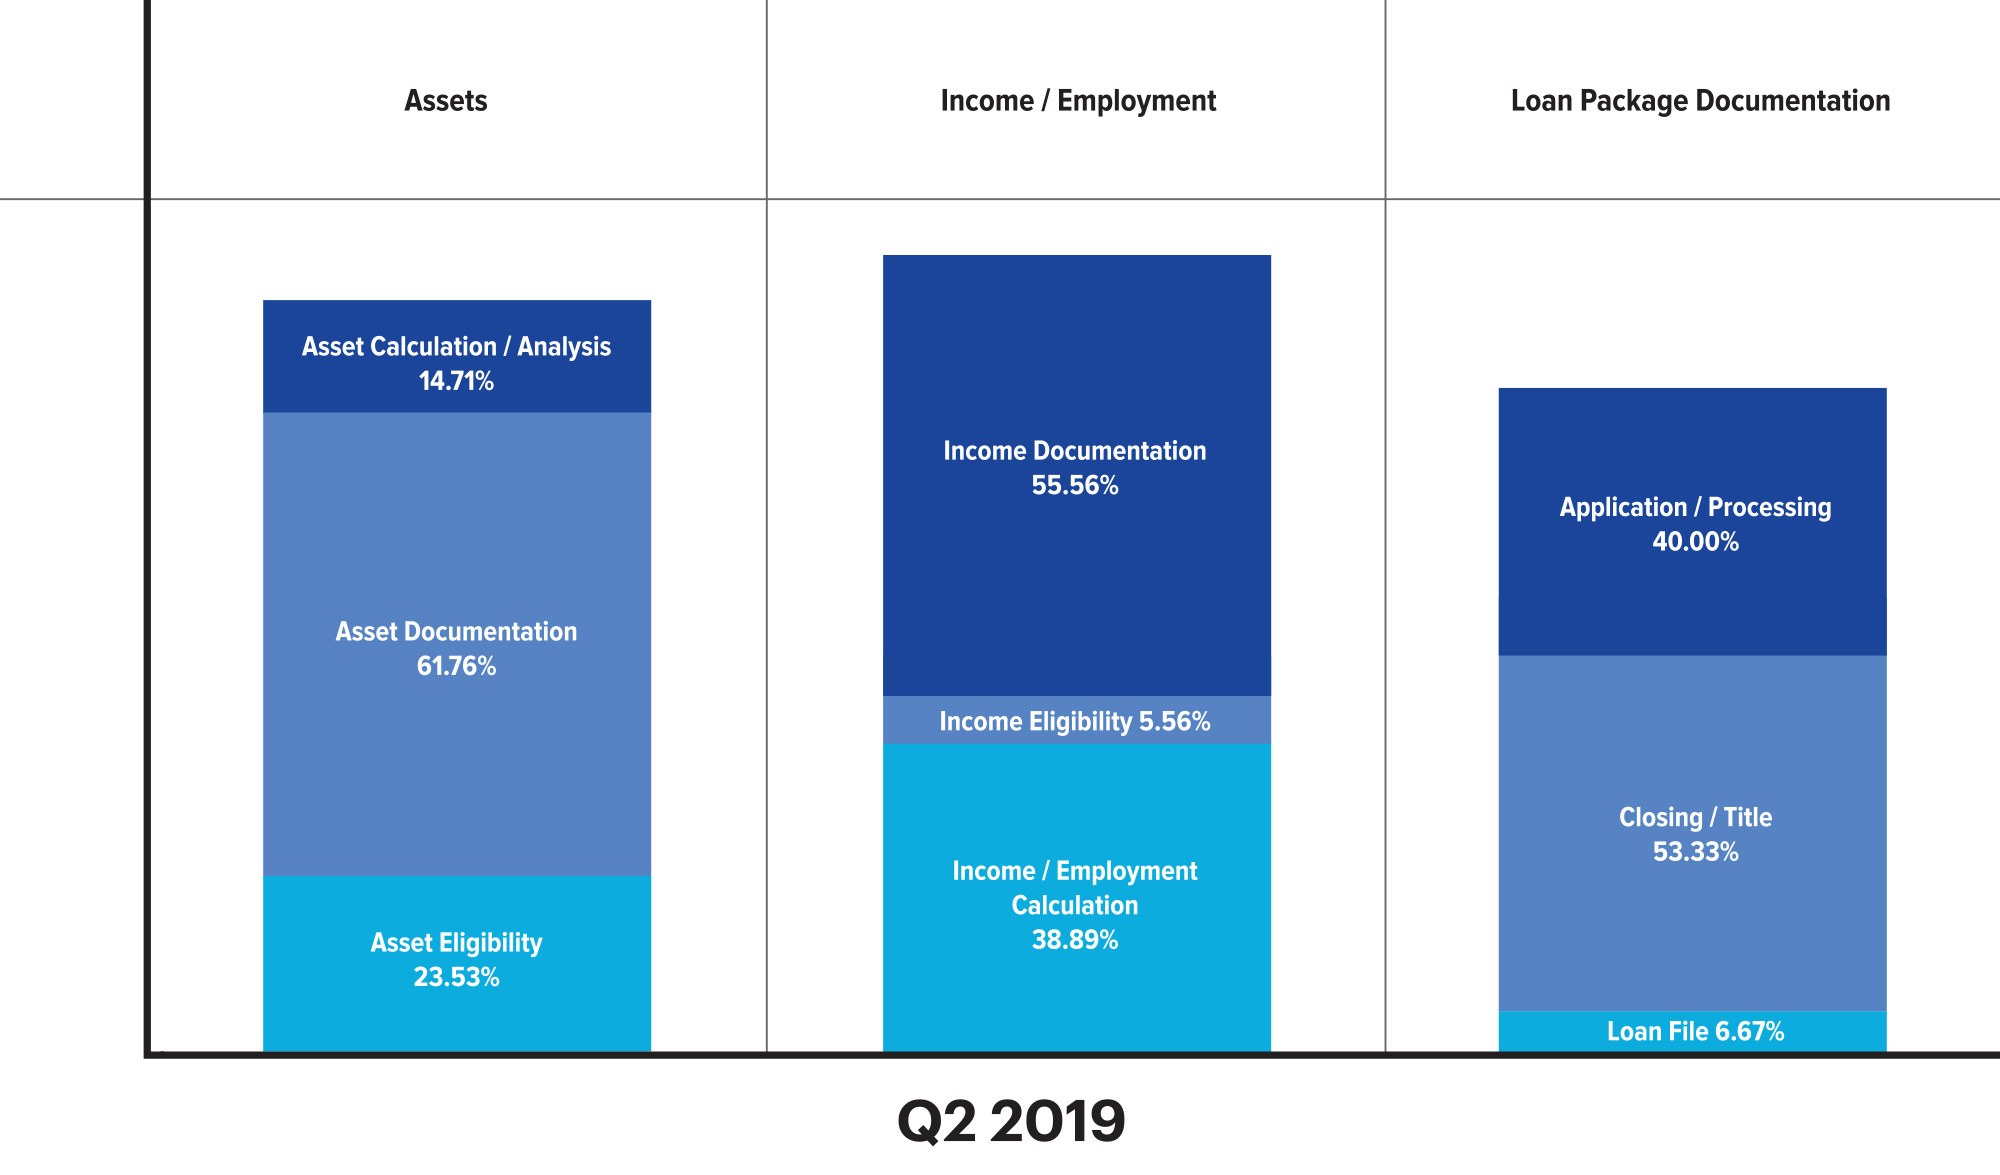
Figure 4: displays the Q2 2019 defects by Fannie Mae subcategory expressed as a percentage of the overall category.
QC Industry Trends by Loan Purpose
In Q2 2019, the purchase/refinance distribution remained nearly identical to the preceding quarter. Refinances comprised 28.28% of all transactions reviewed in Q2 2019 and 28.47% of all transactions reviewed in Q1 2019. In contrast, the percentage of refinances during the quarter preceding these two (Q4 2018) was a full 6% higher at 28.4% of all transactions reviewed, with a critical defect rate that peaked and reached a three-year high.
As is typical, refinances out-performed purchase transactions from a quality standpoint in Q2 2019. Refinances comprised 28.28% of all loans reviewed but only 27.27% of loans with defects. While performing better than purchase transactions, the refinance transactions in Q2 2019 performed slightly worse than refinance transactions in the preceding quarter where they comprised 28.47% of all loans reviewed but accounted for only 19.80% of loans with defects.
Loans Reviewed vs. Critical Defects by Loan Purpose: Q2 2019
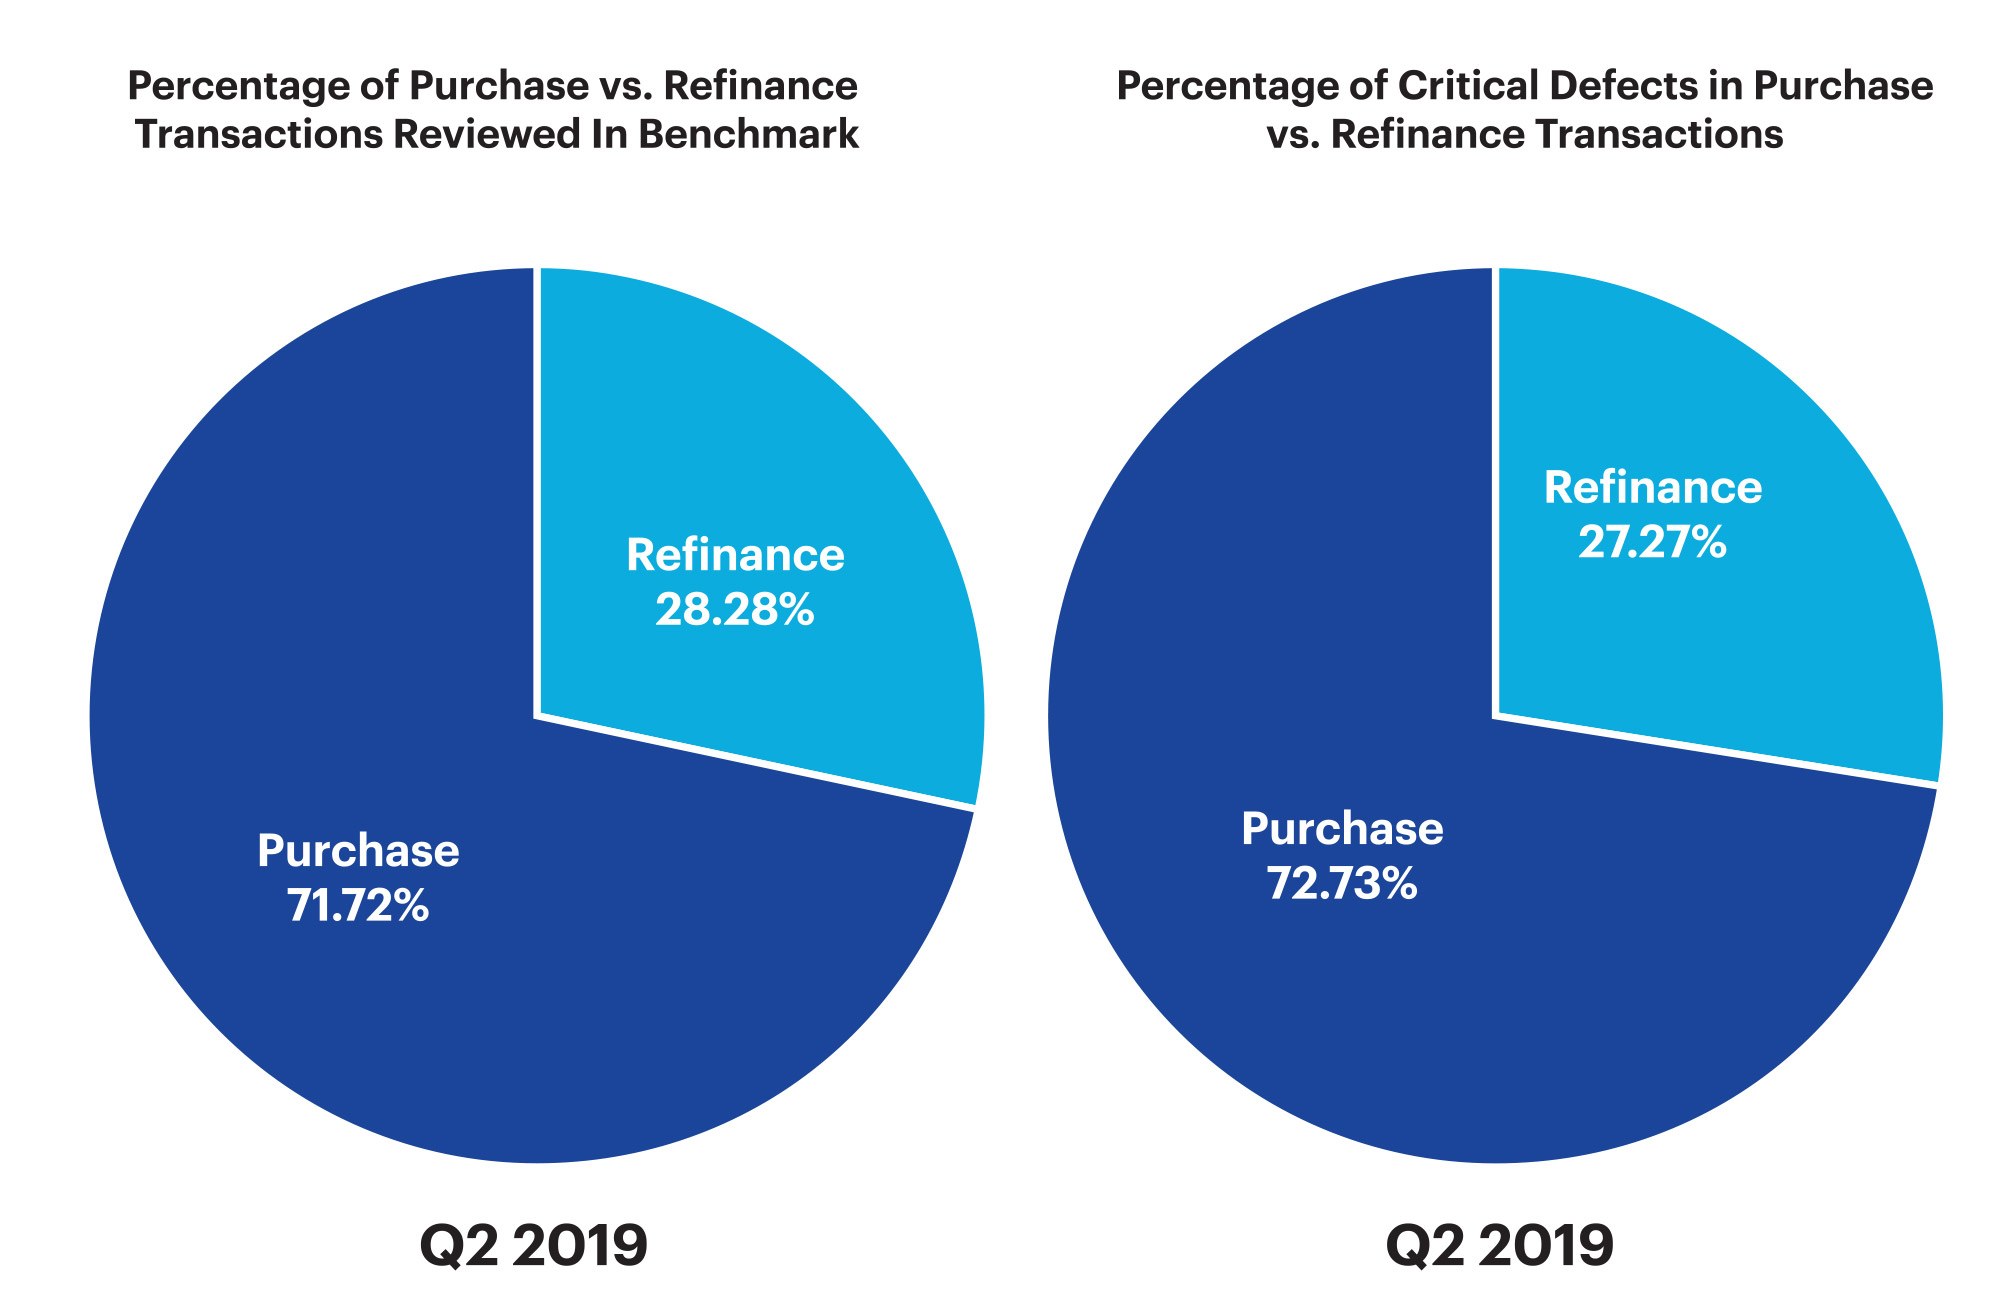
Figure 5: displays Q2 2019 provides a comparison of loan performance between purchase and refinance transactions.
Relationship Between Critical Defect Rate and Refinances
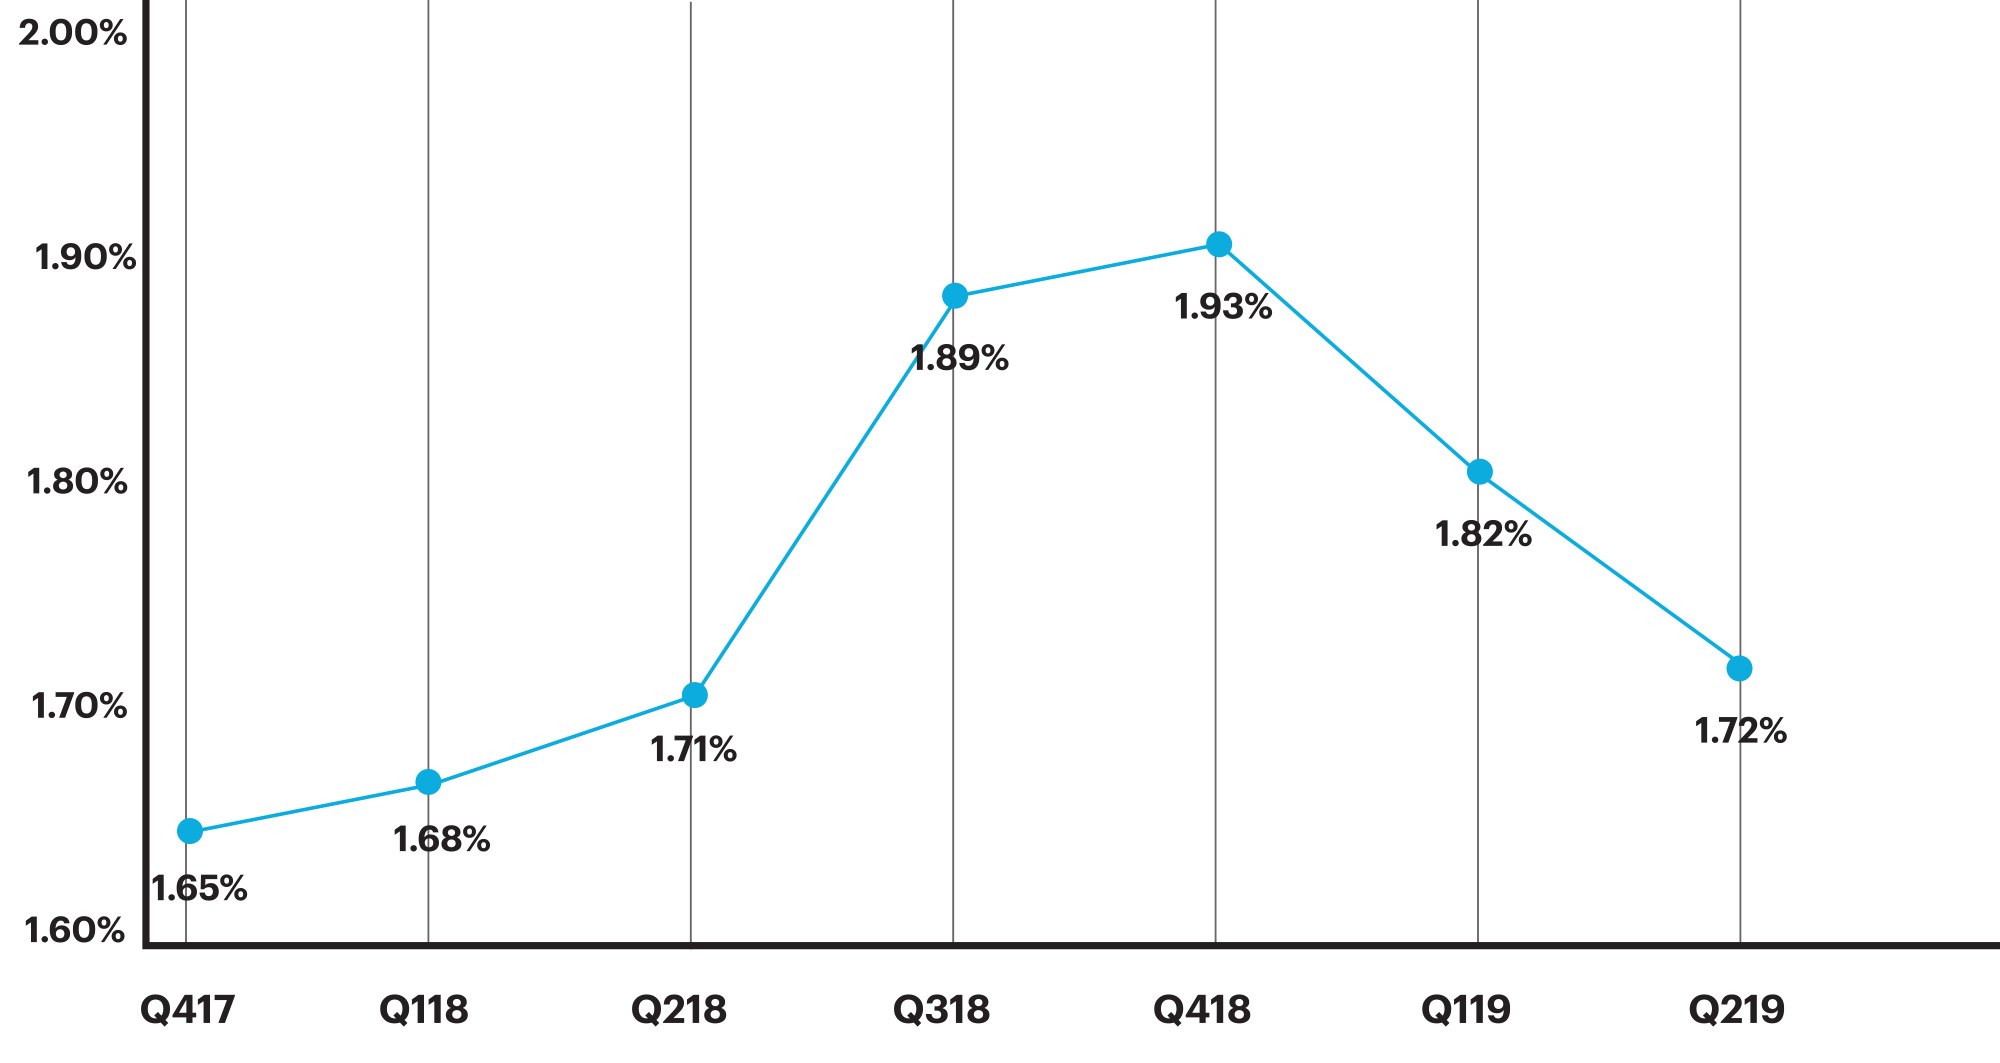

Figure 6: shows the share of refinance and purchase loans, with the overall critical defect rate for each quarter.
QC Industry Trends by Loan Type
In Q2 2019, the distribution of loans by loan type remained fairly consistent with the preceding quarter. Conventional loans accounted for 61.88% of all loans reviewed and 41.96% of loans that had defects (as compared with 58.90% of all loans reviewed and 42.57% of loans with defects in Q1 2019). While performance among conventional loans improved slightly, overall FHA quality declined. In Q2 2019, the percentage of FHA loans fell slightly to 27.85% of all loans reviewed, while accounting for a greater percentage (48.25%) of loans with a critical defect—a differential of 20.40%. In contrast, in the preceding quarter, FHA loans accounted for 30.71% of all loans reviewed but 46.53% of loans with a critical defect—a differential of 15.82%.
Critical Defects as a Percentage of All Loan Types: Q2 2019
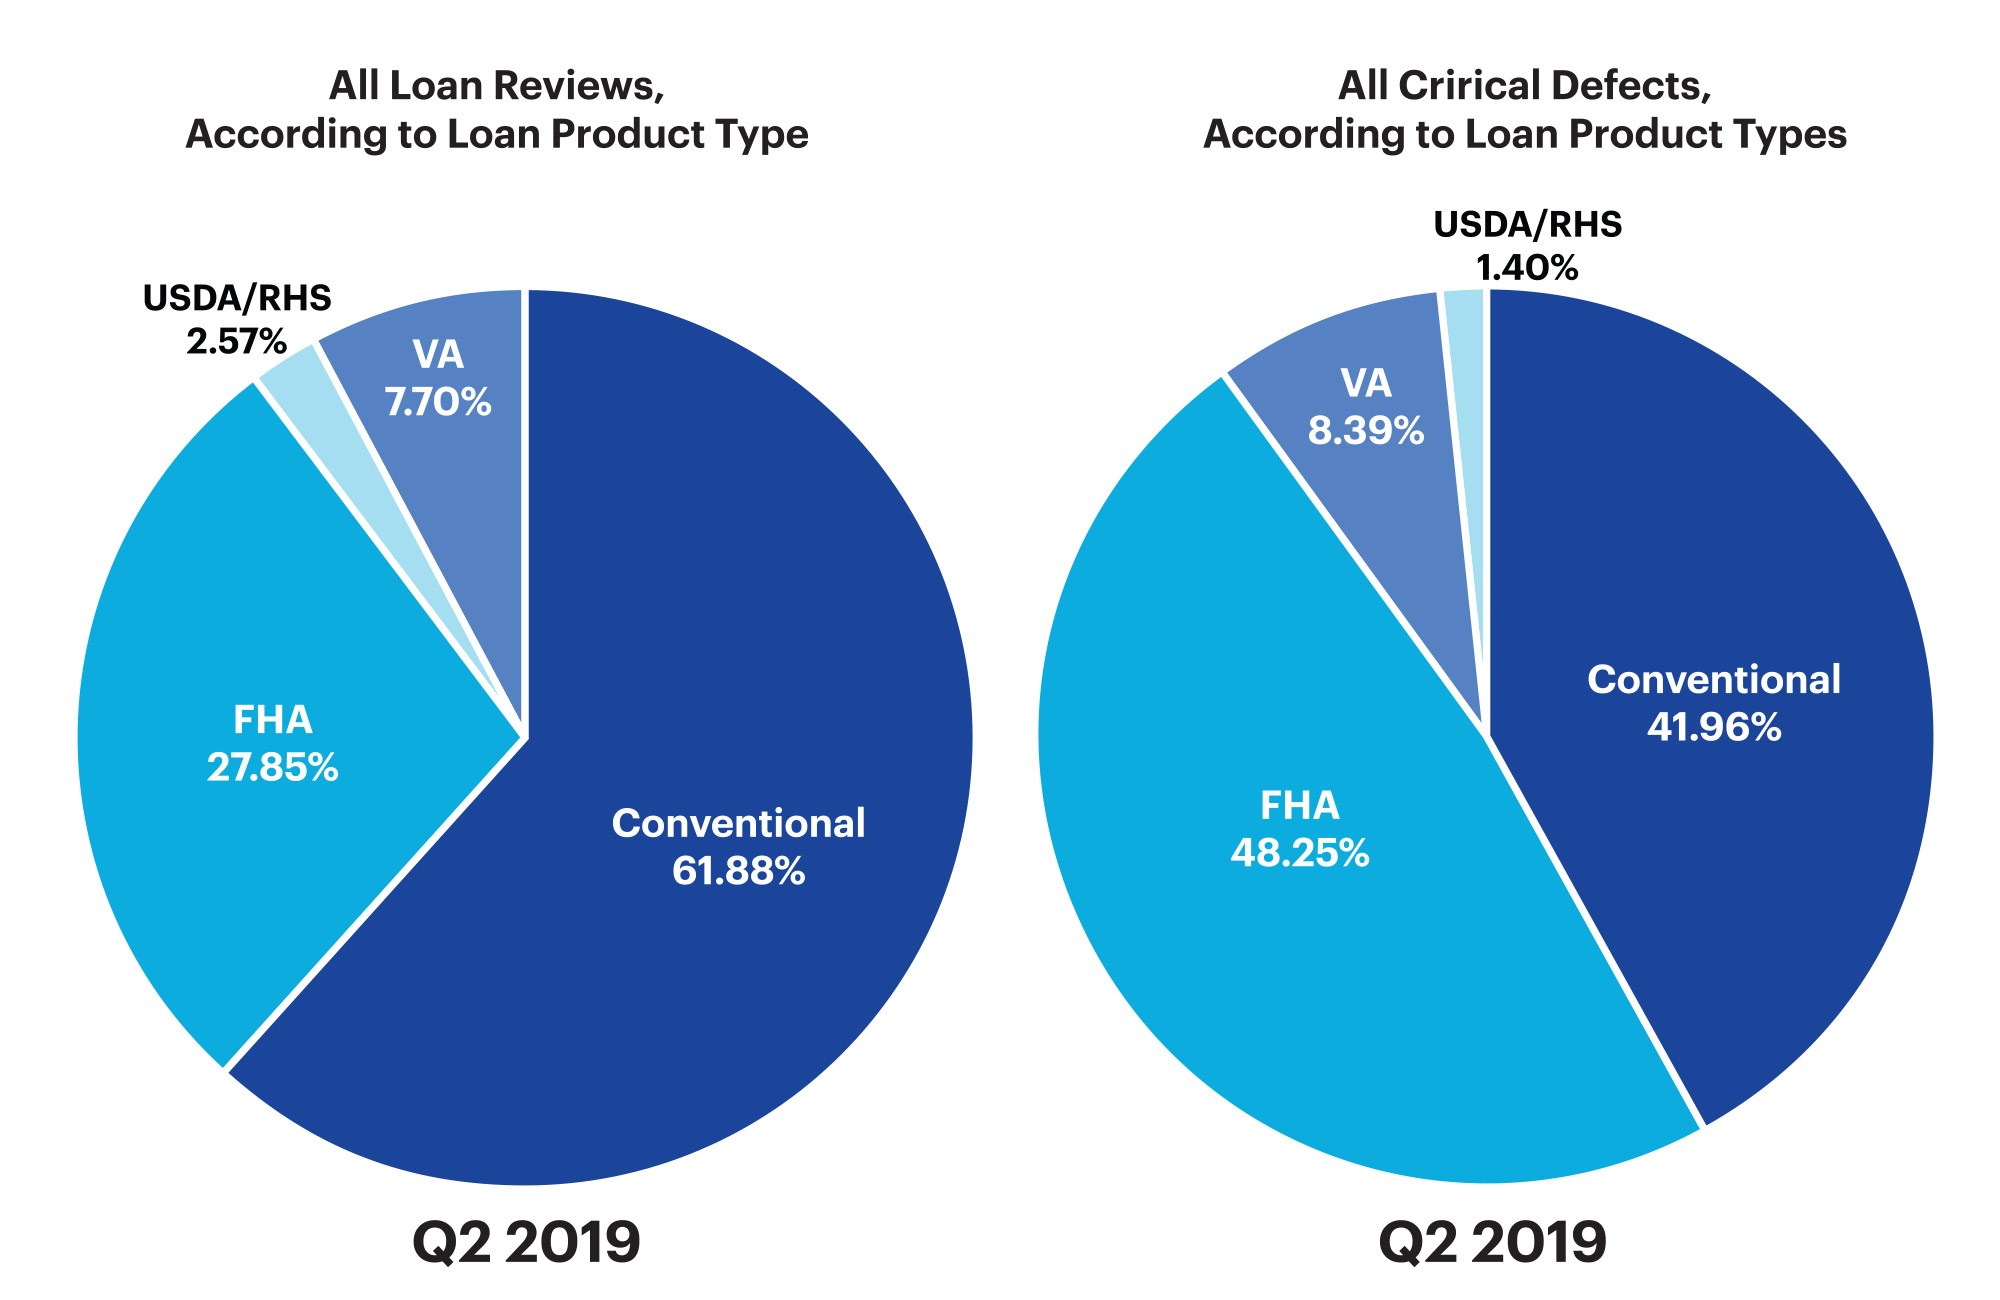
Figure 7: provides a comparison of loan performance among all loan types in the benchmark (conventional, FHA, VA, and USDA).
Conclusion
After four quarters with dramatic swings in volume, loan quality and distribution of defects and two quarters (Q3 2018 and Q4 2018) marked by critical defect rates at a multi-year high, the market continues to moderate with a 10% correction in Q1 2019 and Q2 2019.
MBA’s Quarterly Mortgage Bankers Performance Report showed lender profitability at a three-year high for Q2 2019, with an average gain of $1,675 on each loan originated and a large decrease in production costs1. This finding demonstrates the impact of relatively stable interest rates and strong refinance activity. Refinances drive volume and offer a more predictable manufacturing process with fewer required documents and parties involved in each transaction. This allows lenders to bring scale and efficiency to the process, which in turn leads to better profitability.
The consistency, lower defect rate and increased profitability revealed in Q2 2019 are in stark contrast to previous quarters, where dramatic volume swings brought about the staffing challenges that in turn surfaced in loan quality. Lenders who rely on more manual processes are less equipped to scale and respond to market will therefore find their profit margins and production costs more at the mercy of market conditions.
Based on the data in Q2 2019, particularly in comparison with the preceding quarter and previous 12 months, we anticipate very good market conditions and continued improvement in loan quality for the remainder of 2019.
About the ARMCO Mortgage QC Industry Trends Report
The ARMCO Mortgage QC Industry Trends Report represents a nationwide post-closing quality control analysis using data and findings derived from mortgage lenders utilizing the ACES Analytics benchmarking software.
This report provides an in-depth analysis of residential mortgage critical defects as reported during post-closing quality control audits. Data presented comprises net critical defects and is categorized in accordance with the Fannie Mae loan defect taxonomy.
About ARMCO
Over half of the Top 20 mortgage lenders in the U.S. choose ARMCO as their provider of risk management software. ARMCO’s product line includes loan quality enterprise software, services, data and analytics. Its flagship product, ACES Flexible Audit Technology®, has set the bar for user definability in its category. It is used at virtually every point in the mortgage lifecycle, as well as for a wide range of risk-prone business operations outside traditional mortgage origination and servicing. ARMCO’s consultative approach to customer relationships leverages 25 years of mortgage risk intel, assuring that its clients are using the most effective risk mitigation strategies, and are using the fastest, most reliable, most efficient means for preventing risk-related loss. ARMCO distributes the ARMCO Mortgage QC Industry Trends Report, a free quarterly analysis of industry-wide mortgage loan quality. For more information, visit www.acesquality.com or call 1-800-858-1598.
Learn more
Email us at info@armco.us