ACES’ Mortgage QC Industry Trends Report represents an analysis of nationwide quality control findings based on data derived from the ACES Quality Management & Control Software.
Executive Summary
QC Industry Trends – Overview
QC Industry Trends – by Category
QC Industry Trends – by Loan Purpose
QC Industry Trends – by Loan Type
Early Payment Defaults
Conclusion
About this Report
Executive Summary
This report represents an analysis of post-closing quality control data derived from loan files analyzed by the ACES Quality Management and Control® benchmarking system during the second quarter of 2020 (Q2 2020) and incorporates data from prior quarters and/or calendar years where applicable.
Findings for the Q2 2020 Trends Report were based on post-closing quality control data from over 90,000 unique loans. All reviews and defect data that were evaluated for this report were based on loan audits selected by lenders for full file reviews.
Defects are categorized using the Fannie Mae loan defect taxonomy. Data analysis for any given quarter does not begin until 90 days after the end of the quarter to allow lenders to complete the post-closing quality control cycle, resulting in a delay between the end of the quarter and publication of the data.
NOTE: A critical defect is defined as a defect that would result in the loan being uninsurable or ineligible for sale. The critical defect rate reflects the percentage of loans reviewed for which at least one critical defect was identified during the post-closing quality control review, and all reported defects are net defects.
Summary of Findings
The COVID-19 global pandemic technically began in Q1 2020, but the totality of its effects on the lending market and the broader economy were not felt until Q2. The critical de- fect results reflect that timing. In this report, we will talk about mortgage volumes, inter- est rates, unemployment rates and trends in origination that all had a push/pull relation- ship to overall critical defect rate.
Report highlights include the following findings:
- The overall critical defect rate of 1.88% is the highest quarterly rate since 2018.
- Defect increase driven primarily by 64% increase in Income/Employment category.
- While defects were down in the overall majority of categories, three of the four key borrower qualification categories saw significant defect rate increases compared to Q1 2020.
- The share of conventional and refinance loans continues to skyrocket.
- Early Payment Defaults (EPD) continued to rise through the end of Q3 2020.
QC Industry Trends – Overview
The overall critical defect rose to 1.88% in Q2 2020, the highest rate since Q4 2018 (1.93%). The Q2 rate is 21% higher than the prior quarter’s rate of 1.56%.
COVID-19 is ubiquitous, and its impacts can be so overwhelming that even in Q2 2020, where nearly all of the macroeconomic indicators were positive, defect rates spiked more than 20%. Interest rates have an outsized impact on lending volume, and a drop in rates is highly correlated to historical improvements in the critical defect rate. According to Freddie Mac’s Primary Mortgage Market Survey®, the average rate on a 30-year fixed rate mortgage in Q2 was 3.29%1 a marked decrease from the Q1 2020 average of 3.55%. In fact, the average rate hit an all-time low several different times in Q2. Remember that the average 30-year fixed rate in 2019 was 4.4% so Q2 was more than a full percentage point lower. These low rates typically drive refinances and have the effect of making homes cheaper from a debt maintenance standpoint. Low rates also tend to make conventional loans more attractive than alternatives, and the share of refinances and conventional loans historically leads to improvements in the overall defect rate.
So what happened in Q2 2020? Put simply, COVID-19. Using February as the benchmark, U.S. companies and governments employed roughly 152 million people. That same number, according to the Bureau of Labor Statistics, was 130 million people at the end of April – a decline of 22 million jobs driven by shutdowns and similar COVID-derived restrictions. The number of unemployed Americans recovered slightly by the end of Q2 at 15 million. The breadth and speed of job losses were simply overwhelming, and the interest rate environment, government injection of stimulus, increasing housing values and other positive macroeconomic factors were simply overwhelmed by COVID.
Critical Defect Rate by Quarter: Q3 2019 – Q2 2020
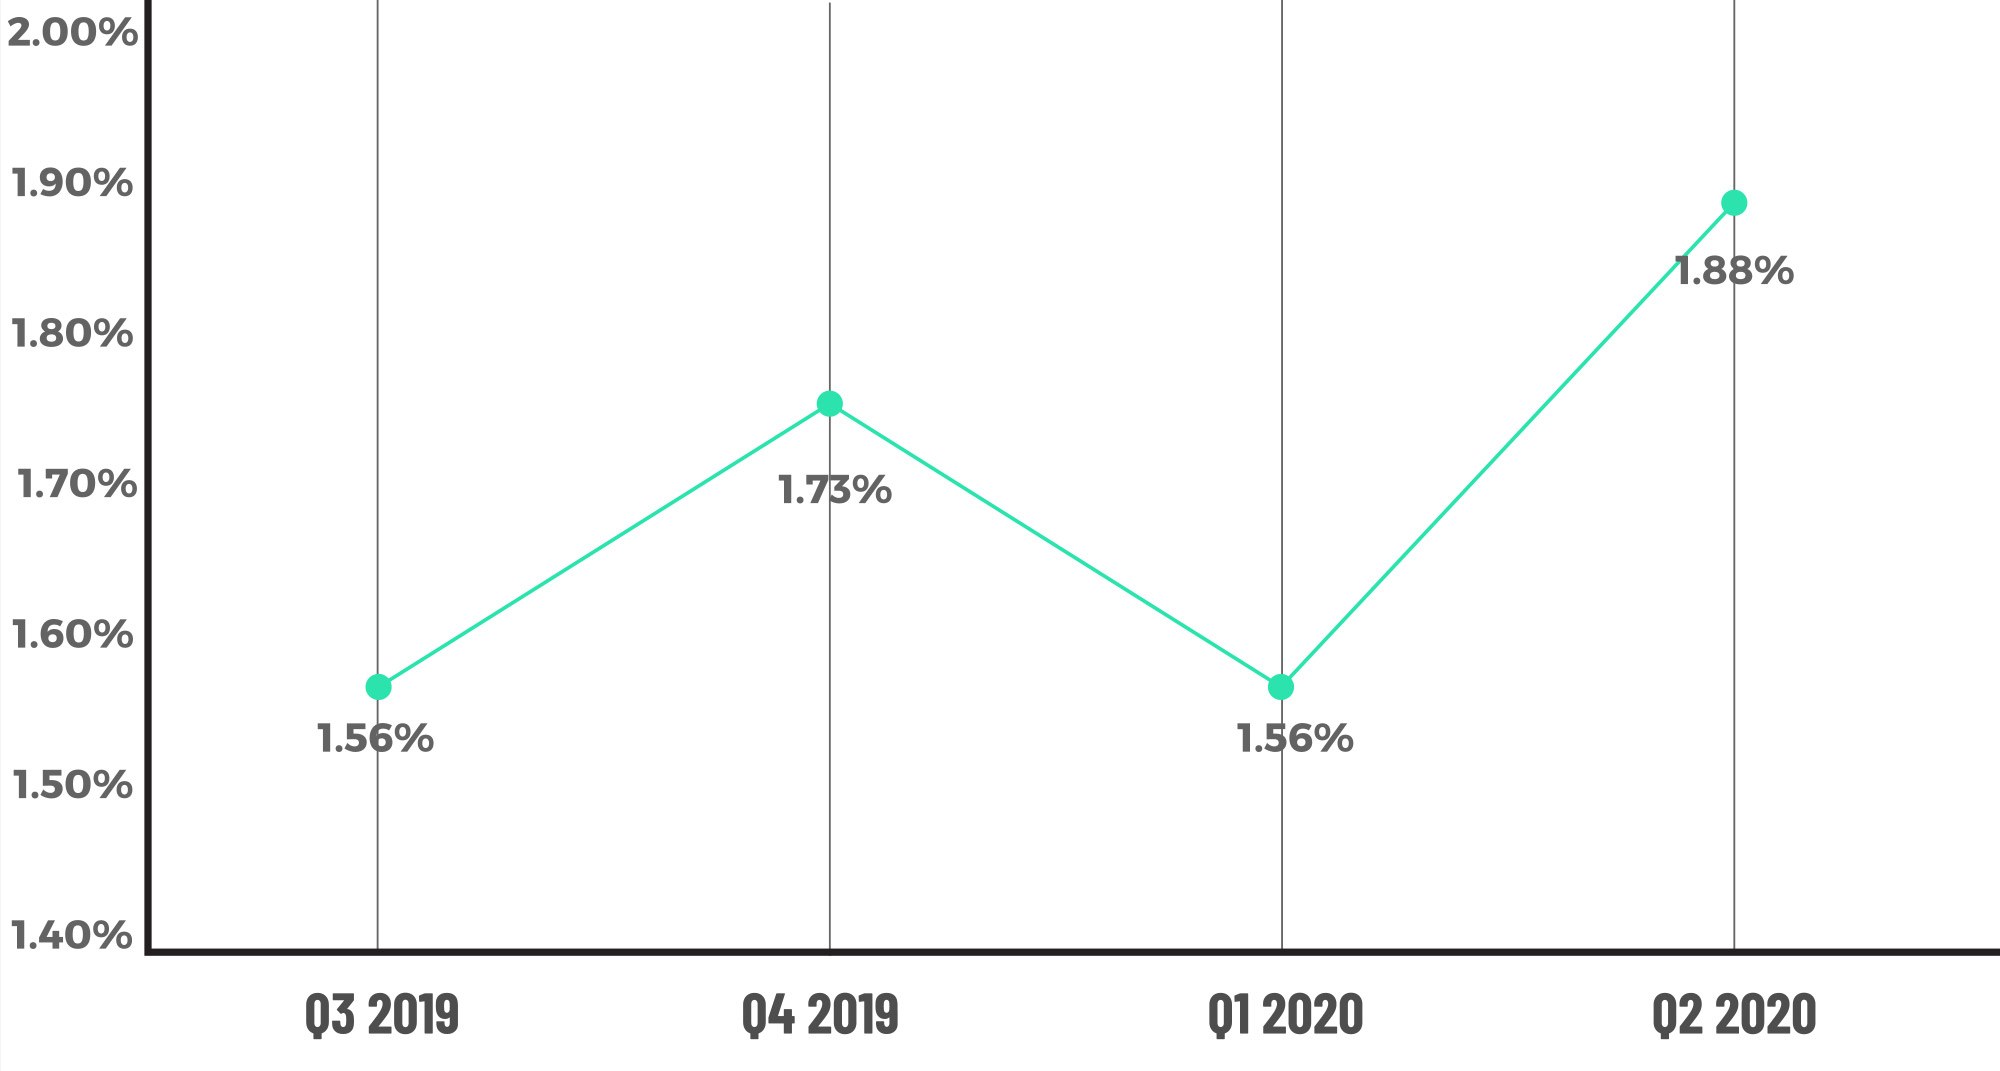
Figure 1 displays critical defect rates by quarter Q3 2019 thru Q2 2020.
QC Industry Trends by Defect Category
It should be no surprise that the Income/Employment category was the primary driver of the increase in the critical defect rate. For Q2 2020, 30.19% of all defects were in the Income/Employment category, up nearly 12% from the prior quarter’s 18.35%. Three of the four key borrower qualification categories (Income, Credit, Assets, and Liabilities) rose from the prior quarter. Defects attributed to the Assets category are 12.26% (up from 10.09%) and the Credit category made up 18.87% (up from 17.43%) of the critical defects in Q2. Liabilities was the only ‘big four’ category that declined, ending the quarter at 3.30% (down from 7.34%).
Overall, defects in seven of the eleven categories declined from the prior quarter. The largest improvement was in the Loan Documentation category, which fell from 16.51% in Q1 to 10.38% in Q2. Appraisal defects also declined between Q1 and Q2 from 5.50% to 4.25%. This can be most likely attributed to the increase in loans with property inspection waivers (PIWs) granted by the Agencies. The Legal and Regulatory Compliance category is typically volatile and increased from 6.42% to 9.43% in Q2. This category should be monitored for future increases given the frequency of executive orders issued by state governors and federal-level changes in the CARES Act and other legislation.
We also took a more granular look at the sub-categories within the ‘big four’ categories that increased this quarter. Issues with documentation (expired and missing) and eligibility in each category are the drivers here. The share of income, credit, and assets defects appear to be COVID-related as well. The Agencies began requiring lenders to verify income and employment, as an example, much closer to the closing date, and in some cases, lenders are re-verifying employment the same day as closing. This adds complexity to an already hurried process, and the difficulty is compounded by most employers being in a work-from-home situation themselves.
Critical Defects by Fannie Mae Category: Q2 2020

Figure 2 displays the dispersion of critical defects across Fannie Mae categories for Q2 2020.
Critical Defects by Fannie Mae Category: Q1 2020 vs. Q2 2020
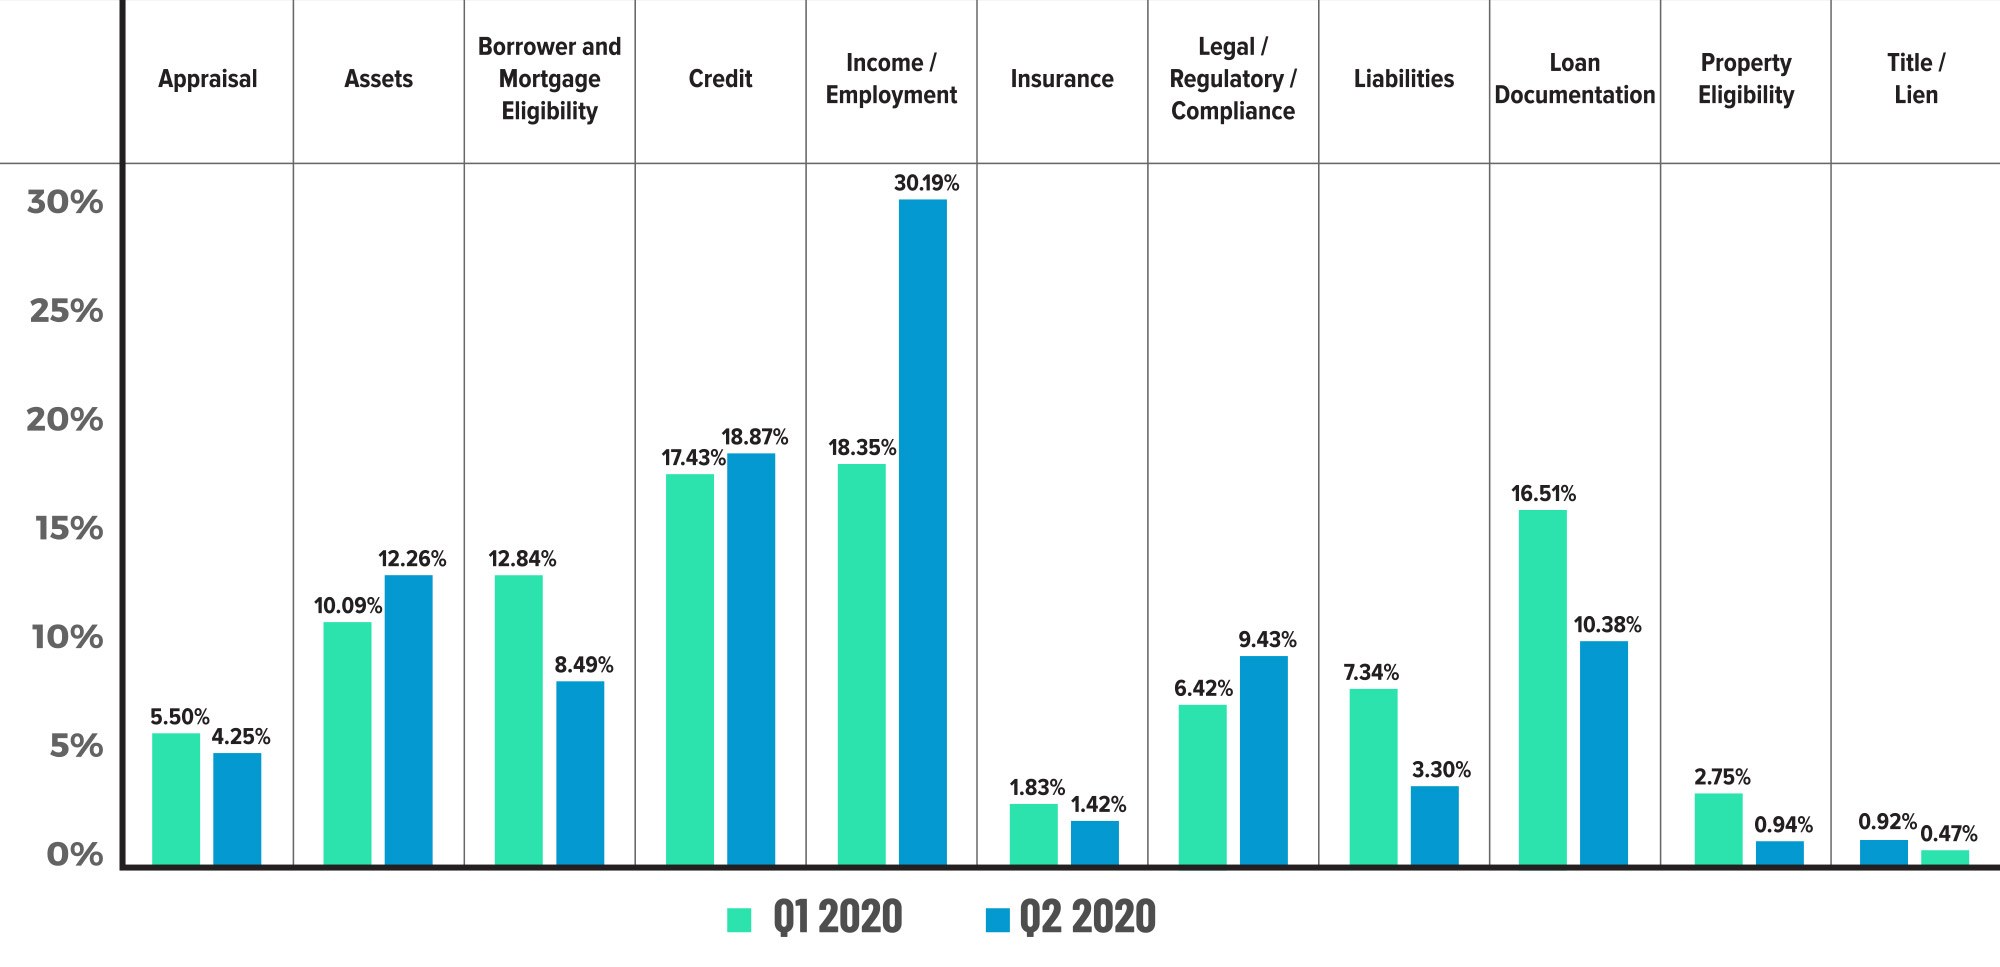
Figure 3 displays the critical defect rate by Fannie Mae category comparing Q2 2020 to Q1 2020.
Fannie Mae Sub-Categories: Q2 2020
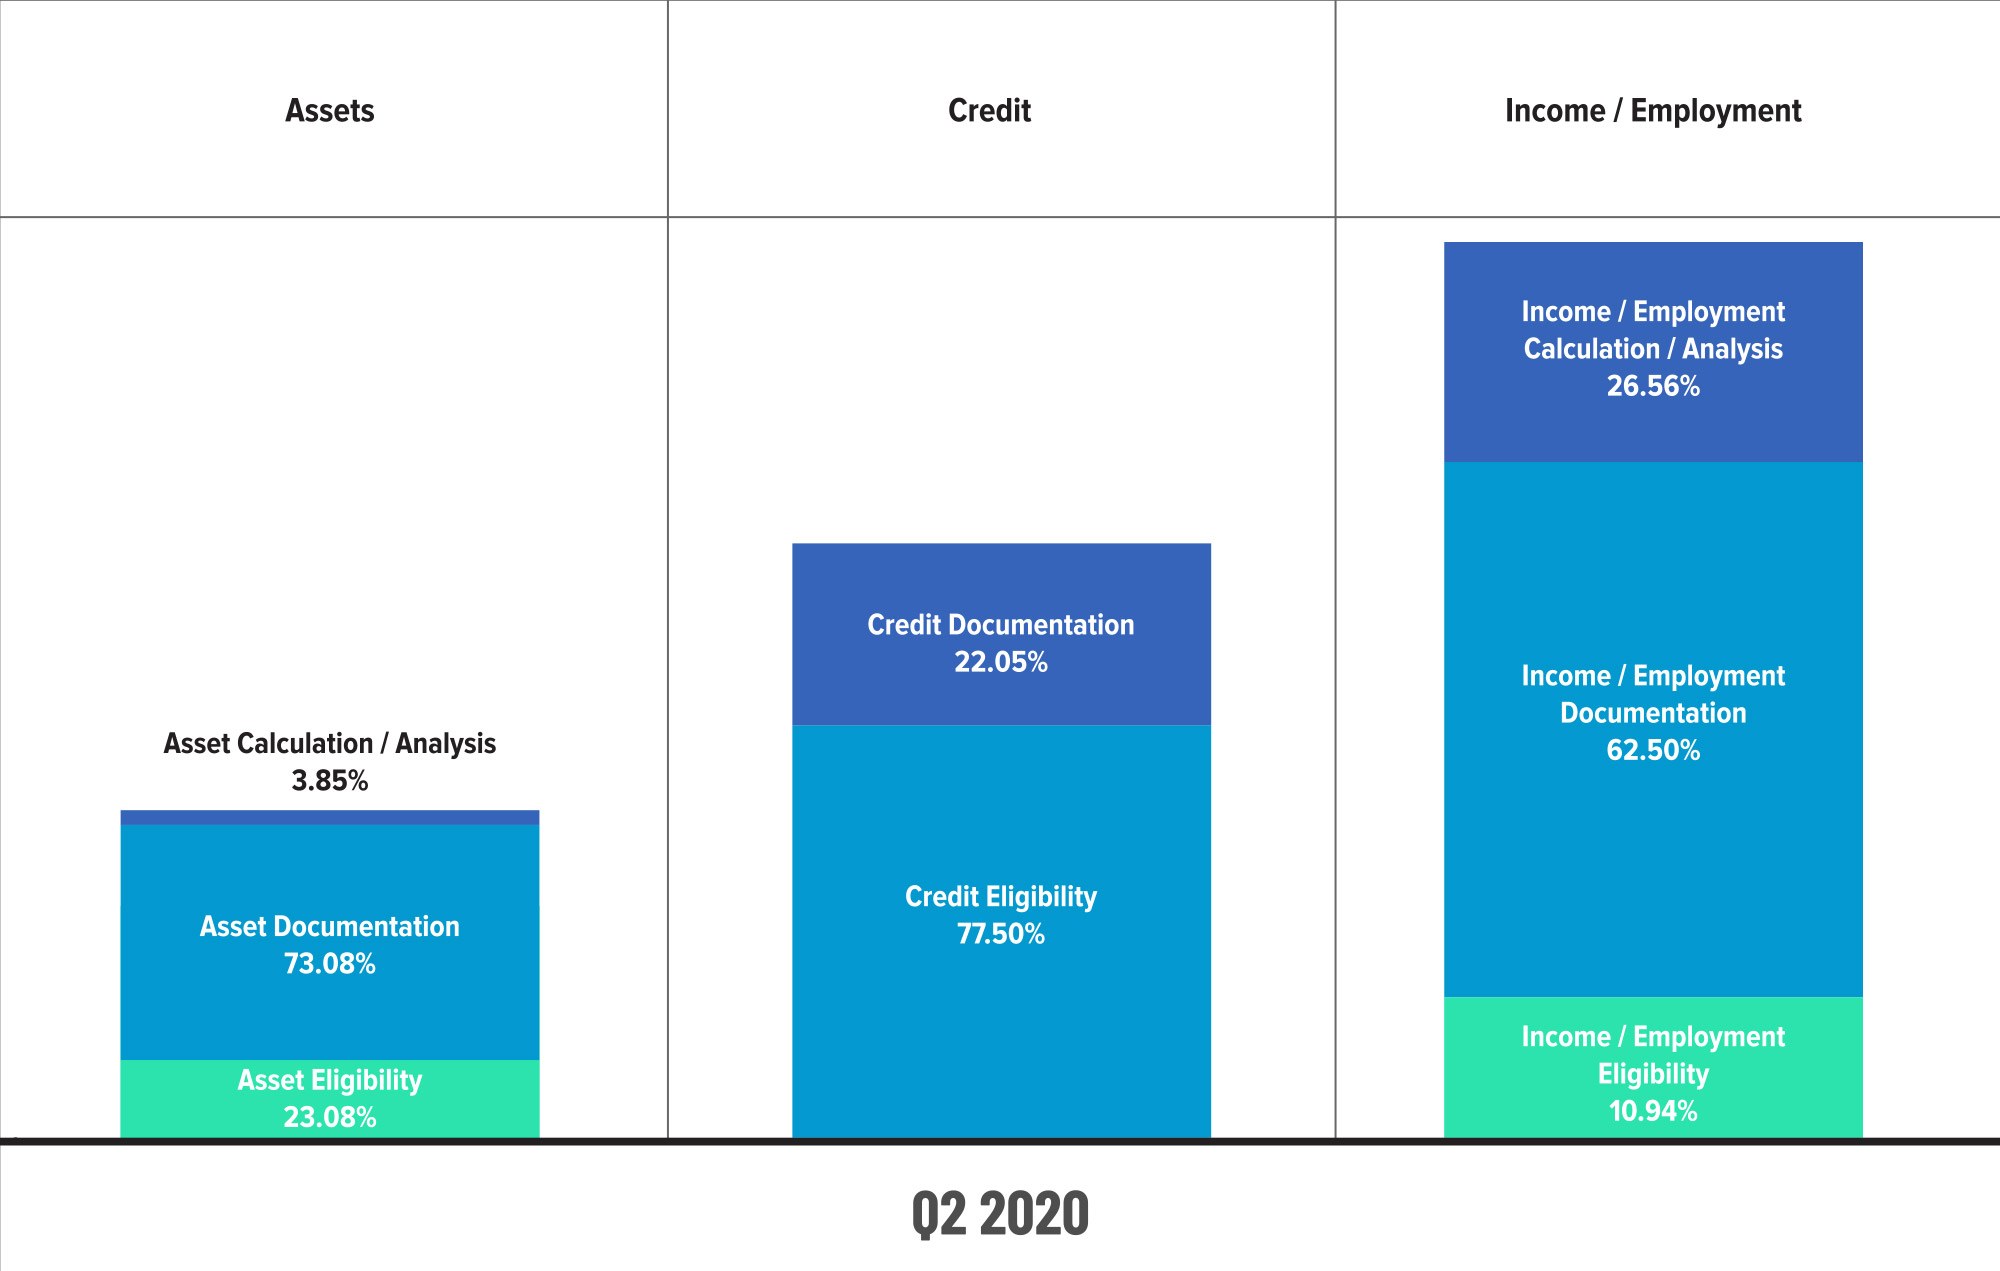
Figure 4 displays the individual Fannie Mae Sub-Category for three of the important Categories.
QC Industry Trends by Loan Purpose
Refinances continued to gain share in Q2 and made up 55.92% of all loans reviewed. This is up from a 51.44% share in Q1. Looking a little further back, the refinance share was 35.39% for calendar year 2019 and 44.6% in Q4 2018, which is considered the unofficial start of the latest refinance boom. Most projections are that interest rates will remain low throughout 2021, and as a result, we expect refinances to maintain a strong share in the overall mortgage market and the ACES dataset.
In Q2 2020, there were no major changes to the percentage of critical defects attributed to either purchases or refinances. The quarter continues the trend of parity between the overall share and the defects attributed by loan purpose. Defects on refinances made up 55.42% of all defects, and purchases made up the remaining 44.56%. Both numbers equal the overall share for refinances and purchases – what ACES’ calls ‘defect parity’.
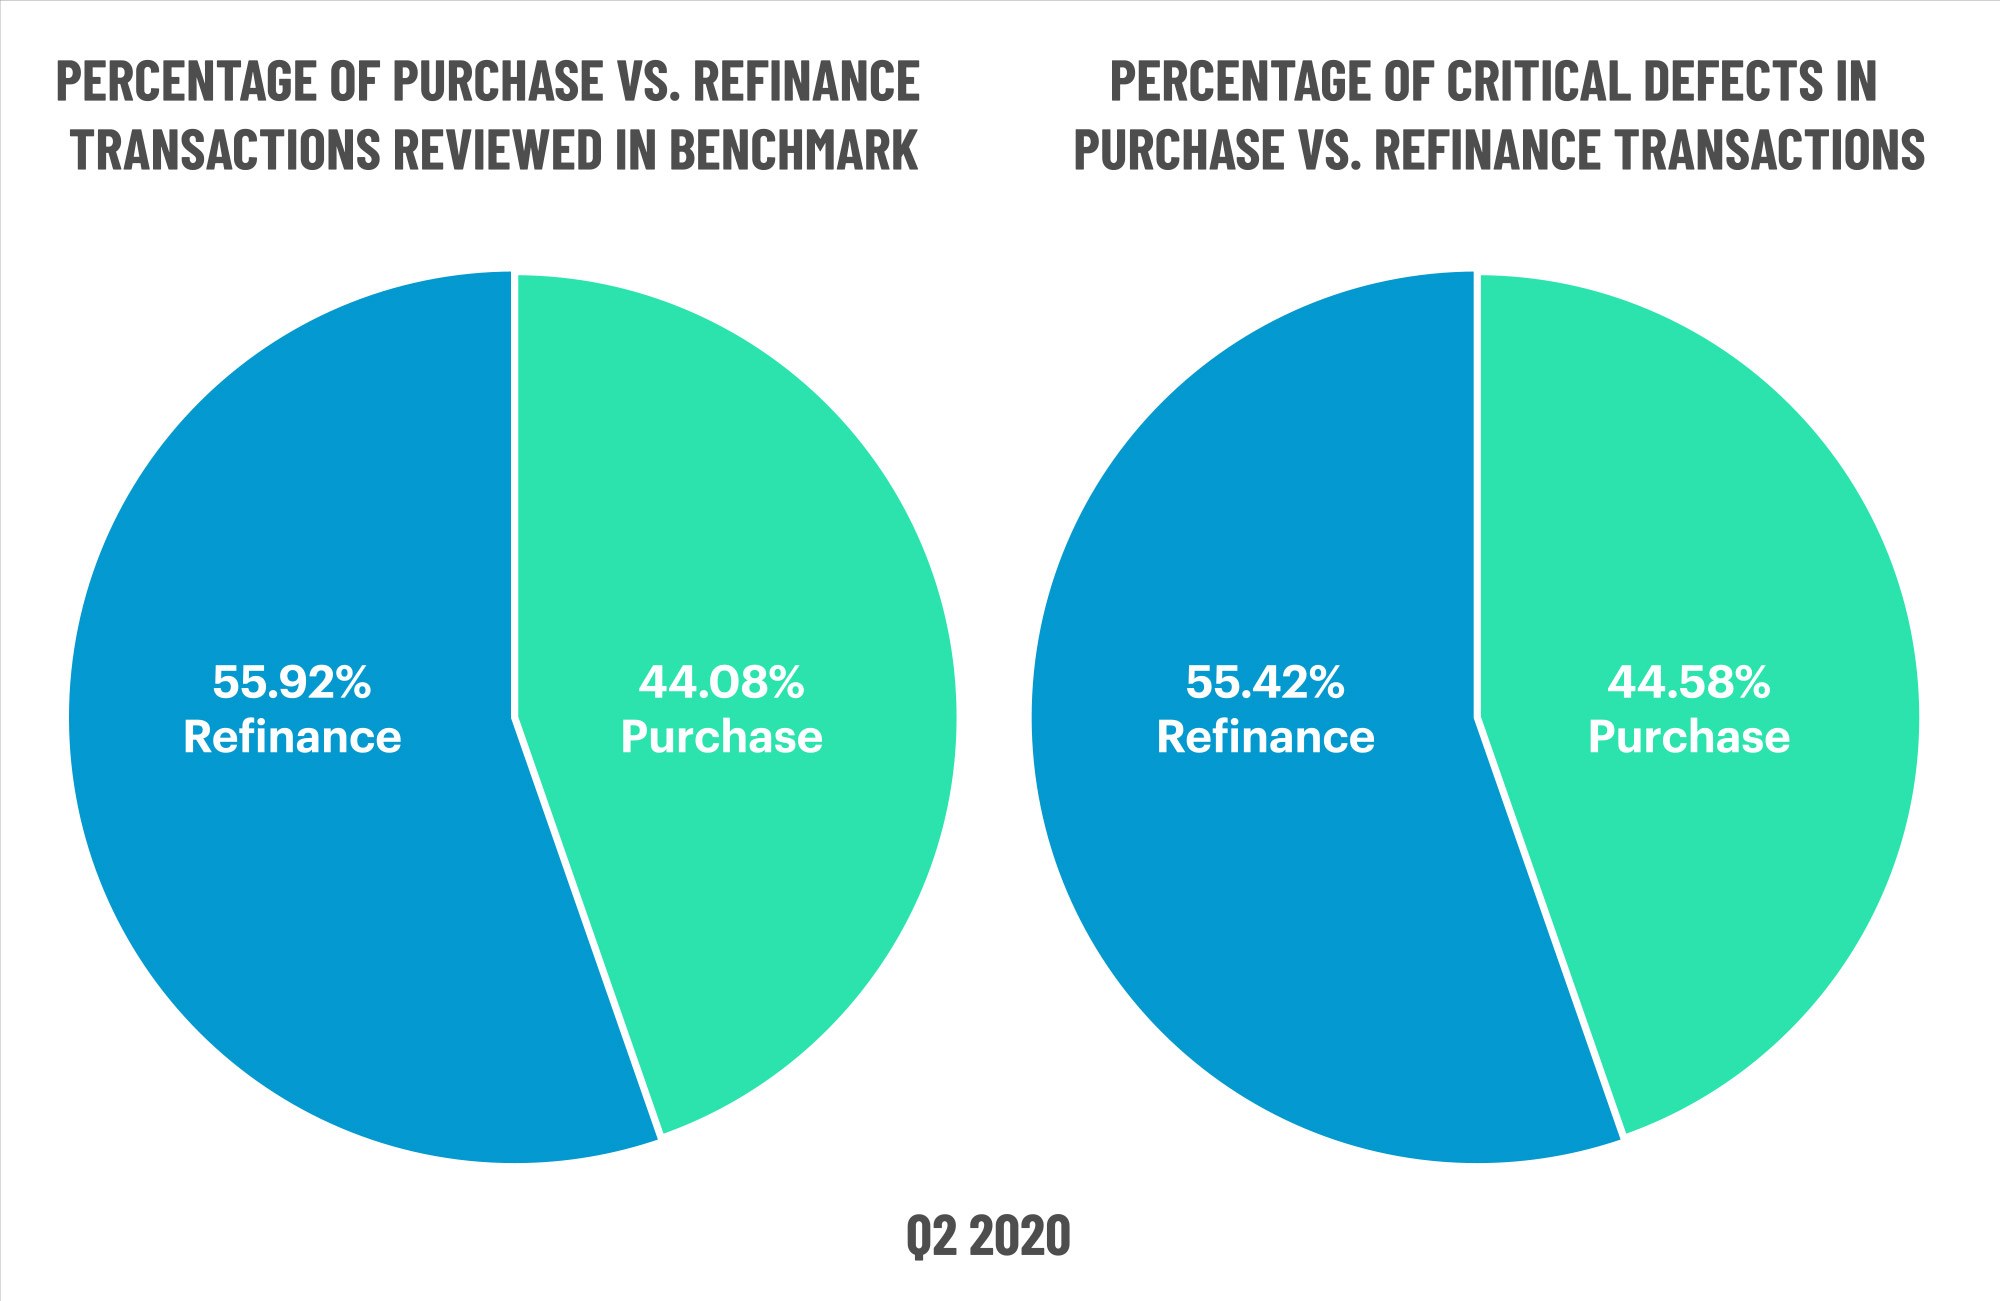
Figure 5 displays the share of transactions by loan purpose compared to the share of critical defects by loan purpose for Q2 2020.
QC Industry Trends by Loan Type
The share of loan type is also important in examining trends in critical defects. Much like the trend in product type, the data here should also mean a favorable effect on the defect rates. The share of conventional loans increased from 64.61% last quarter to 70.51% in Q2 2020. Most of the gain in conventional share came at the expense of FHA, which was down 18.40% compared to 25.66% in the prior quarter. VA and USDA loans increased moderately, with VA rising from 7.22% to 8.13% and USDA from 2.52% to 2.96% in Q2 2020.
Conventional loans also outperformed, with the percent of defects on conventional loans at 67.27% despite making up 70.51% of the population. By comparison, the share and defect makeup were roughly equal in the prior quarter, with conventional loans accounting for 64.61% of loan reviews and 65.66% of the defects. By contrast, FHA loans underperformed in this key metric. For Q2 2020, the share of FHA loans was 18.40%, but those same loans comprised 26.06% of the critical defects. In the current market environment, it is likely that conventional loans will continue to hold an outsize share of total originations, and this can be viewed positively in terms of performance and critical defects. Like with product type, loan type should continue to be a positive lever in the push-pull relationship with unemployment, COVID, and other macro effects.
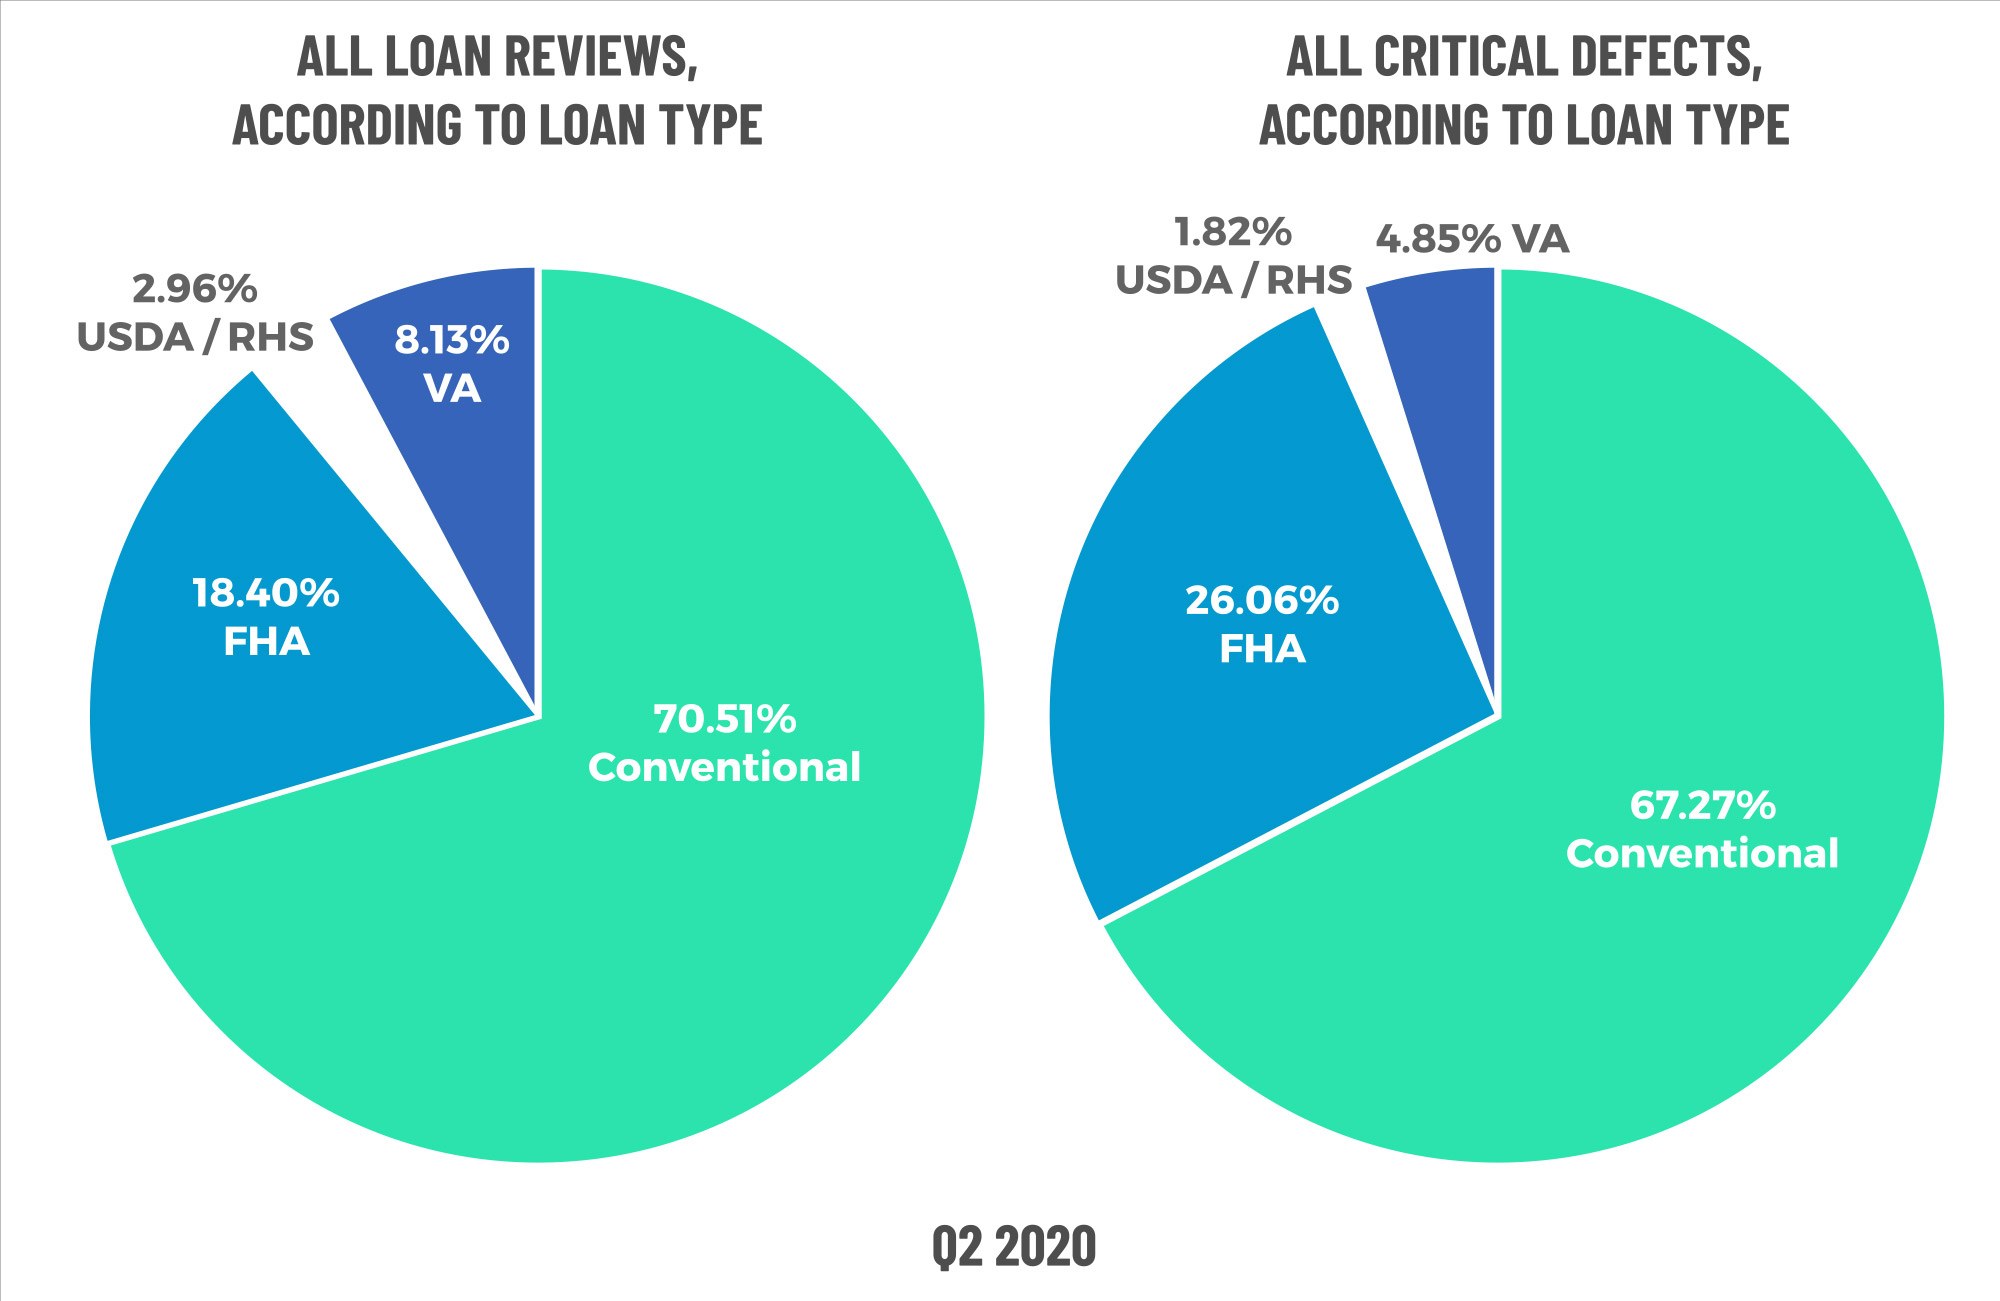
Figure 6 displays the loans reviewed and critical defects by loan type for Q2 2020.
Early Payment Defaults
The number of Early Payment Default (“EPDs”) reviews continued their meteoric rise in the most recently available data. When compared to pre-pandemic levels of 2019, EPDs are up 196.8% through September 2020 following a 138.9% increase in the previous quarter against the pre-pandemic benchmark. It is too early to predict when EPDs will peak, and any continued rise is likely to exacerbate long-term default and loss rates. Even though the economy has gained steam and unemployment rates have moderated, we remain concerned that a significant percentage of borrowers that fall behind (either through forbearance or natural default) will not only be unable to continue making their contractual payment, but will lack the financial means to also pay down any delinquent amount
EPD % Increase
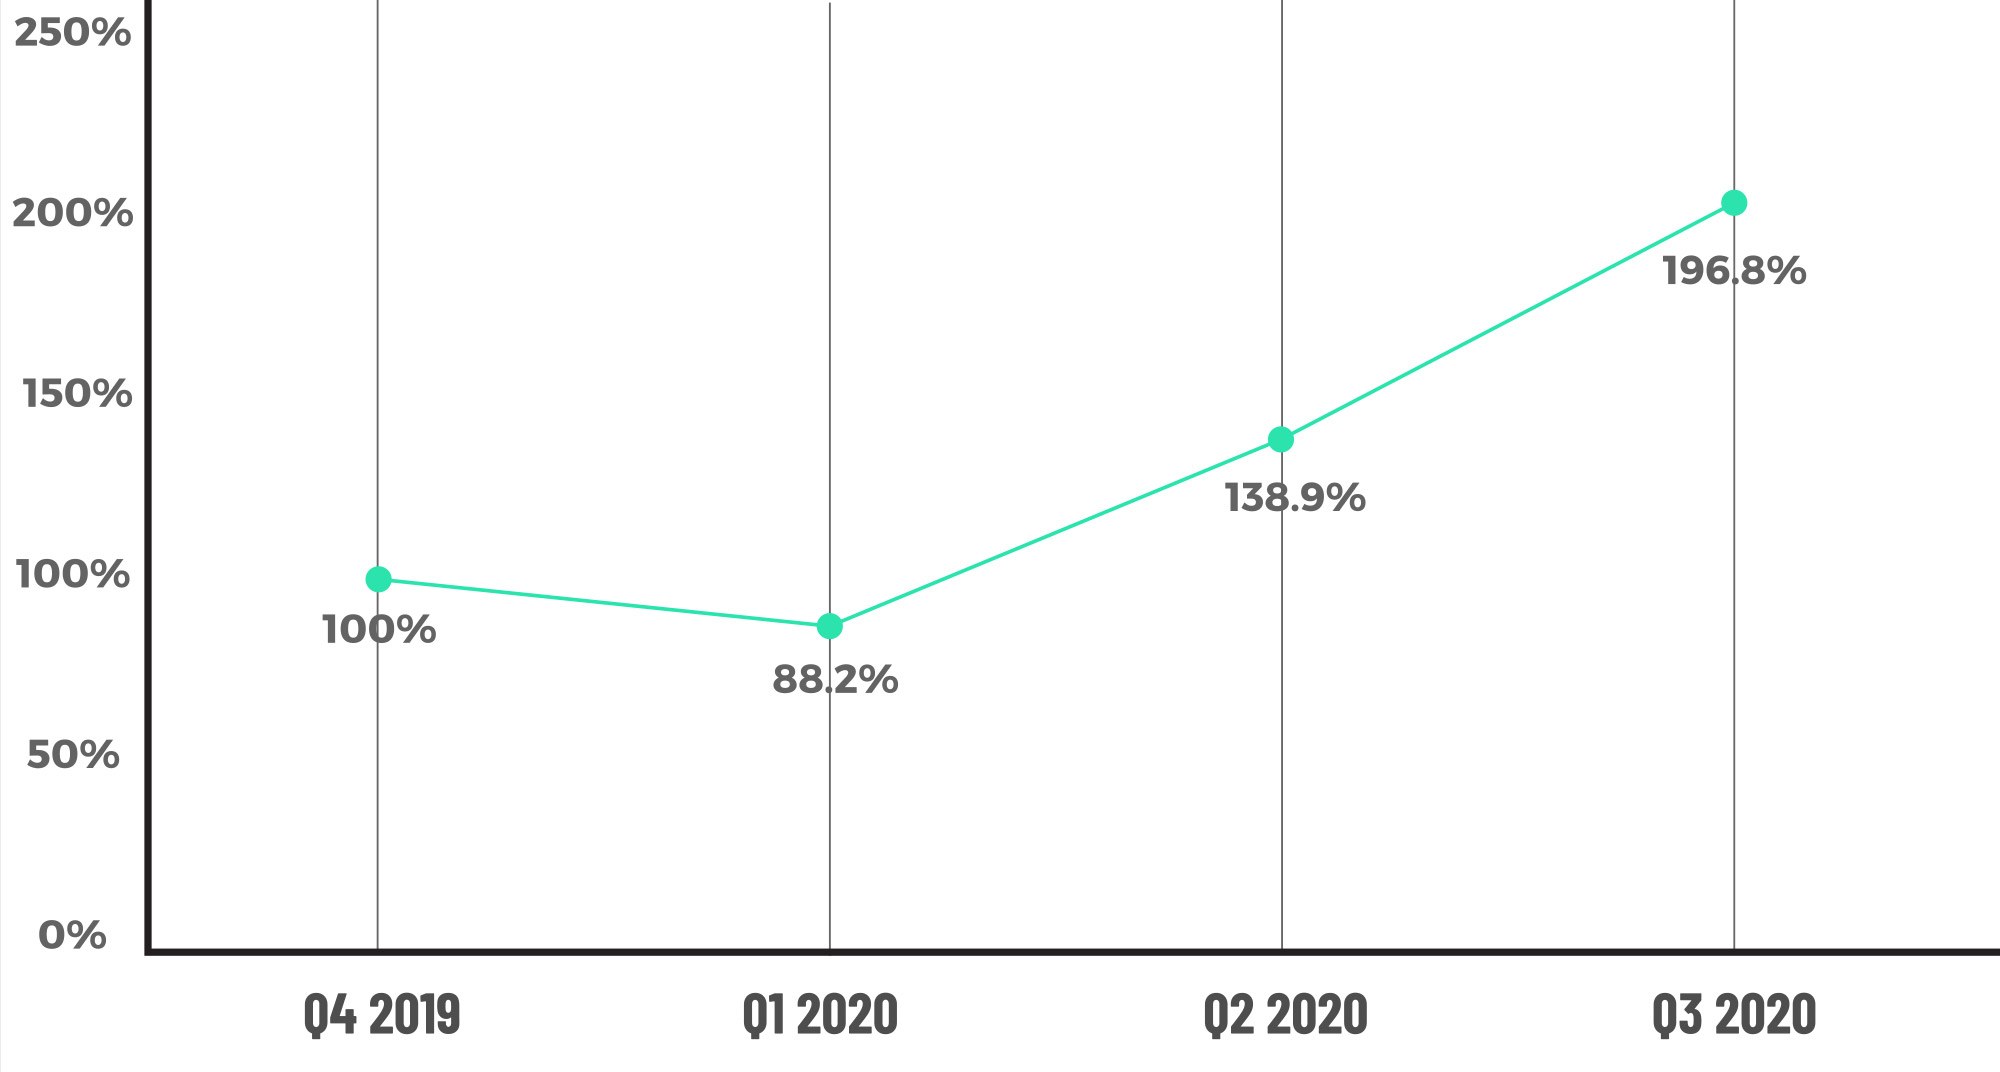
Figure 7 displays the EPD % increase, by quarter, over pre-pandemic levels.
Conclusion
The pandemic is upon us, at least as it relates to critical defect rates in mortgage quality control. We should not be overly surprised by the 21% increase in defect rates, and when factoring in the market positives (interest rates, conventional share, refinance share), it is conceivable that the positive forces are holding up well against overwhelming negative factors. In other words, COVID-19 has so disrupted the economy that the critical defect rate could have, and maybe would have been, worse absent the overall health of the mortgage market.
There are some macro- and micro-environmental issues on the horizon that bear watching. From a micro (mortgage industry-specific) standpoint, the controversial hike in G-fees takes effect in December, which may have an impact on volumes. Also, the pace of COVID-related legislation continues to move rapidly. So far in 2020, ACES has tracked 862 changes that have impacted lending or servicing, and with the incoming administration, more changes could be on the horizon.
On the macro (overall economy) side, there are a number of things happening in December and January that could impact mortgage lending. Unemployment rates are still falling but at a slower pace than recent months. In addition, with the new administration coming in January and many of the government programs designed to aid Americans expiring in December and January, there seems to be a renewed effort in Congress to pass a second economic stimulus/COVID relief package.
In so many respects, the mortgage industry and the world at large remain in a “wait- and-see” mode. We expect higher than normal volatility in the critical defect rate for the remaining quarters of 2020 and into 2021. However, lenders can expect loan volumes to remain high next year thanks to the ongoing low-interest rate environment, and with the increase in volume, loan quality should remain a top priority in 2021.
About the ACES Mortgage QC Industry Trends Report
The ACES Mortgage QC Industry Trends Report represents a nationwide post-closing quality control analysis using data and findings derived from mortgage lenders utilizing the ACES Quality Management & Control Software.
This report provides an in-depth analysis of residential mortgage critical defects as reported during post-closing quality control audits. Data presented comprises net critical defects and is categorized in accordance with the Fannie Mae loan defect taxonomy.
About ACES
ACES Quality Management, formerly known as ACES Risk Management (ARMCO), is the leading provider of enterprise quality management and control software for the financial services industry. The nation’s most prominent lenders, servicers and financial institutions rely on ACES Quality Management & Control® Software to improve audit throughput and quality while controlling costs, including:
- 3 of the top 5 and more than 50% of the top 50 independent mortgage lenders;
- 7 of the top 10 loan servicers;
- 11 of the top 30 banks; and
- 1 of the top 3 credit unions in the USA.
Unlike other quality control platforms, only ACES delivers Flexible Audit Technology, which gives independent mortgage lenders and financial institutions the ability to easily manage and customize ACES to meet their business needs without having to rely on IT or other outside resources. Using a customer-centric approach, ACES clients get responsive support and access to our experts to maximize their investment.
For more information, visit www.acesquality.com or call 1-800-858-1598.
Media Contact: Lindsey Neal | DepthPR for ACES | (404) 549-9282 | lindsey@depthpr.com
1. http://www.freddiemac.com/pmms/
View all reports