ACES’ Mortgage QC Industry Trends Report represents an analysis of nationwide quality control findings based on data derived from the ACES Quality Management & Control Software.
Executive Summary
QC Industry Trends – Overview
QC Industry Trends – by Category
QC Industry Trends – by Loan Purpose
QC Industry Trends – by Loan Type
Early Payment Defaults
Conclusion
About this Report
Executive Summary
This report represents an analysis of post-closing quality control data derived from loan files analyzed by the ACES Quality Management and Control® benchmarking system during the second quarter of 2021 (Q2 2021) and incorporates data from prior quarters and/or calendar years, where applicable.
Findings for the Q2 2021 Trends Report were based on post-closing quality control data from approximately 100,000 unique records. All reviews and defect data that were evaluated for this report were based on loan audits selected by lenders for full file reviews.
Defects are categorized using the Fannie Mae loan defect taxonomy. Data analysis for any given quarter does not begin until 90-days after the end of the quarter to allow lenders to complete the post-closing quality control cycle, resulting in a delay between the end of the quarter and publication of the data.
NOTE: A critical defect is defined as a defect that would result in the loan being uninsurable or ineligible for sale. The critical defect rate reflects the percentage of loans reviewed for which at least one critical defect was identified during the post-closing quality control review, and all reported defects are net defects.
Summary of Findings
The negatives outweighed the positives in Q2 2021, with the overall critical defect rate climbing to 2.27%. While still not as high as 2.34% seen in Q3 2020, it’s important to note that the industry is in a period of transition, and the critical defect rate is likely to remain volatile for several more quarters. The move out of a refinance market and into a purchase market is starting to manifest, and that impacts defect rates as well. Last quarter, we identified falling margins, eviction moratorium uncertainty and rising inflation as the macroeconomic events that stood to have an impact on mortgage lending and, by extension, loan quality. In this quarter’s report, we will share some of those metrics and talk about their impact on critical defect rates.
Report highlights include the following findings:
- The multi-quarter trend of improvement in the critical defect rates was reversed in Q2 2021, with the rate increasing 13% to 2.27%.
- The Income/Employment category continues to lead all categories for critical defects and reached its highest rate since ACES started publishing this report in 2016.
- Defect data shows improvement in some of the core underwriting categories as well as in the manufacturing-related categories, which is most likely driven by more predictable and stable volumes.
- Review metrics show the transition from a refinance market to a purchase market crossed a key threshold in this quarter.
- Conventional loans dominate in share, and defect performance improved.
- The Early Payment Defaults (“EPDs”) trend line indicates that reviews peaked and are now below pre-pandemic levels. The focus should now shift to the remaining loans in forbearance status and exit plans for those borrowers.
QC Industry Trends – Overview
The critical defect tide changed quickly in Q2 2021, and after two straight quarters of decline, the defect rate moved upward to 2.27%. That is a rise of 13% from the prior quarter’s defect rate of 2.01%.
Interest rates were slightly higher in Q2 2021, with the 30-year fixed-rate mortgage averaging 3.00%1 compared to Q1’s average of 2.88%. The comparison is a bit misleading, however, because rates began to climb in late January from the 2.65% range and ended Q1 at 3.17%. When viewed in that context, rates fell a bit in Q2 2021 from the end of Q1 2021 and were still, by most measures, historically low. We also saw low volatility in rates compared to recent quarters, with rates in Q2 2021 ranging between 2.93% and 3.18%. When compared to Q1 2021’s range of .52% (3.17% and 2.65%), Q2’s range of 0.25% coupled with slightly higher overall interest rates held volumes relatively steady.
Research from Attom Data Solutions2 shows that 3.78 million residential mortgages were originated in Q2 2021. That is down a modest 3% from Q1 2021, meaning that Q2 2021 is the first time in six quarters that residential lending volumes were lower than the prior quarter. From a year-over-year comparison, volume was up 29% from the same quarter in 2020, which is not entirely surprising given all types of lending plummeted (the “COVID Quarter”) during the initial havoc of the pandemic that resulted in a large swath of the economy being shuttered for much of Q2 2020. Volumes stabilizing should allow the production groups within lenders to catch their breath, and although that did not positively affect defect rates in Q2 2021, it does bring some amount of optimism for improving rates in the quarters ahead.
Other economic measurements were positive for Q2 2021 as well. The unemployment rate continued to decline, having ended the quarter at 5.9%. That is nearly a third of the pandemic peak of 14.8% in Q2 2020. The unemployment rate stood at 4.6% (as of Oct. 31, 2021). It is clear that the worst of the unemployment problems are behind us, yet many employers are now faced with worker shortages. If there is a downside to these positive numbers, it’s that the economy recovered so rapidly that inflation is now a primary concern. The real danger for our industry is that inflation could cause monetary policy to shift in a way that causes interest rates to rise. That impacts mortgage volumes, potentially, but could also have downstream effects on delinquencies, property appreciation and other factors that have kept a lot of risk out of mortgage lending.
1 http://www.freddiemac.com/pmms/
Critical Defect Rate by Quarter: Q3 2020 – Q2 2021
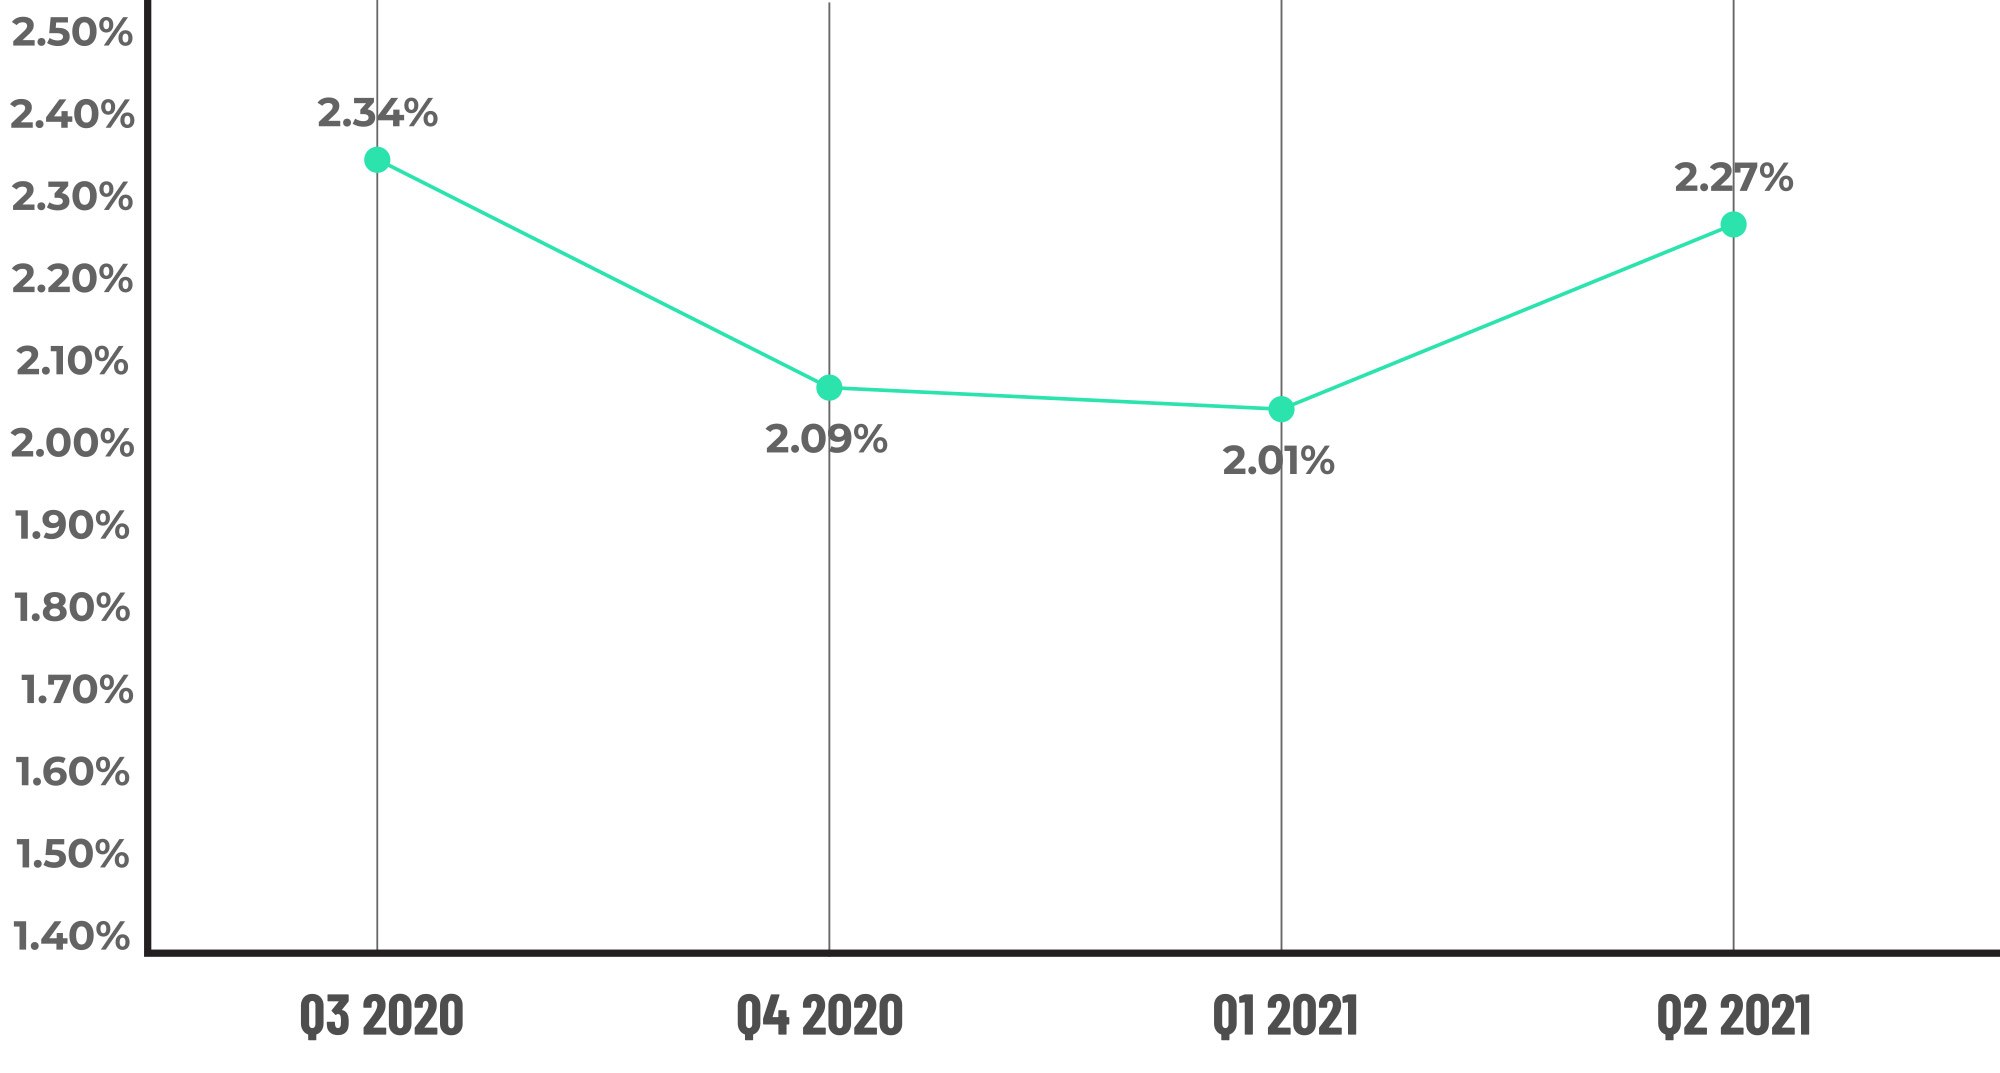
Figure 1 displays the percentage of loans with critical defects by quarter, for Q3 2020 through Q2 2021.
QC Industry Trends by Defect Category
As with recent quarters, defects are being driven by the Income/Employment category. In Q2 2021, that category made up 32.08% of all defects, which is an increase from the prior quarter’s 31.44% and is now the highest since ACES began tracking defects by category. Income/Employment defects spiked to 30.19% in Q2 2020 because of the pandemic and quickly corrected in Q3 2020 (20.98%) and Q4 2020 (23.77%), but in the two quarters since then, that trend has reversed.
The data was better in two of the other core underwriting categories — Assets and Credit. The Assets category made up 10% of all critical defects, down from 12.37% in the prior quarter. The Credit category saw a similar decline, with a 7.50% defect share in Q2 2021, down from last quarter’s 12.89%. The last core underwriting category, Liabilities, nearly doubled in defect share to 6.67% this quarter compared to 3.09% in Q1 2021.
Defects in the Appraisal category also more than doubled to 5.42% in this quarter from 2.58% in Q1 2021. Although this still represents a very small fraction of the overall defects observed in Q2, any increase in this category gives us pause given the market environment in the appraisal area. Appraisal issues in this market are well documented, with most of the concern centered around rising appraisal costs, long turnaround times and a shortage of qualified appraisers. Property appreciation is still very strong, but the appraisal process becomes more important in a purchase-driven market. Rising defects in the Appraisal category indicate lenders should increase their risk and quality control efforts in this area.
Elsewhere, defects in the Regulatory Compliance and Loan Documentation categories saw very modest increases in defect share. Compliance defects rose to 10.83% from 9.28% in the prior quarter, and Documentation defects rose to 12.50% in Q2 2021 from 12.37% in Q1. We expect defect share in these manufacturing-related categories to remain stable or improve in future quarters as volume pressures make the loan origination process more predictable overall.
Critical Defects by Fannie Mae Category: Q2 2021
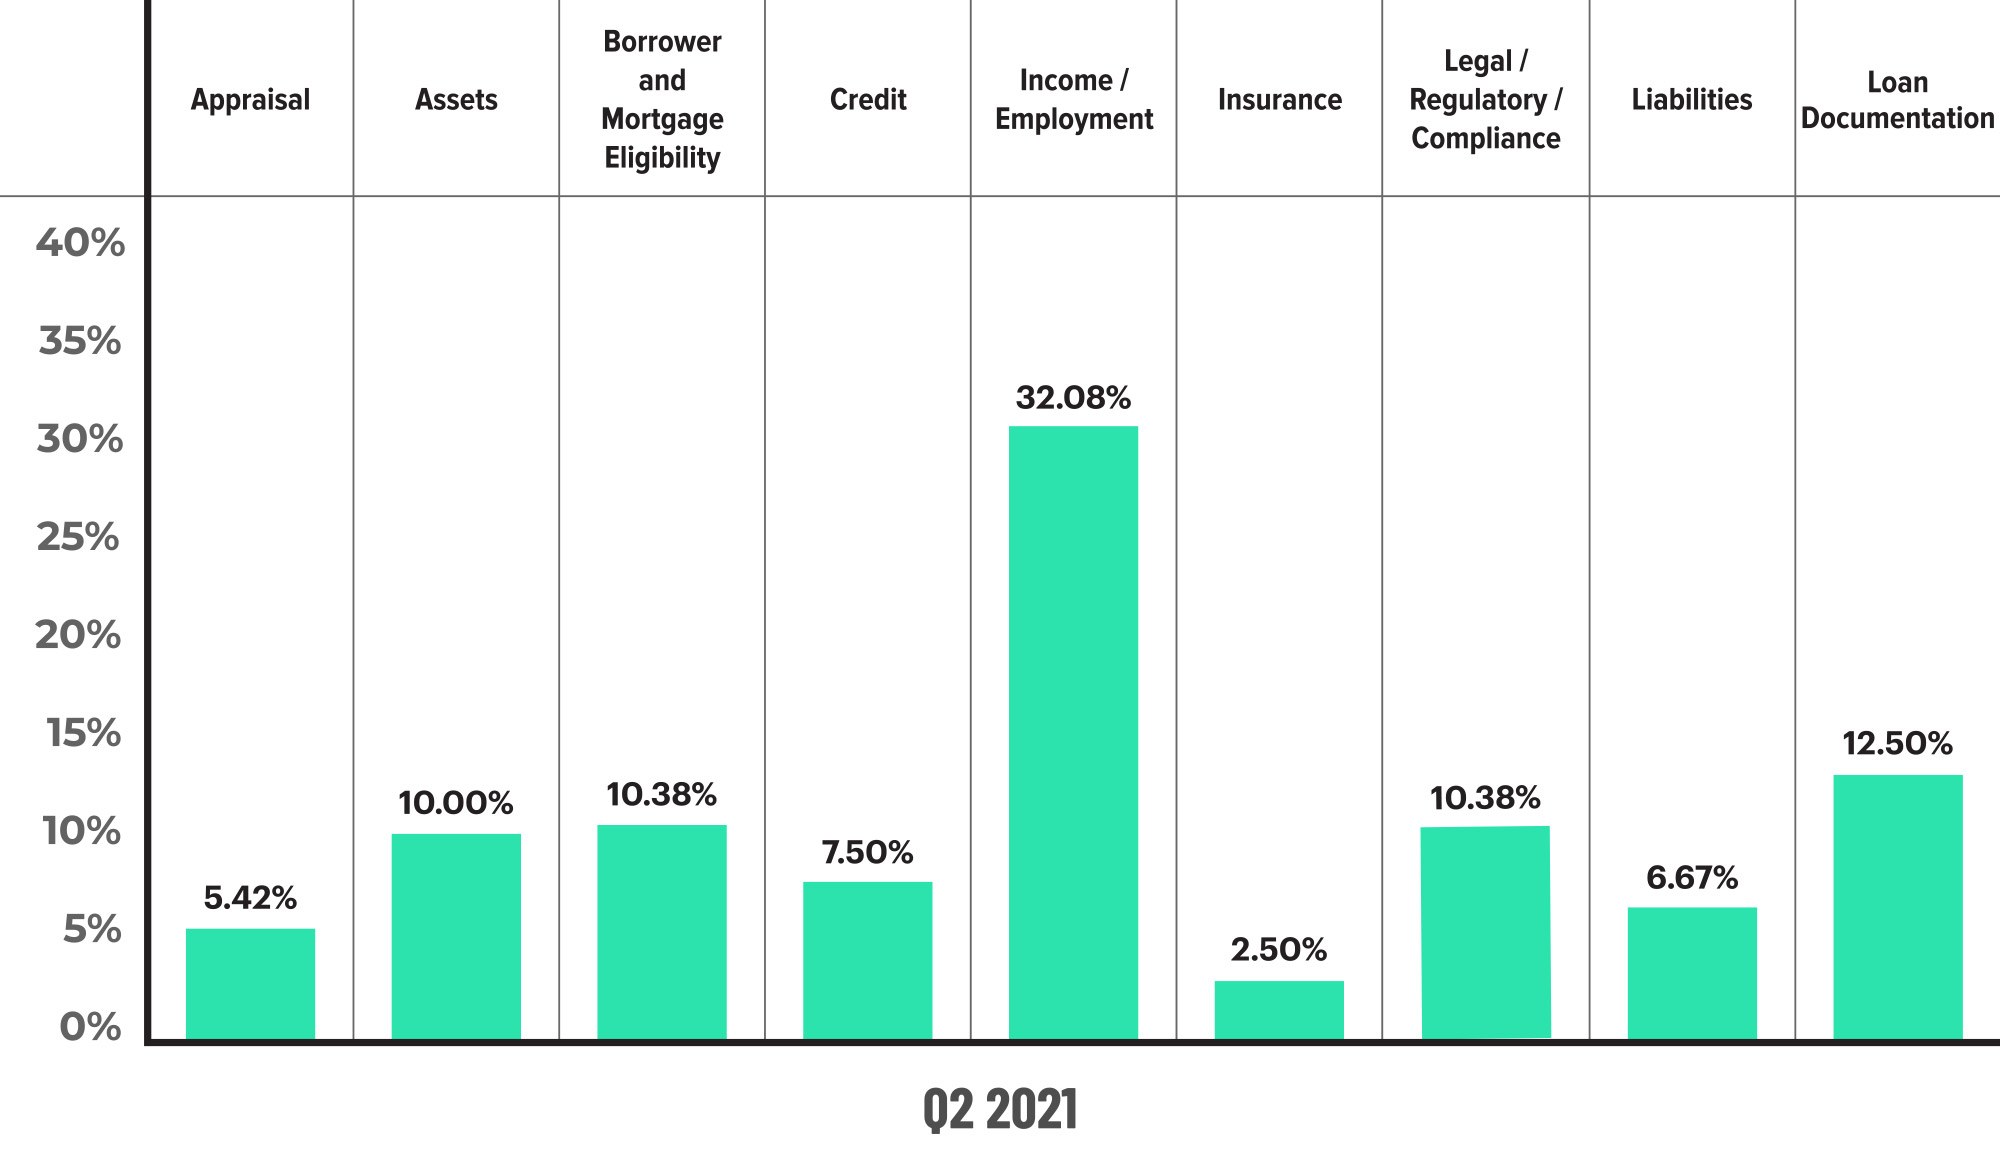
Figure 2 displays the dispersion of critical defects across Fannie Mae categories for Q2 2021.
Critical Defects by Fannie Mae Category: Q1 2021 vs. Q2 2021
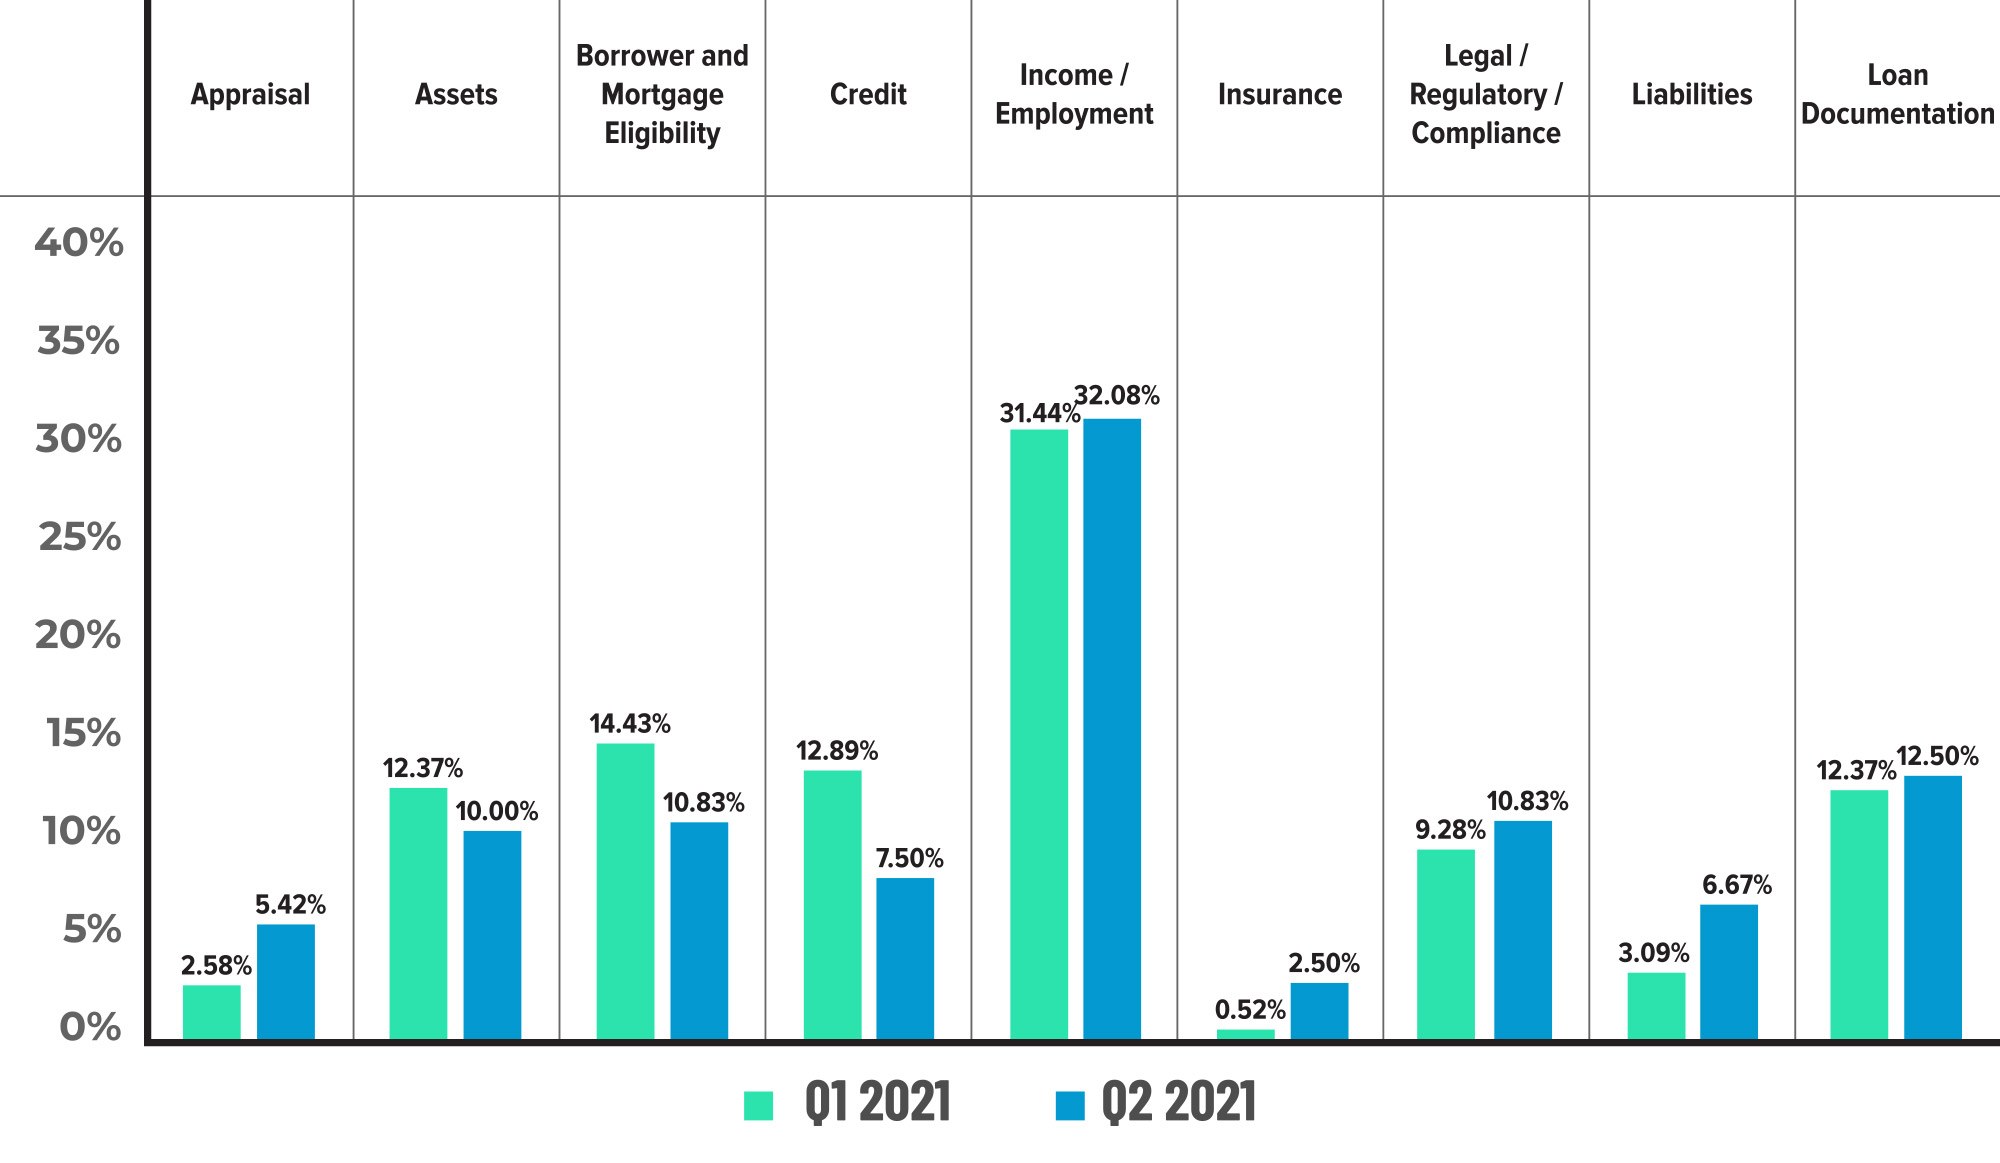
Figure 3 displays the critical defect rate by Fannie Mae category comparing Q1 2021 to Q2 2021.
Critical Defects by Fannie Mae Sub-Category: Q2 2021

Figure 4 shows the defects by Fannie Mae sub-categories within selected categories, for Q2 2021.
QC Industry Trends by Loan Purpose
The Loan Purpose data for Q2 2021 is a strong indication that the refinance boom is coming to an end. For the quarter, refinances made up 43.19% of all reviews, with purchases accounting for the remaining 56.81%. These numbers reflect a sharp change from Q1 2021 when refinances were 58.56% (15% higher than the current quarter). The ACES data is derived from sampling and, therefore, will differ from overall industry data as lenders will weight different loan characteristics, including purchases as a loan type, when selecting their review samples. While industry data shows that refinances in the overall market for Q2 2021 still exceeded purchases, both sets of data indicate that it is only a matter of time before purchase share overtakes refinances.
Refinance performance eroded in this most recent quarter, accounting for 46.07% of all defects versus 43.19% of all reviews. That compares to the prior quarter where refinances made up 58.56% of the reviews and had a defect share of 49.66%. On the purchase side, the share of reviews was 56.81%, and the same reviews made up 53.92% of the defects. With purchases rising as a share of overall originations, having the defect share lower than the review share is a positive sign.
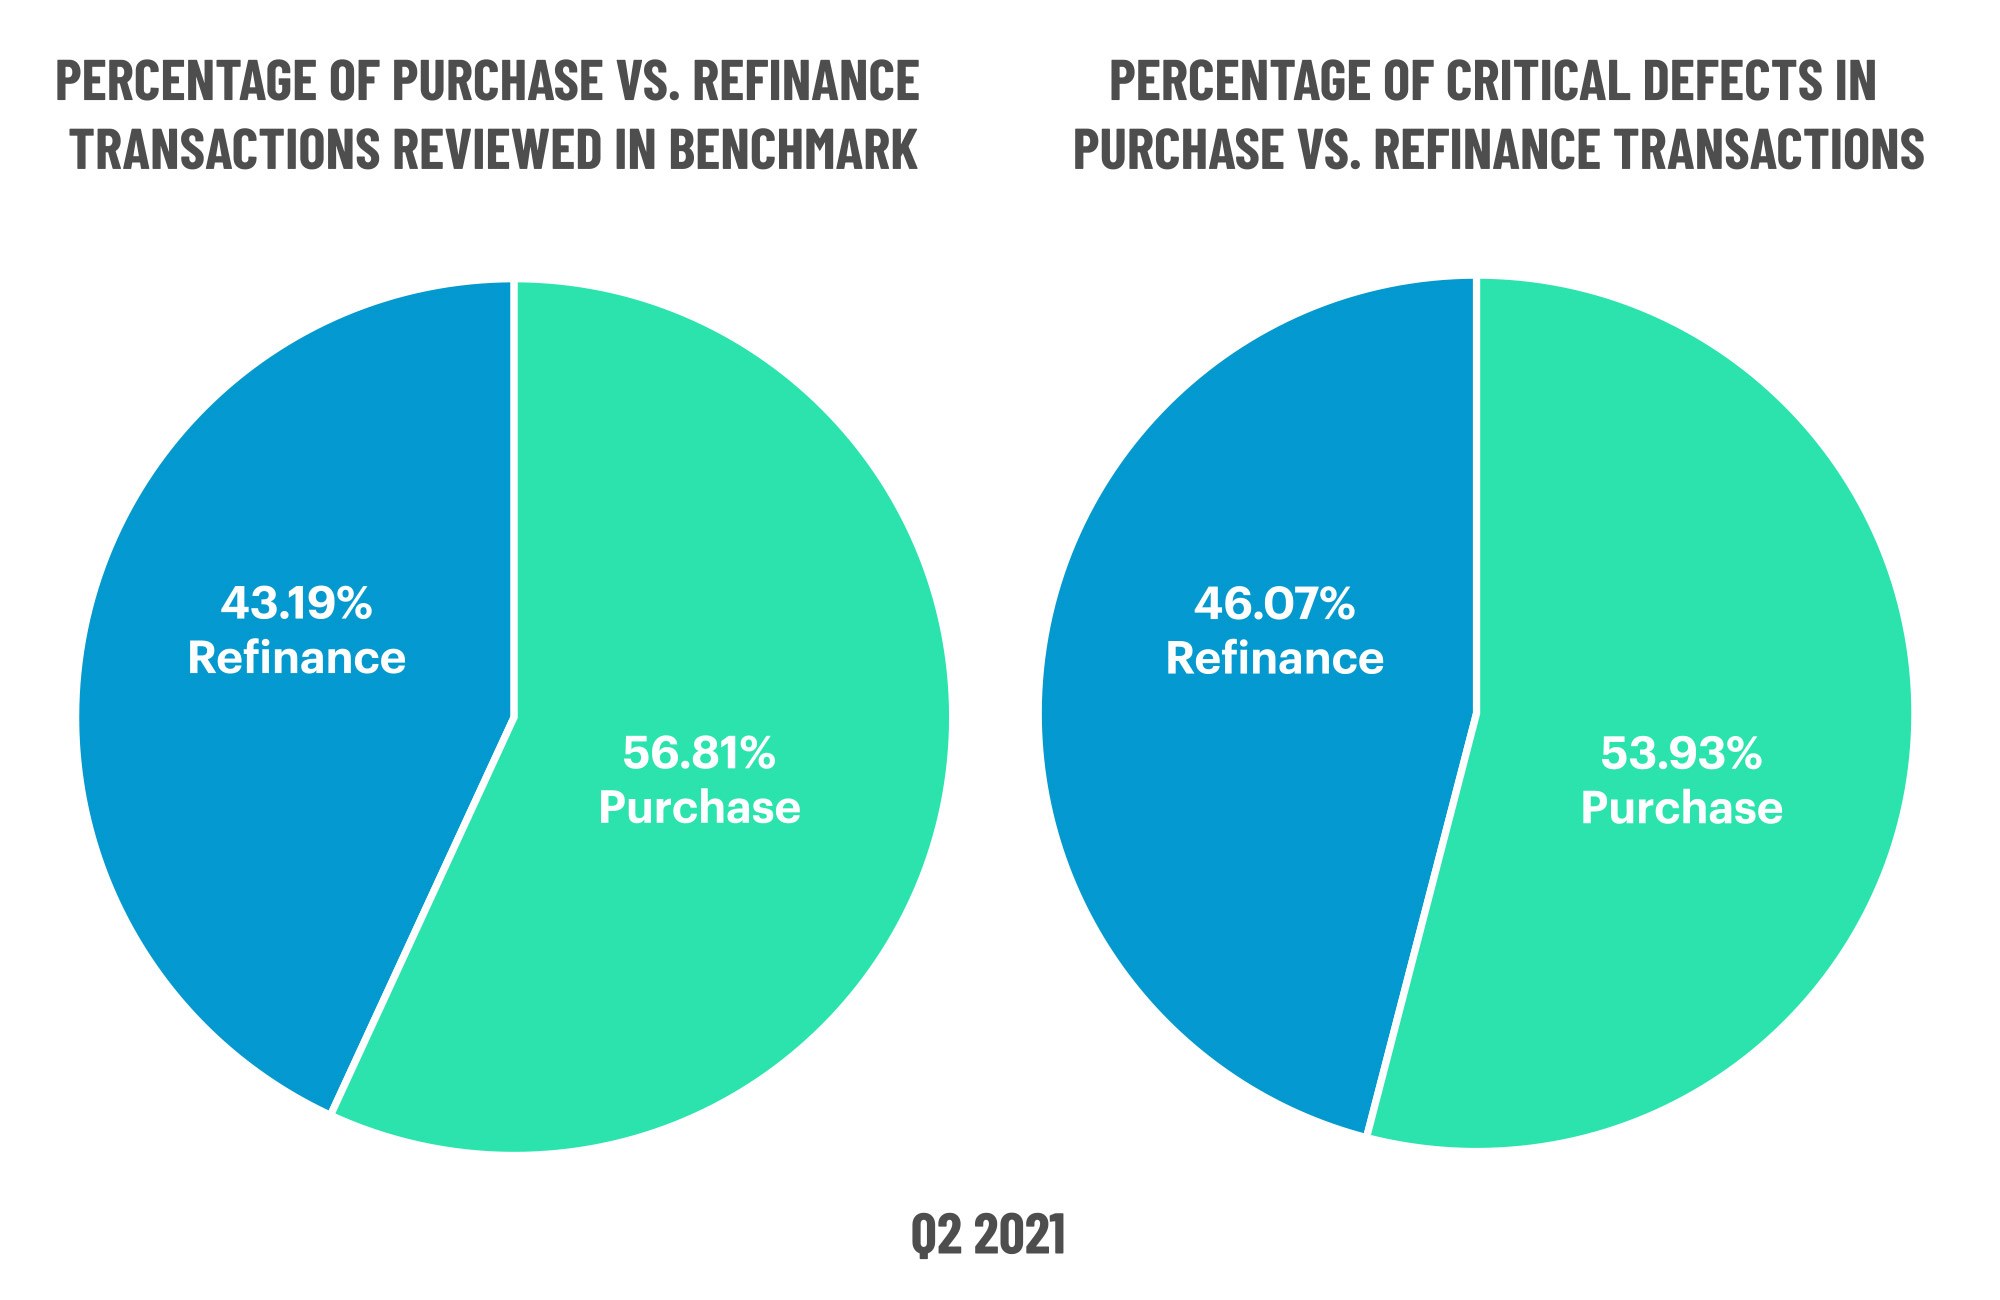
Figure 5 displays the loans reviewed and critical defects by loan purpose for Q2 2021.
QC Industry Trends by Loan Type
The mix of loan product types remained steady in Q2 2021. Conventional loans dominated review share again for the second straight quarter at 70.53% (70.50% last quarter). FHA loans fell slightly from 21.93% in Q1 2021 to 19.44% in Q2 2021, whereas VA loans increased from 3.14% last quarter to 7.10%. USDA share saw a modest increase, ending Q2 2021 at 2.94% from last quarter’s 2.62%.
Defects on conventional loans improved slightly in Q2 2021 and made up 72.25% of all defects for the quarter. This compares to a defect share of 74.50% last quarter, a 2.25% improvement. FHA defects reverted to a larger share (as compared to review share) in the quarter, comprising 21.99% of all defects against a review share of 19.44%. Only slight changes in defects for VA and USDA lending were observed this quarter, with VA having a defect share of 3.14% (4.70% last quarter) and USDA defect was 2.62% (flat against last quarter’s 2.68%).
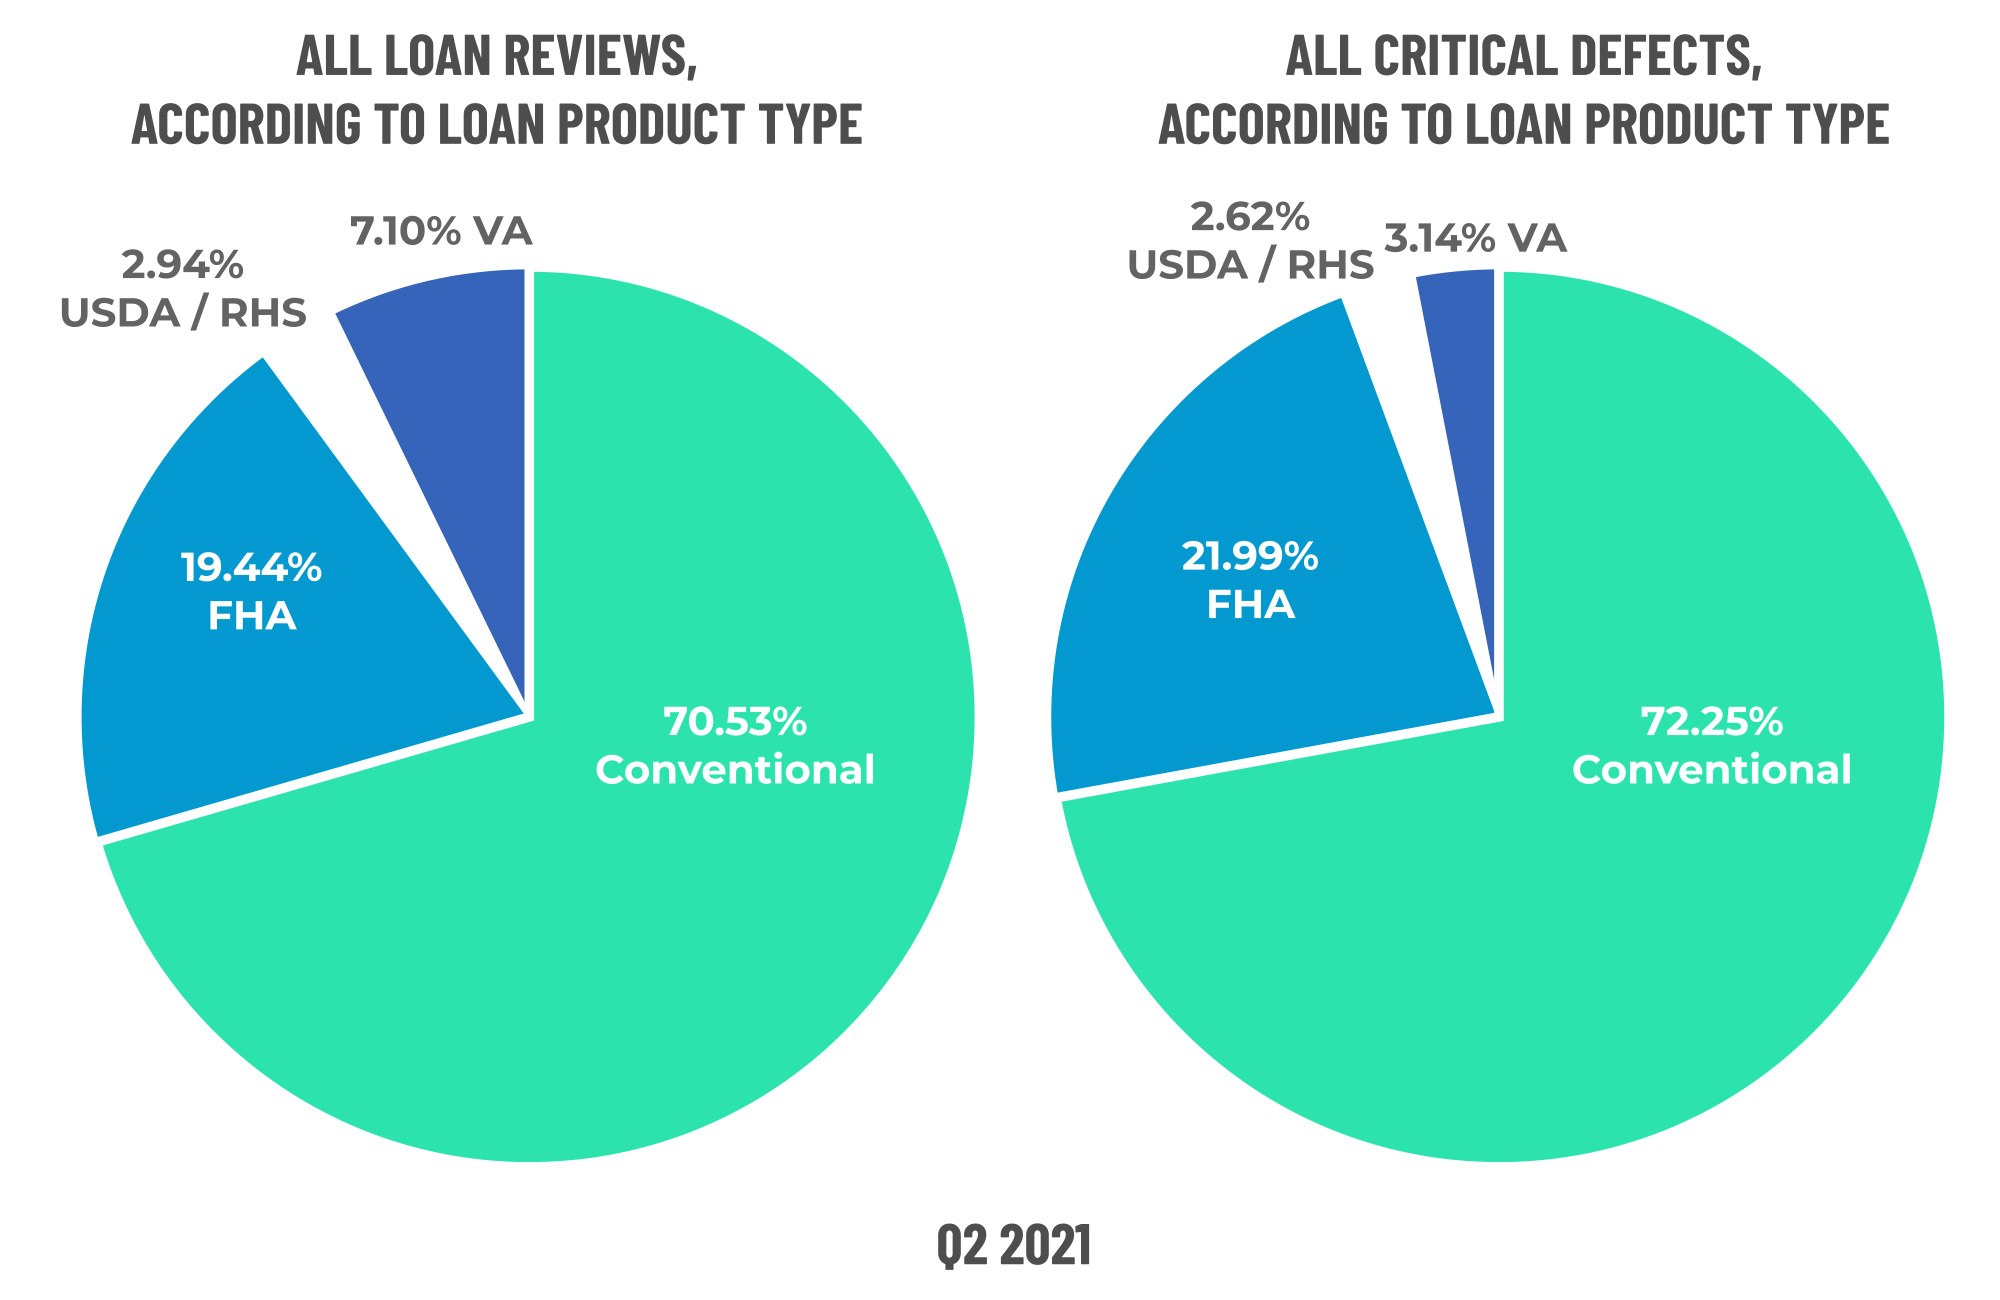
Figure 6 displays the loans reviewed and critical defects by loan type for Q2 2021.
Early Payment Defaults
The number of Early Payment Default (“EPDs”) reviews that lenders are performing continues to fall. EPDs through Q3 2021 have now fallen below pre-pandemic levels for the second straight quarter. A primary reason for the decline in the number of EPDs is a corresponding drop in the number of loans in active forbearance. According to Black Knight’s Mortgage Monitor3, loans still in a forbearance period fell to 3.5% through the end of June. That is the lowest number since the inception of the CARES Act that established the ability for borrowers to enter into a “no questions asked” forbearance plan. The same report estimates 1.86 million borrowers remain in active forbearance status. At this point, we remain more concerned about loans exiting forbearance and the loss mitigation burden facing servicers than we do about new EPDs causing excessive risk to lenders.
3 https://cdn.blackknightinc.com/wp-content/uploads/2021/07/BKI_MM_June2021_Report.pdf
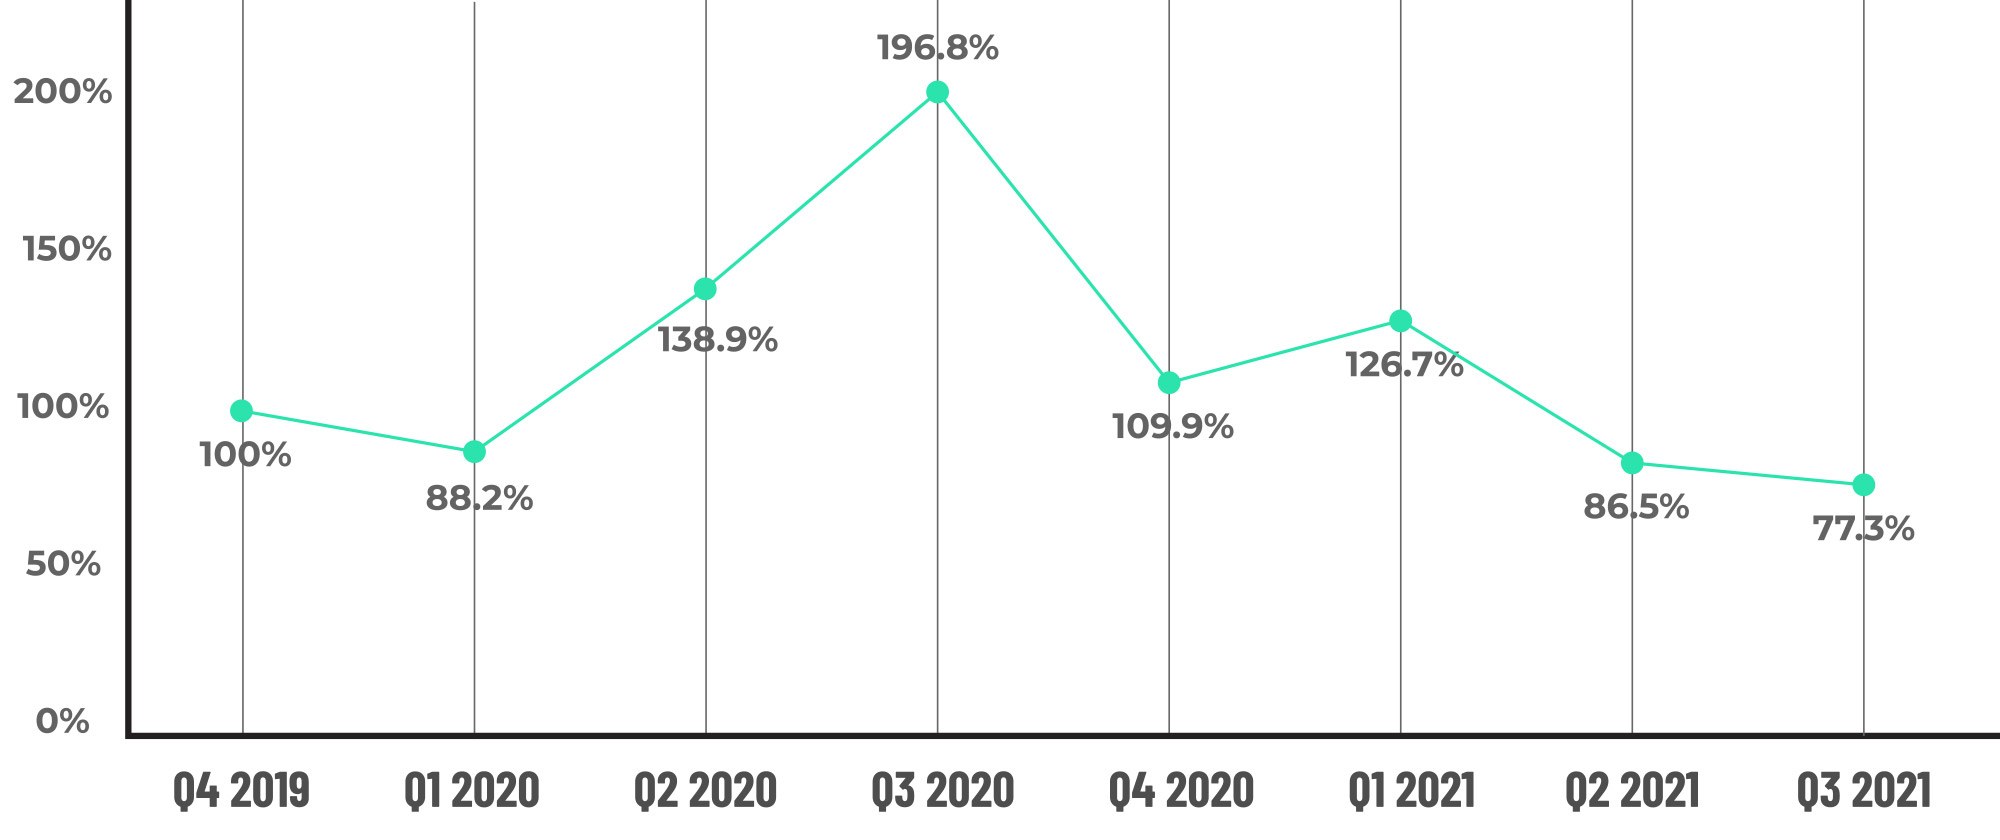
Figure 7 displays the EPD % by quarter from Q4 2019 to Q3 2021.
Conclusion
In terms of the overall critical defect, Q2 2021 was a step back from the improving rates we saw in the prior two quarters. However, the data did show improvements in conventional lending defect rates, which is important given that conventional loans have dominated the market for the past 18 months. We also saw improvement in many of the defect categories, although, the Income/Employment category remains a top concern. Rates are up but not dramatically so, and stabilization in volume has allowed lenders to re-double underwriting and risk management protocols and prepare for the purchase market in which we are increasingly finding ourselves.
Lender Profitability / Gain On Sale
In a positive sign for the mortgage lending industry, lender profitability was strong in the latest quarter, with most publicly traded lenders having reported Q3 earnings by the publication of this report. Profitability was primarily driven by improvement in the gain-on- sale margin, which moved upward after falling in the last quarter. Based on the available data, gain-on-sale in the most recent quarter was between 2.75% and 3%, up from 2.25%- 2.75% in the prior quarter. As a reminder of just how good the lending market was in 2020, the gain-on-sale metric averaged 5% for Q2 2020 and 4.5% for Q3 2020. With volumes also lower in 2021, it is clear why lender profitability is also down. Thus, lenders are adjusting their costs and operations to transition to a lower volume, purchase-driven market with an eye towards improving profitability.
Property Appreciation
Housing prices continue to rise, with the S&P CoreLogic Case-Shiller Index showing an average annual gain of 19.5% from September 2020 through September 2021 and gains as high as 33% or more in certain areas. Economists point to a lingering shortage of homes, increasing construction costs, rising incomes and new household starts as reasons for the rise. Supply remains particularly constrained in larger population centers, and many would-be buyers are competing against the voracious appetite of property investors. A recent report published by RealtyTrac4 stated that by the end of Q2 2021, the share of investor purchases was 15.4%, that’s up from 11.5% in the prior quarter. It’s no surprise that the share of investor purchases was 20%+ in the areas that have seen the greatest year-over-year price increases. Most economists analyze housing affordability as part of their forecasts for property appreciation, and by and large, these same economists point to rising incomes as keeping housing affordability within historical ranges, with some exceptions in large metro areas. Interest rates also factor into appreciation and affordability, so some caution is warranted as the Federal Reserve considers action to combat inflation.
Inflation
A popular measure of inflation is the Consumer Price Index (“CPI”), published monthly by the U.S. Bureau of Labor Statistics. Inflation soared in the early part of 2021 before cooling over the summer, with CPI falling month-to-month for the period of July through September 2021. The latest numbers available are through October month-end and show that inflation has once again soared to a monthly rate of 0.9% (that translates into a 6.2% rate for YTD 2021). The Federal Reserve is considering tapering its bond purchases, including mortgage bonds, which should lower demand for the bonds and has the potential to drive interest rates higher.
When refinance booms come to an end, there are many economic inputs that can affect the mortgage lending market. Lenders should stay nimble and actively adapt their quality control processes to ensure that lending quality is maintained as we go forward. While the worst-case scenarios are unlikely to happen (or happen suddenly and all at once), changes in any of the above metrics can impact volumes and loan quality.
4 https://www.realtytrac.com/blog/realtytrac-investor-purchase-report-fall-2021/
About the ACES Mortgage QC Industry Trends Report
The ACES Mortgage QC Industry Trends Report represents a nationwide post-closing quality control analysis using data and findings derived from mortgage lenders utilizing the ACES Analytics benchmarking software.
This report provides an in-depth analysis of residential mortgage critical defects as reported during post-closing quality control audits. Data presented comprises net critical defects and is categorized in accordance with the Fannie Mae loan defect taxonomy.
About ACES
ACES Quality Management, formerly known as ACES Risk Management (ARMCO), is the leading provider of enterprise quality management and control software for the financial services industry. The nation’s most prominent lenders, servicers and financial institutions rely on ACES Quality Management & Control® Software to improve audit throughput and quality while controlling costs, including:
- 3 of the top 5 and more than 50% of the top 50 independent mortgage lenders;
- 7 of the top 10 loan servicers;
- 11 of the top 30 banks; and
- 1 of the top 3 credit unions in the USA.
Unlike other quality control platforms, only ACES delivers Flexible Audit Technology, which gives independent mortgage lenders and financial institutions the ability to easily manage and customize ACES to meet their business needs without having to rely on IT or other outside resources. Using a customer-centric approach, ACES clients get responsive support and access to our experts to maximize their investment.
For more information, visit www.acesquality.com or call 1-800-858-1598.
Media Contact: Lindsey Neal | DepthPR for ACES | (404) 549-9282 | lindsey@depthpr.com
View all reports