ACES’ Mortgage QC Industry Trends Report represents an analysis of nationwide quality control findings based on data derived from the ACES Quality Management & Control Software.
Executive Summary
QC Industry Trends – Overview
QC Industry Trends – by Category
QC Industry Trends – by Loan Purpose
QC Industry Trends – by Loan Product Type
Economic Discussion
Conclusion
About this Report
Executive Summary
This report represents an analysis of post-closing quality control data derived from loan files analyzed by the ACES Quality Management and Control® benchmarking system during the second quarter of 2022 (Q2 2022). The report incorporates data from prior quarters and/or calendar years, where applicable.
Findings for the Q2 2022 Trends Report were based on post-closing quality control data from thousands of unique records. Loan audits selected by lenders for full file reviews served as the basis for all reviews and defect data evaluated for this report.
Defects are categorized using the Fannie Mae loan defect taxonomy. Data analysis for any given quarter does not begin until 90 days after the end of the quarter to allow lenders to complete the post-closing quality control cycle, resulting in a delay between the end of the quarter and data publication.
NOTE: A critical defect is defined as a defect that would result in the loan being uninsurable or ineligible for sale. The critical defect rate reflects the percentage of loans reviewed for which at least one critical defect was identified during the post-closing quality control review. All reported defects are net defects.
Summary of Findings
Defect rates increased in Q2 2022, driving the overall critical defect rate to 2.05%. Given that 2% is generally considered to be the “line in the sand” as far as an acceptable critical defect rate, the increase from the previous quarter’s 1.93% and the reversal of quarter-over-quarter improvement between Q4 2021 and Q1 2022 is cause for concern, as it indicates a slight degradation in overall loan quality. The likely driver of this increase was the quarter’s volatile interest rate environment, which saw rates jump by more than 100 basis points over the course of the quarter. While defects declined in three of the four major underwriting categories, including Income/Employment, Loan Documentation defects rose steeply from last quarter. Purchase loan share increased, as we would expect at this point in the market cycle, while loan quality decreased due to significant defect increases for VA and USDA loans.
Report highlights include the following findings:
- The overall critical defect rate increased 6% over Q1 2022, ending the quarter at 2.05% and crossing the 2% threshold for only the third time in this report’s history.
- While Income/Employment defects continue to represent the majority of defects reported, its overall share of defects decreased from the previous quarter.
- Loan Documentation defects increased significantly in Q2 2022, with Closing Documentation errors comprising the vast majority of these defects.
- Appraisal defects continued trending downward for the second straight quarter, improving slightly over Q1 2022.
- Purchase share increased in Q2 2022, reflecting the shift from a refinance market, while conventional loan share remained essentially unchanged.
- Although FHA share increased slightly in Q2 2022, defects declined significantly in this category over the previous quarter. Conversely, VA and USDA defects increased remarkably despite only modest gains in review share, with VA defects more than doubling from the previous quarter.
QC Industry Trends – Overview
Critical defects for Q2 2022 increased to 2.05%, rising 6% from the prior quarter. As noted above, a 2% defect rate is an important threshold from our perspective. The last two times defects crossed the 2% threshold was in the later quarters of 2020, when the mortgage industry was grappling with a historic refinance boom, rapid regulatory changes and lingering economic turmoil from the COVID-19 pandemic. Thus, it is safe to assume that economic and market conditions played a role in this quarter’s defect rate crossing the 2% mark.
Looking back at what transpired around this time, Russia’s invasion of Ukraine at the tail-end of Q1 caused the bond market and, therefore, the mortgage market to go haywire right as we entered into Q2. At the end of Q1 2022, the average 30-year fixed rate sat at 4.67%. Within two weeks, that rate crossed the 5% mark and continued to climb. After peaking at 5.81% in late June, rates ended the quarter at 5.7%1. The rapidly rising interest rate environment slammed the breaks on origination volume, and lenders that just a few quarters ago were swimming in business suddenly found themselves no longer profitable. As is expected in a down market, lenders began to lay off staff. This “perfect storm” of interest rates, volume and layoffs triggered massive disruption in the industry, and anytime you have market disruption, it creates opportunities for errors.
In addition, increased competition almost certainly played a role in this quarter’s defect increase. When lenders are fighting for every dollar of volume, the credit box often gets stretched, and lenders may be a bit more aggressive in their interpretation of certain factors to get the loan to qualify. Thus, the fact that the industry hit the 2% mark for defects in Q2 is not totally surprising, but it’s definitely something we would want to see trend downward as the chaos subsides.
Property appreciation has been one of the keys that has kept the current market from entering into 2008/2009 territory, partly because of the appraisal environment. Home prices have continued to rise so even if a borrower does get into financial trouble, they are still able to sell the home for more than they paid for it and walk away with some cash, which is the first option that most borrowers would take if and when they became unable to afford their mortgage. Thus, appraisal defects have been an area to watch. The GSEs are looking very heavily at appraisals now because there is some softness in the property markets, and they are not inclined to buy loans that may be underwater because the appraisal was bad. Luckily, the Appraisal category has seen two consecutive quarters of decline, which bodes well for the market, but rising interest rates may hinder home value appreciation in coming quarters, so this will continue to be an area of interest.
One final note – repurchase data from Q2 2002 indicates that lenders bought back more loans from the GSEs during this quarter than in any other three-month period over the last eight years2.
1 http://www.freddiemac.com/pmms/
2 https://www.insidemortgagefinance.com/articles/225773-buybacks-spiked-in-2q22?v=preview (subscription required)
Critical Defect Rate by Quarter: Q3 2021 — Q2 2022

Figure 1 displays the percentage of loans with critical defects by quarter, for Q3 2021 through Q2 2022.
QC Industry Trends by Defect Category
While still the leading defect category for the 11th straight quarter, the Income/Employment category improved 21% over last quarter, comprising only 26.92% of all defects in Q2 versus 34.27% in Q1. Given concerns that this would be an area in which lenders may stretch the limits to help qualify borrowers, seeing a significant decline in this category puts some of those fears to rest.
Of the “big four” underwriting-related categories (Assets, Credit, Income/Employment and Liabilities), all but one saw declines from the previous quarter. The 13% increase in the Assets category could reflect an attempt to help borderline borrowers qualify, so this area bears close attention in subsequent quarters. Similarly, the 22% increase in the Borrower and Mortgage Eligibility category could also indicate lenders’ efforts to keep business flowing amidst a challenging rate environment.
Behind Income/Employment, the next highest category of defects was Loan Documen- tation, which experienced a 126% increase over Q1 2022. Quarter over quarter, this defect category experiences the most volatility, with defect share having been as low as 4.17% (Q2 2017) and as high as 32.5% (Q3 2016) since this report’s inception. While there is no concrete reason for this category’s volatility overall, the central area of concern in this quarter as illustrated in Figure 5 was Closing Documentation, which comprised 59.38% of defects within this category.
Not only was there a massive jump in loan documentation as far as overall critical defect rate categories, but within the “big four” categories, documentation issues make up more than half of the defects in most cases. Given the rate disruption that occurred early in the quarter and subsequent layoffs, it would be safe to assume that these errors reflect that disruption.
The rising rate environment meant lenders could not afford to miss closing deadlines and extend rate locks, so loans may have gotten to closing that did not have all the necessary documentation. Staffing volatility also opens the door to errors, as staff may have taken over loans midstream from departing colleagues or documents being sent to employees that were subsequently laid off. As volatile as this category and this quarter have been, we would hope to see improvement in the next quarter, but in the meantime, this is an area in which lenders should place their focus.
Appraisal defects improved for the second straight quarter, declining 8% from Q1 2022’s total of 4.2% to 3.85% in Q2. As noted earlier, the continued decline is encouraging but still bears scrutiny in coming quarters due to the outsized impact of property valuations on the current market.
Critical Defects by Fannie Mae Category: Q2 2022
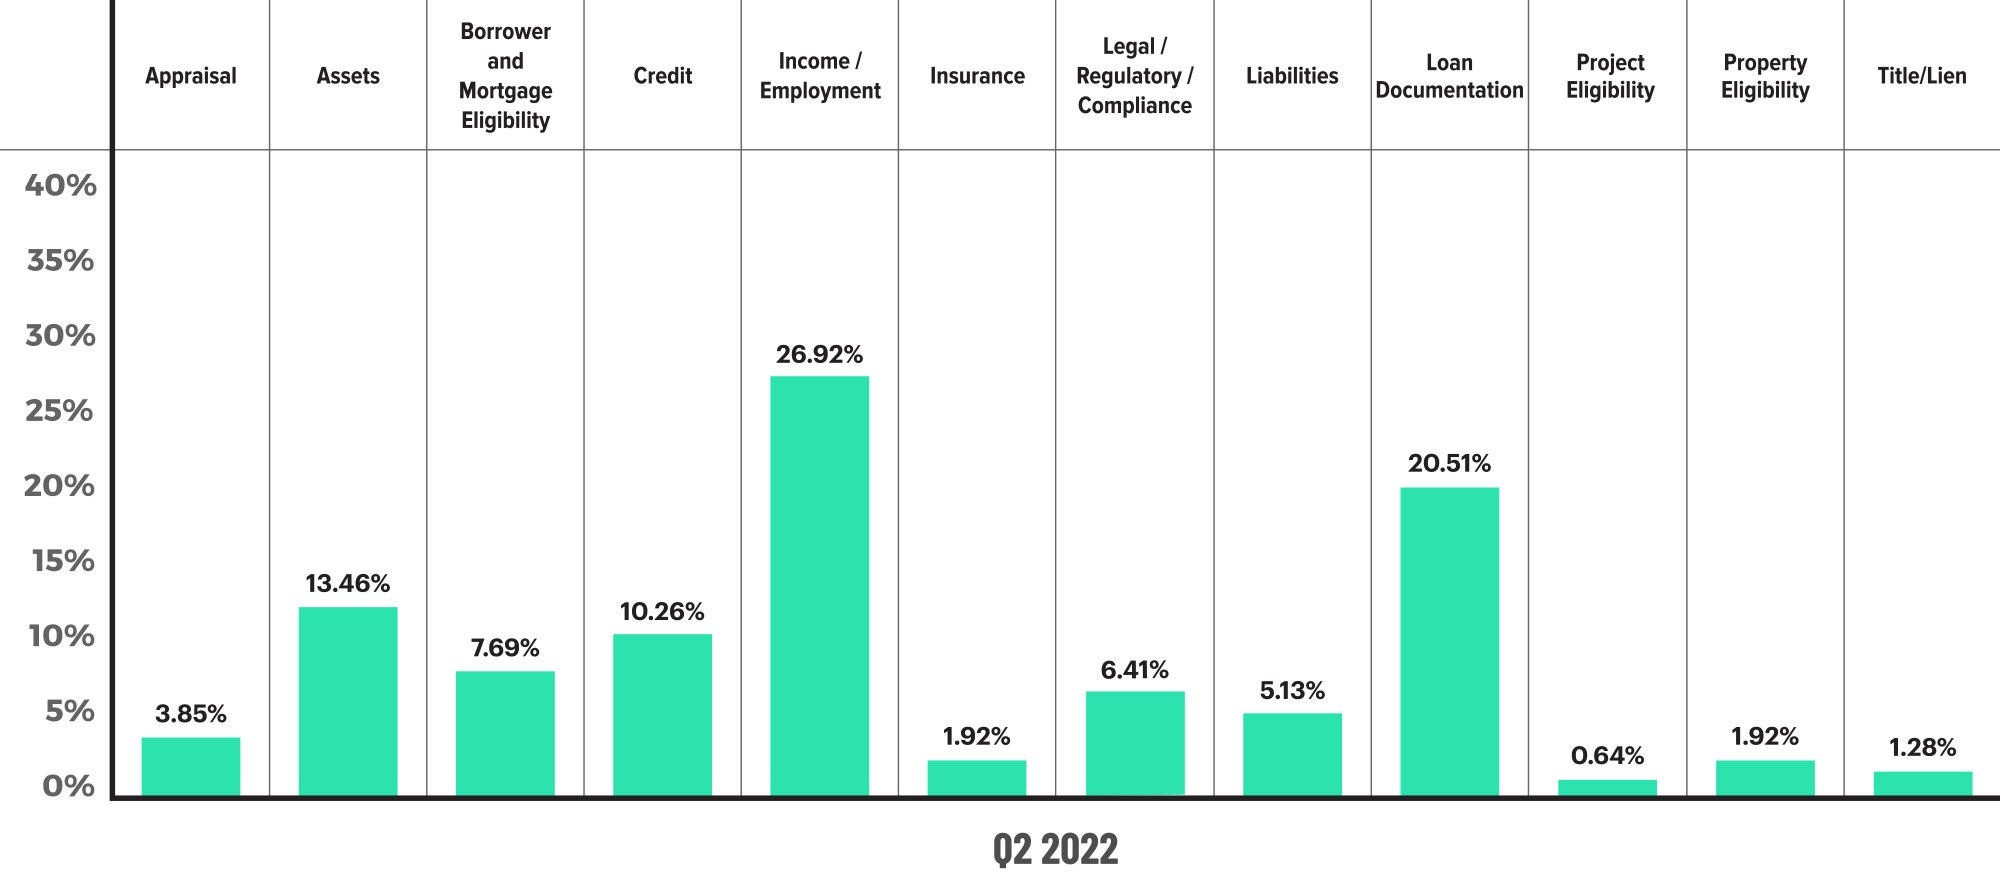
Figure 2 displays the dispersion of critical defects across Fannie Mae categories for Q2 2022.
Critical Defects by Fannie Mae Category: Q1 2022 vs. Q2 2022
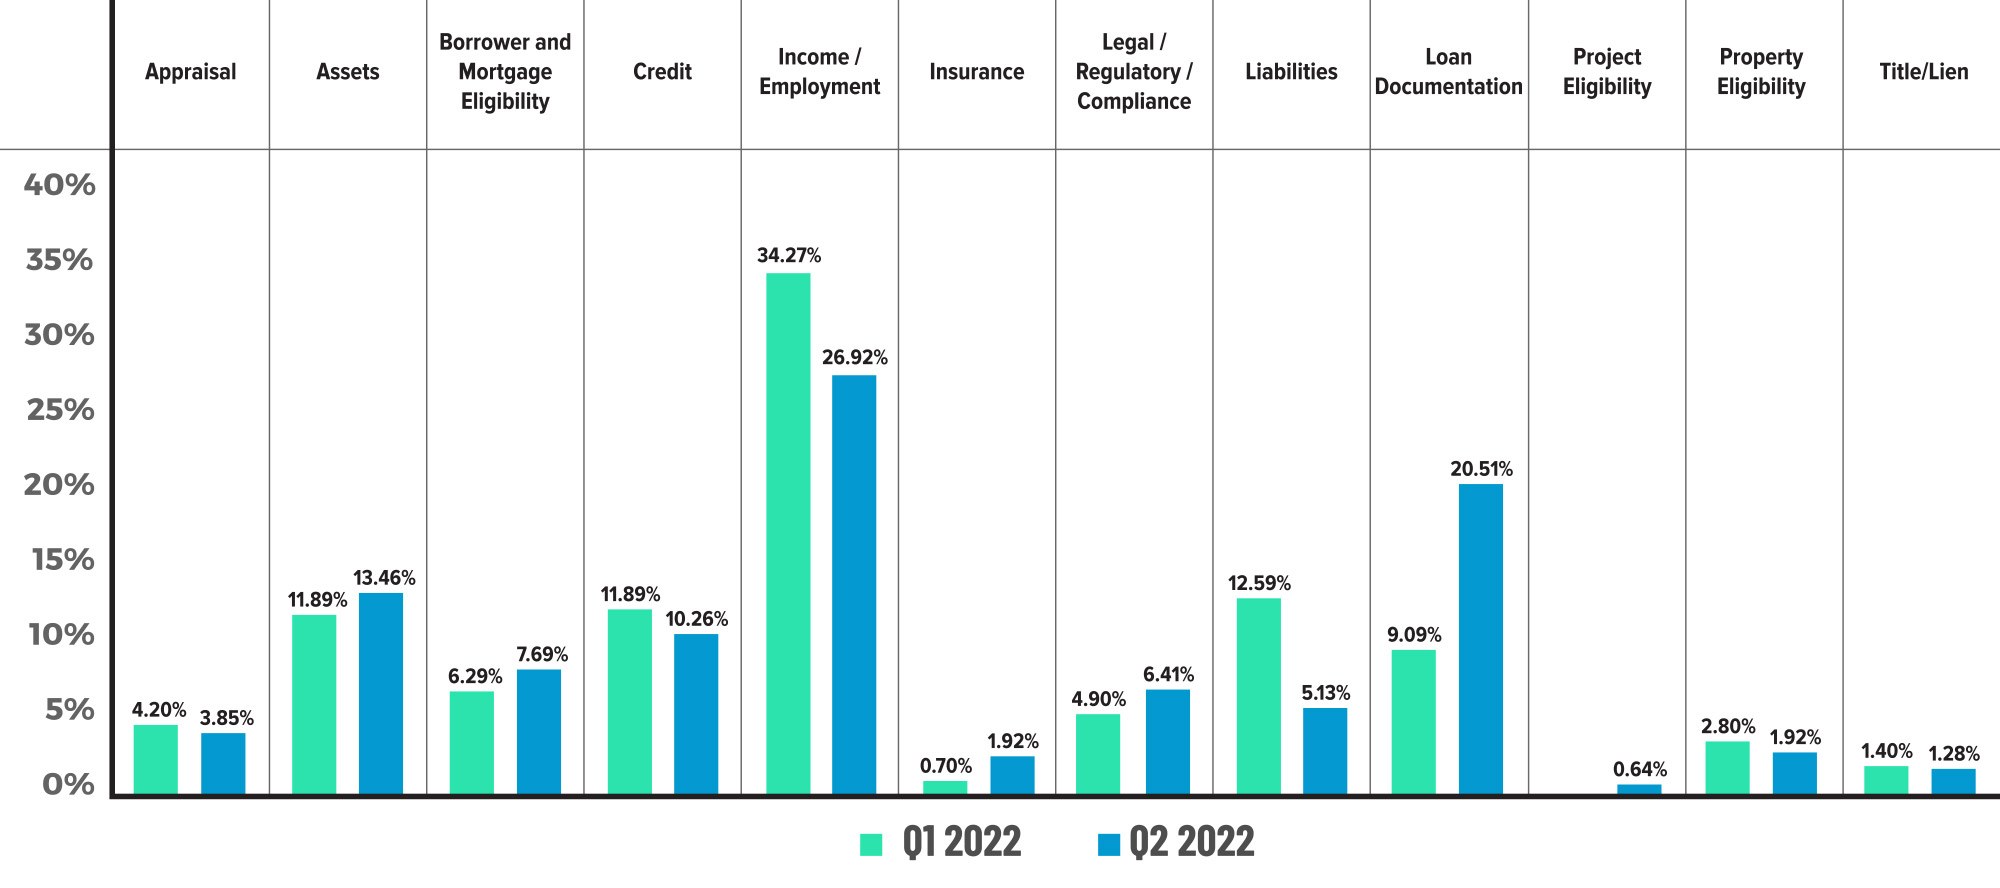
Figure 3 displays the critical defect rate by Fannie Mae category, comparing Q1 2022 to Q2 2022.
Critical Defects by Fannie Mae Sub-Category: Q2 2022
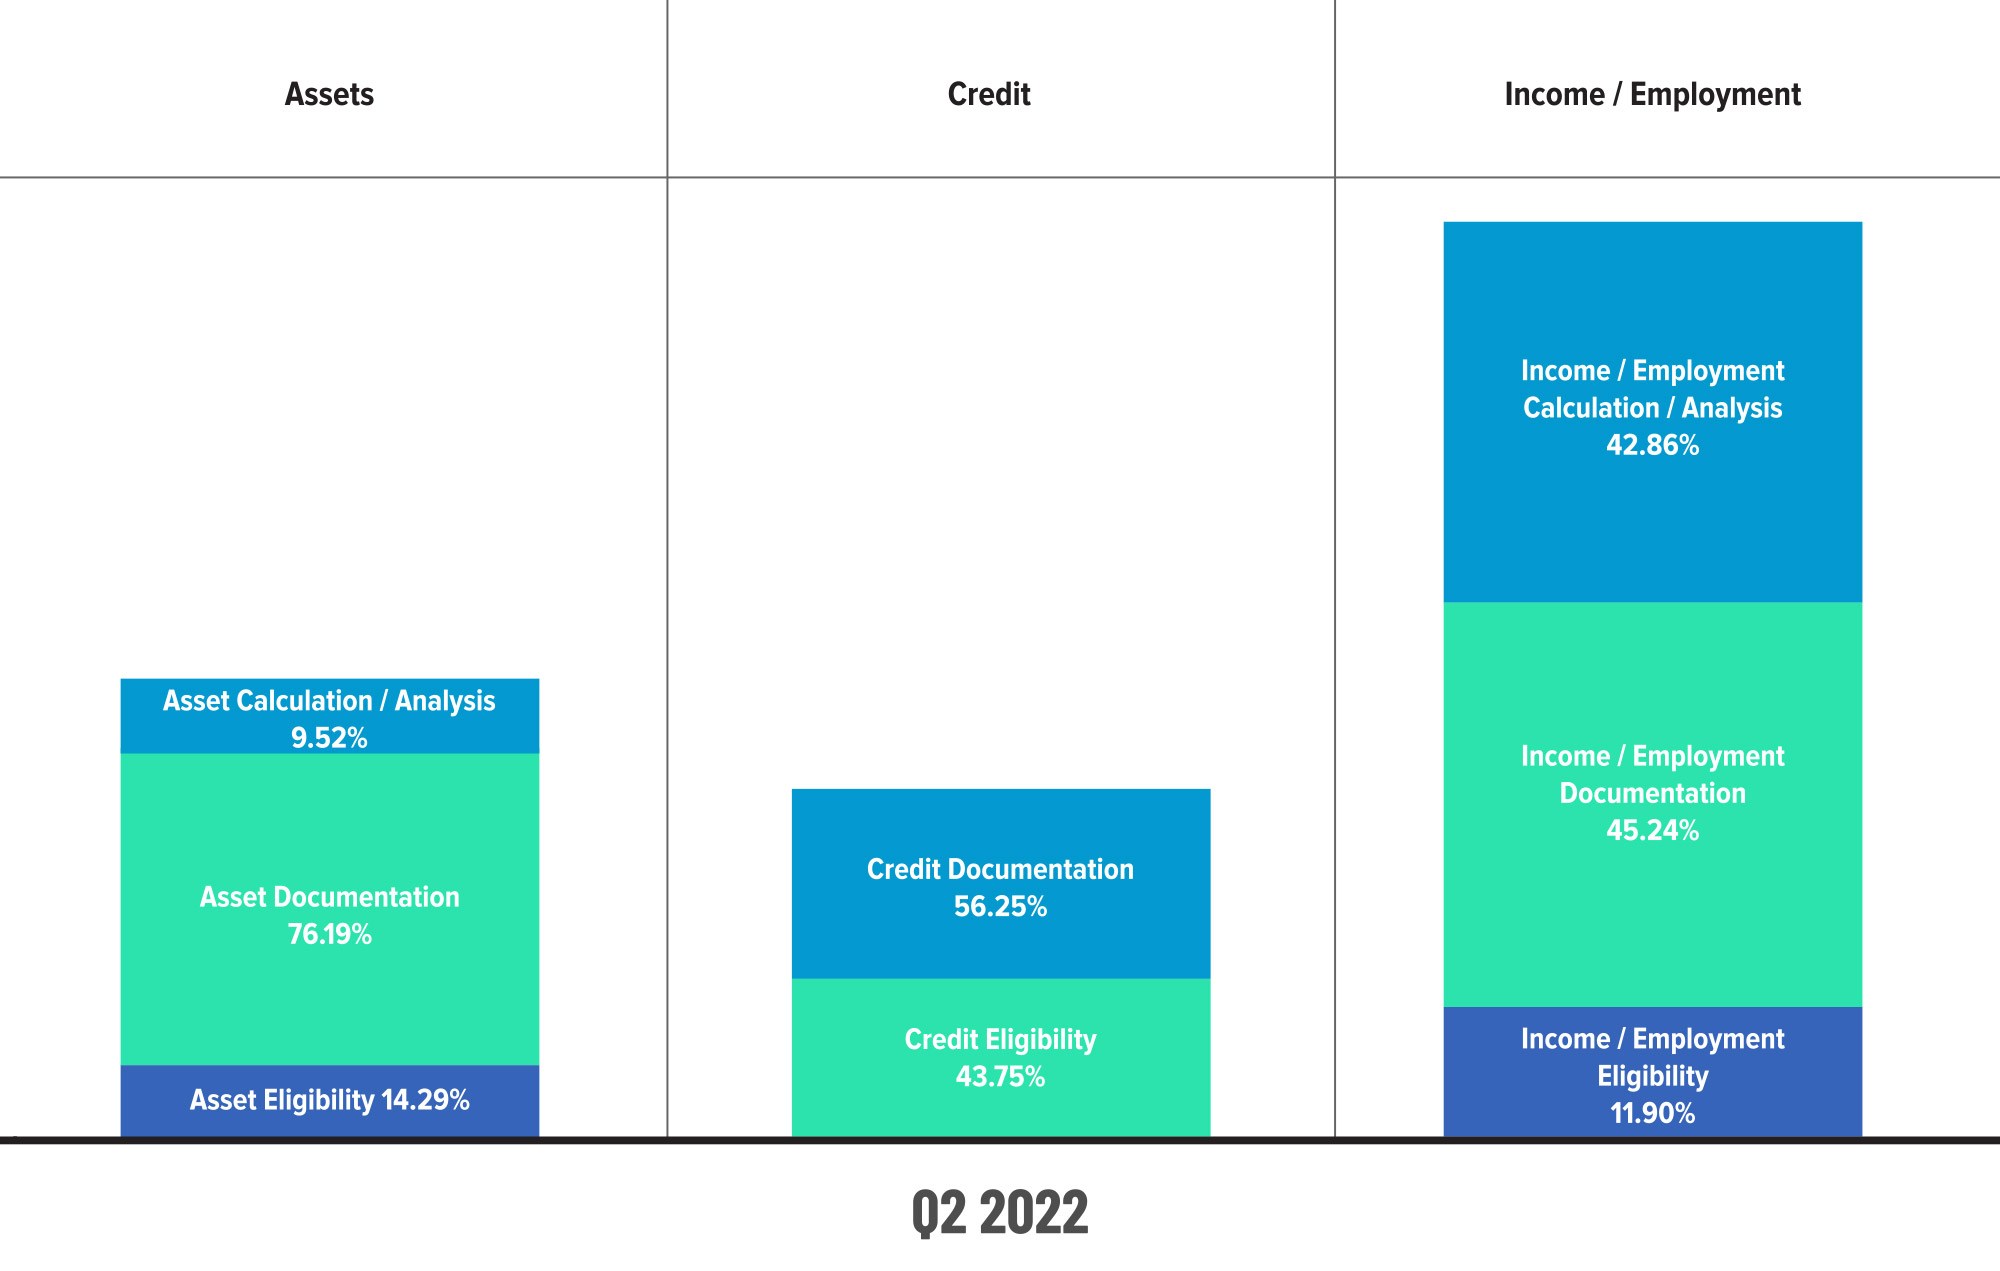
Figure 4 displays sub-category information for Q2 2022 within the Assets, Credit and Income/Employment categories.

Figure 5 displays sub-category information for Q2 2022 within the Loan Documentation category.
QC Industry Trends by Loan Purpose
Review share shifted in favor of purchase transactions in Q2 2022 after two previous quarters of negligible change, with the rising rate environment ushering in the end of the refinance boom. Purchase reviews increased 21% from the previous quarters 60.22% share to 72.76% in Q2, whereas refinances dropped 32% from 39.82% in Q1 to 27.24% in Q2.
We see similar trends when looking at performance metrics for this quarter. Purchases comprised 77.24% of the overall defect share in Q2 2022, up 28% from the prior quarter’s share of 60.18%, while refinances decreased 43% to make up 22.76% of defects this quarter versus 39.82% in the previous quarter. While Q1 2022 saw relative parity between review and defect share, the same cannot be said for Q2, which is cause for concern now that the industry has shifted from a refinance market to a purchase-driven one. FHA loans are often the culprit when purchase defects outstrip review share, but that’s not the case for this quarter, as we saw measurable gains in defect share amongst USDA and VA loans. We’ll dig into this a bit deeper in the next section.
Critical Defects by Loan Purpose: Q2 2022
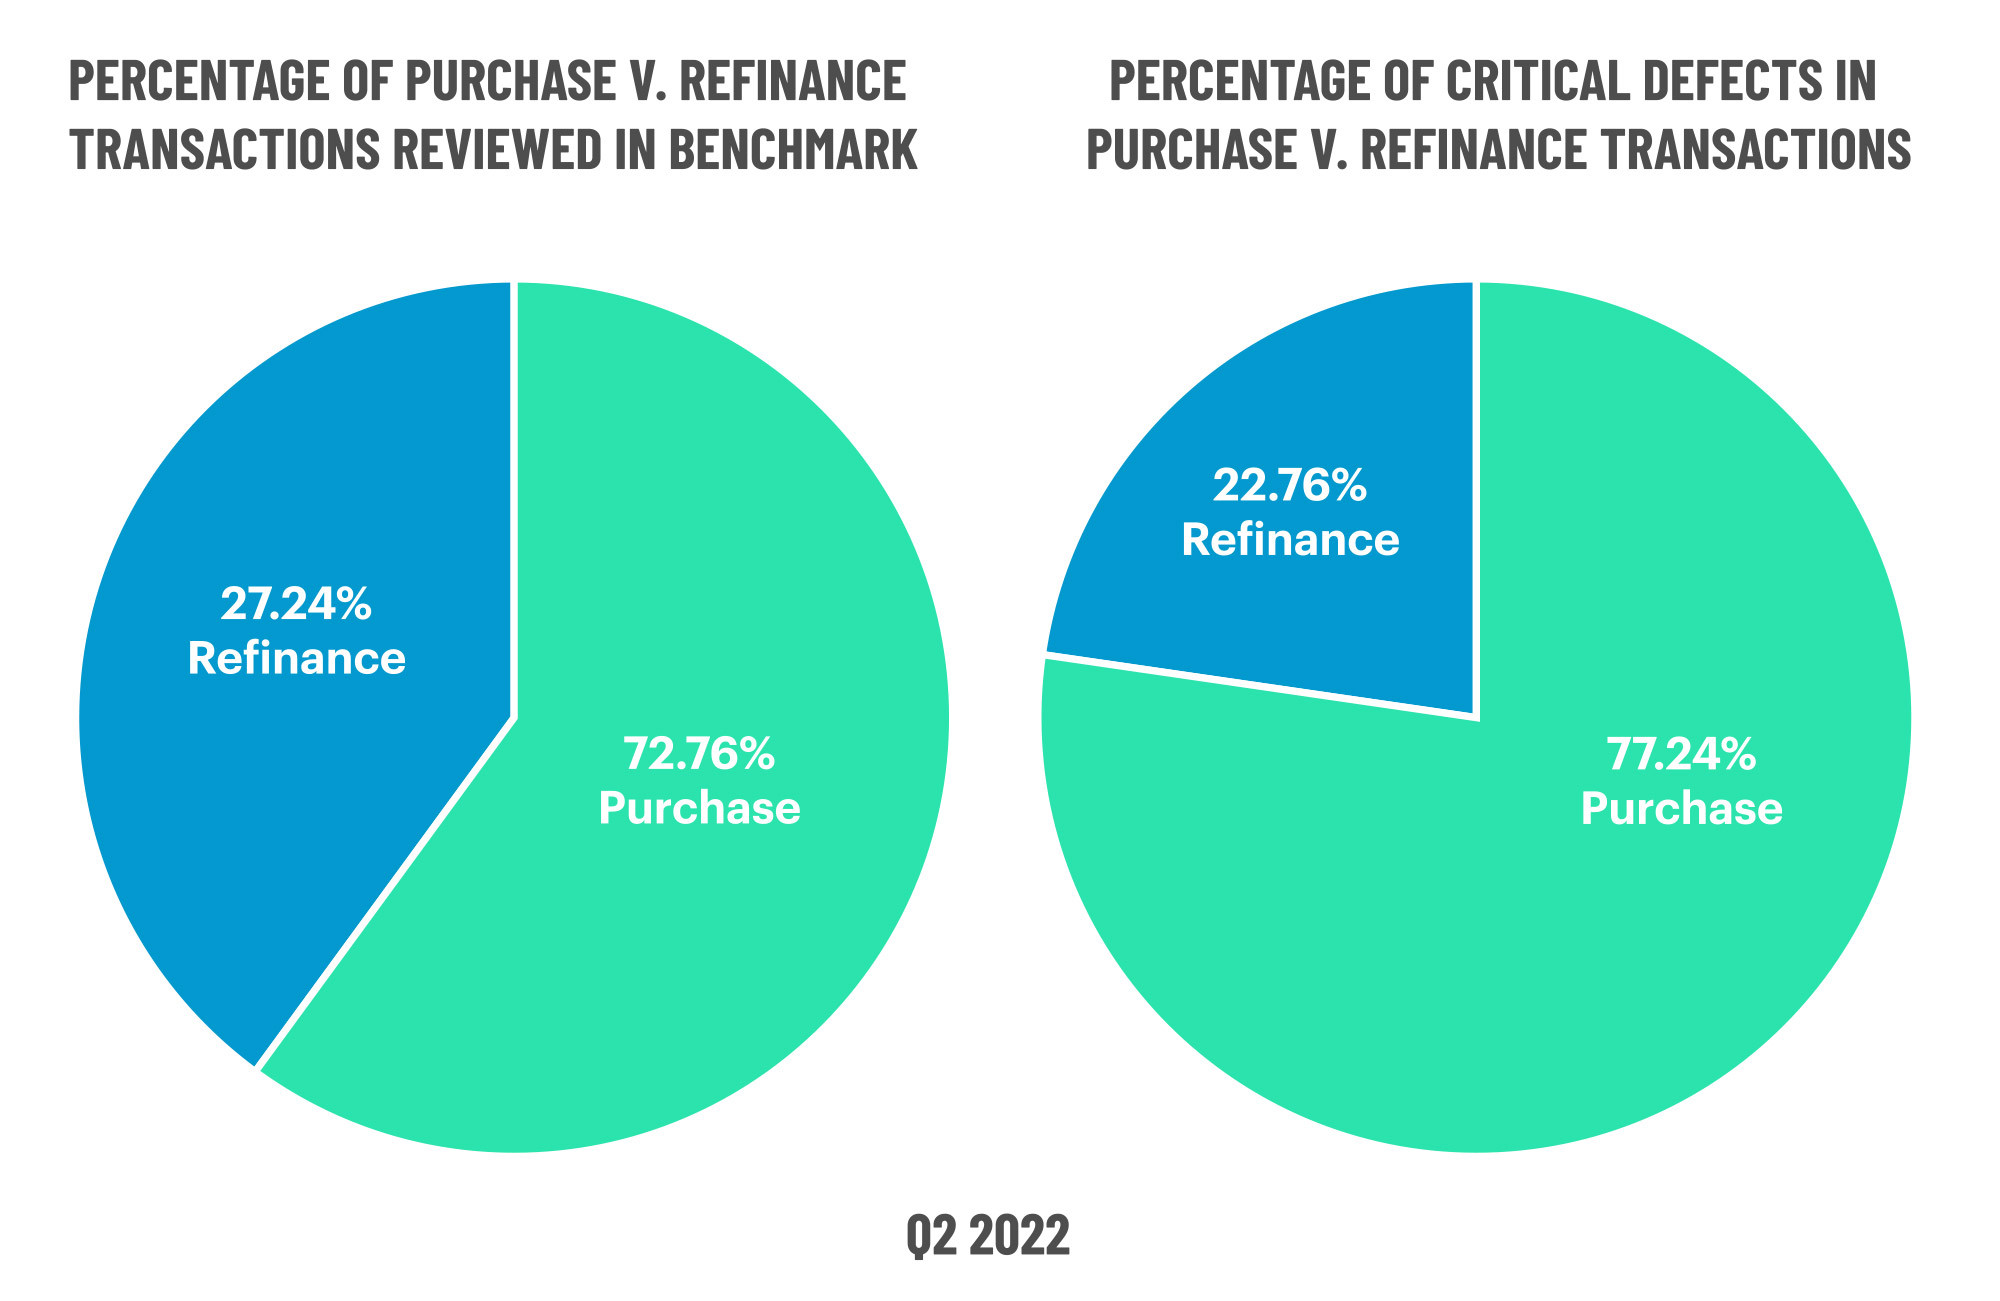
Figure 6 displays the loans reviewed and critical defects by loan purpose for Q2 2022.
QC Industry Trends by Loan Product Type
In a reversal of last quarter’s review share trend, conventional loan share increased by 0.4%, comprising 65.82% in Q2 2022 versus 65.53% in Q1. As noted in last quarter’s report, the pandemic skewed this statistic significantly, but pre-pandemic, conventional loan share averaged between 65% and 70% so this quarter’s numbers indicate we are reverting to historical norms after a sustained period of abnormal loan activity.
With the modest rise in conventional lending, FHA review share declined in Q2 2022. FHA loans comprised 19.77% of reviews in Q2 2022 versus 23.29% in the prior quarter, representing a 15% decline and ending a trend of multi-quarter increase. Meanwhile, VA loan share continued its multi-quarter rise, increasing 11% from Q1 2022’s 10.36% share to 11.46% this quarter. USDA loan share also increased 4%, comprising 2.95% of reviews in Q2 2022 versus 2.83% in Q1.
Once again, conventional loan defects were relatively flat, ending Q2 2022 at 44.72% compared to 44.74% in the prior quarter and reflecting another multi-quarter trend. The real story this quarter is defect share amongst the government-insured loan products. FHA defects dropped 29% in Q2 2022, comprising just 30.08% of defects versus 42.11% in Q1, which is a positive sign given that FHA purchase loans are the most error-prone product type to originate.
However, both VA and USDA saw significant quarter-over-quarter increases in defects. VA defect share jumped 127% between Q1 and Q2 2022, representing 17.89% of defects this quarter compared to 7.89% last quarter. USDA defect share rose 39% from 5.26% in Q1 to 7.32% in Q2. Much like FHA loans, VA and USDA purchase transactions are notoriously tricky to originate so errors are to be expected to a certain degree. Yet, our search of regulations and updates to the HUD handbook and the VA handbook didn’t return any material changes that could explain why quality changed so dramatically in the second quarter. The most likely reason for these increases may simply be declining volumes. As the overall volume decreases, that impacts sample size and the ratio of defects to the overall volume. For example, the math on five errors found in a pool of 100 loans tells a different story than those same five errors found in a pool of 1,000 loans. Thus, without a more definitive explanation for this significant increase, lenders should pay close attention to this portion of their production pipeline in the coming months.
Critical Defects by Loan Product Type: Q2 2022

Figure 7 displays the loans reviewed and critical defects by loan type for Q2 2022.
Economic Discussion
Originations Plummet While Rates Skyrocket
As noted in last quarter’s report, “The primary story of Q1 2022 was the rapid decline in mortgage volumes brought on by a similarly rapid increase in interest rates.” That state of affairs accelerated in Q2 2022. ATTOM’s U.S. Residential Property Mortgage Origination Report3 for Q2 2022 showed a 13% quarter-over-quarter decrease in mortgage originations, marking five consecutive quarters of decline. Year-over-year, originations were down 40%, the most significant annual drop since 2014.
The 200+ basis point increase in rates from March to June was undoubtedly the driving factor behind the standstill in mortgage origination activity, but it is the precipitating factors behind that increase that bear additional scrutiny. Q2 2022 marked the first full quarter following Russia’s invasion of Ukraine, and the economic uncertainty triggered by the move sent the markets into a tailspin. As a result, mortgage interest rates disassociated from the 10-year Treasury yield at a pace rarely, if ever, seen. Contributing to this were the three rate hikes instituted by the Federal Reserve at the end of Q1 and into Q2. On March 17, the Fed increased the Federal Funds Rate by 25 basis points. Two and a half weeks later, on May 7, the Fed Funds Rate went up by another 50 basis points, and during the next meeting on June 16, we saw another rate hike of 75 basis points.
These dramatic rate hikes further exacerbated market instability, and as a result, mortgage spreads widened considerably. In response, the non-agency secondary market seized up seemingly overnight because investors were leery of the risks of buying mortgage-backed securities (MBSs) in such a volatile rate environment. With lenders unable to get needed premiums for their MBSs and homebuyers skeptical of buying in a rising rate environment, we started to see lenders become unprofitable, with lenders averaging -5 basis points in production profit on the heels of a historic $10,937 in total production expenses4, and begin cutting their workforce to rein in costs and keep their doors open.
According to the Urban Institute, current spreads now exceed those seen during the early stages of the pandemic and are on course to reach levels last seen during the 2008 financial crisis5. Therefore, it is reasonable to assume that these market conditions will continue to impact the industry throughout 2022. If there is a silver lining to be found in all of this, it is that the decline in volume provides lenders with an opportunity to shore up their existing quality control procedures and ensure the salability of the loans that are coming through the door despite the rate environment.
4 https://www.mba.org/docs/default-source/research-and-forecasts/chart-of-the-week/-8-19-22-imb-average- quarterly-production-profits-(bps).pdf?sfvrsn=9627f721_1 (subscription required)
5 https://www.urban.org/urban-wire/why-have-mortgage-rates-gone-so-much
Borrowers ARM Up
With rates on the rise, conditions were ripe for an increase in adjustable-rate mortgages (ARMs), and data from Q2 seems to bear out that supposition. The interest rate spread between ARMs and 30-year fixed rate mortgages averaged more than 100 basis points, making ARMs rates as much as 25+% more affordable than a 30-year fixed rate6. In addition, the increase in conforming loan limits for 2022 helped increase ARMs’ attractiveness, as lenders could now qualify more borrowers for ARMs backed by the GSEs.
Volume-wise, demand ebbed and flowed throughout the quarter but was still higher than in years’ past. ARM applications increased from 7.4% to 9.3% in April and peaked during the first week of May at 10.8% before ending the month at 8.7%. Application volume continued trending downward in June until spiking the week of June 17 at 10.6% but ultimately ended the month at 9.5%. In terms of originations, ARM origination volume increased 69.1% during the first five months of 2022 versus the same period in 20217. As ARM rates remain lower than 30-year fixed rates, demand will likely continue throughout 2022. As such, quality control groups should remain vigilant in their targeted and discretionary samples of these loan types to mitigate any risks.
Conclusion
All things considered, perhaps we should be grateful that the overall critical defect rate wasn’t higher this quarter. After all, it isn’t every day that you have a geopolitical event that triggers mass inflation, tremendous market disruption and an interest rate environment not seen since the Great Recession...unless you’re living in 2022. Hindsight being 20/20, it’s easy to see that Q2 was the true turning point for a mortgage market coming off a prolonged period of low interest rates and historic volumes. Coming out of 2019, most in the industry were predicting a somewhat severe downturn and got a last-minute reprieve in exchange for living through a global pandemic. Thus, the shoe that many were waiting to drop has finally done so, having built momentum during its long wait. However, there is still volume to be had for the lenders willing and able to chase it down. Once they get it in the door, the goal must be to protect the long-term value of that asset through a robust quality control and risk mitigation program.
About the ACES Mortgage QC Industry Trends Report
The ACES Mortgage QC Industry Trends Report represents a nationwide post-closing quality control analysis using data and findings derived from mortgage lenders utilizing the ACES Analytics benchmarking software.
This report provides an in-depth analysis of residential mortgage critical defects as reported during post-closing quality control audits. Data presented comprises net critical defects and is categorized in accordance with the Fannie Mae loan defect taxonomy.
About ACES
ACES Quality Management is the leading provider of enterprise quality management and control software for the financial services industry. The nation’s most prominent lenders, servicers and financial institutions rely on ACES Quality Management & Control® Software to improve audit throughput and quality while controlling costs, including:
- 60% of the top 50 independent mortgage lenders;
- 8 of the top 10 loan servicers;
- 11 of the top 30 banks; and
- 3 of the top 5 credit unions in the United States.
Unlike other quality control platforms, only ACES delivers Flexible Audit Technology, which gives independent mortgage lenders and financial institutions the ability to easily manage and customize ACES to meet their business needs without having to rely on IT or other outside resources. Using a customer-centric approach, ACES clients get responsive support and access to our experts to maximize their investment.
For more information, visit www.acesquality.com or call 1-800-858-1598.
Media Contact: Lindsey Neal | DepthPR for ACES | (404) 549-9282 | lindsey@depthpr.com
View all reports