ACES’ Mortgage QC Industry Trends Report represents an analysis of nationwide quality control findings based on data derived from the ACES Quality Management & Control Software.
Executive Summary
QC Industry Trends – Overview
QC Industry Trends – by Category
QC Industry Trends – by Loan Purpose
QC Industry Trends – by Loan Product Type
Economic Discussion
Conclusion
About this Report
Executive Summary
This report represents an analysis of post-closing quality control (QC) data derived from loan files analyzed by the ACES Quality Management and Control® benchmarking system during the second quarter of 2023 (Q2 2023). The report incorporates data from prior quarters, where applicable.
Findings for the Q2 2023 Trends Report were based on quality control data from tens of thousands of unique records. Volumes are essential to this analysis, and the included records reflect trends in overall origination volumes. However, data from additional lenders is added to this analysis once the lender’s QC review seasoning within the ACES software reaches the 12-month bar. Therefore, the overall volume in the QC Trends Report does not precisely mirror the overall market. All reviews and defect data evaluated for this report were based on post-close loan audits selected by lenders for full file reviews.
Defects are categorized using the Fannie Mae loan defect taxonomy. Data analysis for any given quarter does not begin until 90 days after the end of the quarter to allow lenders to complete the post-closing quality control cycle, resulting in a delay between the end of the quarter and our publication of the data.
NOTE: A critical defect is defined as a defect that would result in the loan being uninsurable or ineligible for sale. The critical defect rate reflects the percentage of loans reviewed for which at least one critical defect was identified during the post-closing quality control review. All reported defects are net defects.
Summary of Findings
The overall critical defect rate for Q2 2023 declined for a third straight quarter to 1.72%. Once again, defects in two of the four major underwriting categories increased this quarter, though the majority of defect categories experienced improvement this quarter. In a reversal of last quarter’s findings, FHA defects increased significantly in Q2 despite only a moderate rise in review share. While defect share decreased across the three other loan types, VA loans experienced the most significant decline as review share remained relatively steady.
Highlights include the following findings:
- The overall critical defect rate decreased by 3.37% to 1.72%, marking the third consecutive quarter of decline.
- Defects in the Credit and Liabilities categories increased for the second straight quarter.
- While Income/Employment and Assets continued to improve, these remain the top two defect categories for Q2 2023, followed by Loan Documentation at No. 3.
- Analysis of the core underwriting sub-categories showed dramatic improvement in Asset Eligibility from Q1, whereas Credit Documentation and Income/Employment quality deteriorated significantly.
- After increasing slightly in Q1, Appraisal defects declined in Q2.
- Q2 marked the third consecutive quarter where purchase and refinance transactions achieved relative defect parity.
- Last quarter’s improvement in FHA defects proved momentary, as defects rose this quarter, outstripping review share. Defects decreased across USDA, VA and conventional loans, with VA loans experiencing the most improvement.
QC Industry Trends – Overview
The industry continues to rebound from the historically high defect rates observed a year ago, which is especially heartening to see at a time when every loan matters.
Once again, the average 30-year fixed interest rate remained below 7% for Q2, with rates entering the quarter at 6.28% before peaking at 6.79% in early June and ultimately ending at 6.71% by quarter’s end1. The consecutive quarters of relative rate stability seemed to encourage consumers during the spring homebuying season, as volumes increased 21% over Q1 – ending two years of quarter-over-quarter decline2.
As noted in last quarter’s report, depressed origination volumes often lead to an uptick in loan quality, as lenders’ underwriting and processing teams are under less strain and can, therefore, be more thorough with their calculations and analyses. Thus, to see the critical defect rate continue to decline even as volumes rise, albeit modestly, speaks to the care and diligence lenders continue to take in regard to ensuring loan quality.
1 https://fred.stlouisfed.org/series/MORTGAGE30US
2 https://www.attomdata.com/news/market-trends/mortgage-origination/attom-q2-2023-u-s-residential-property-mortgage-origination-report/
Critical Defect Rate by Quarter: Q3 2022 — Q2 2023
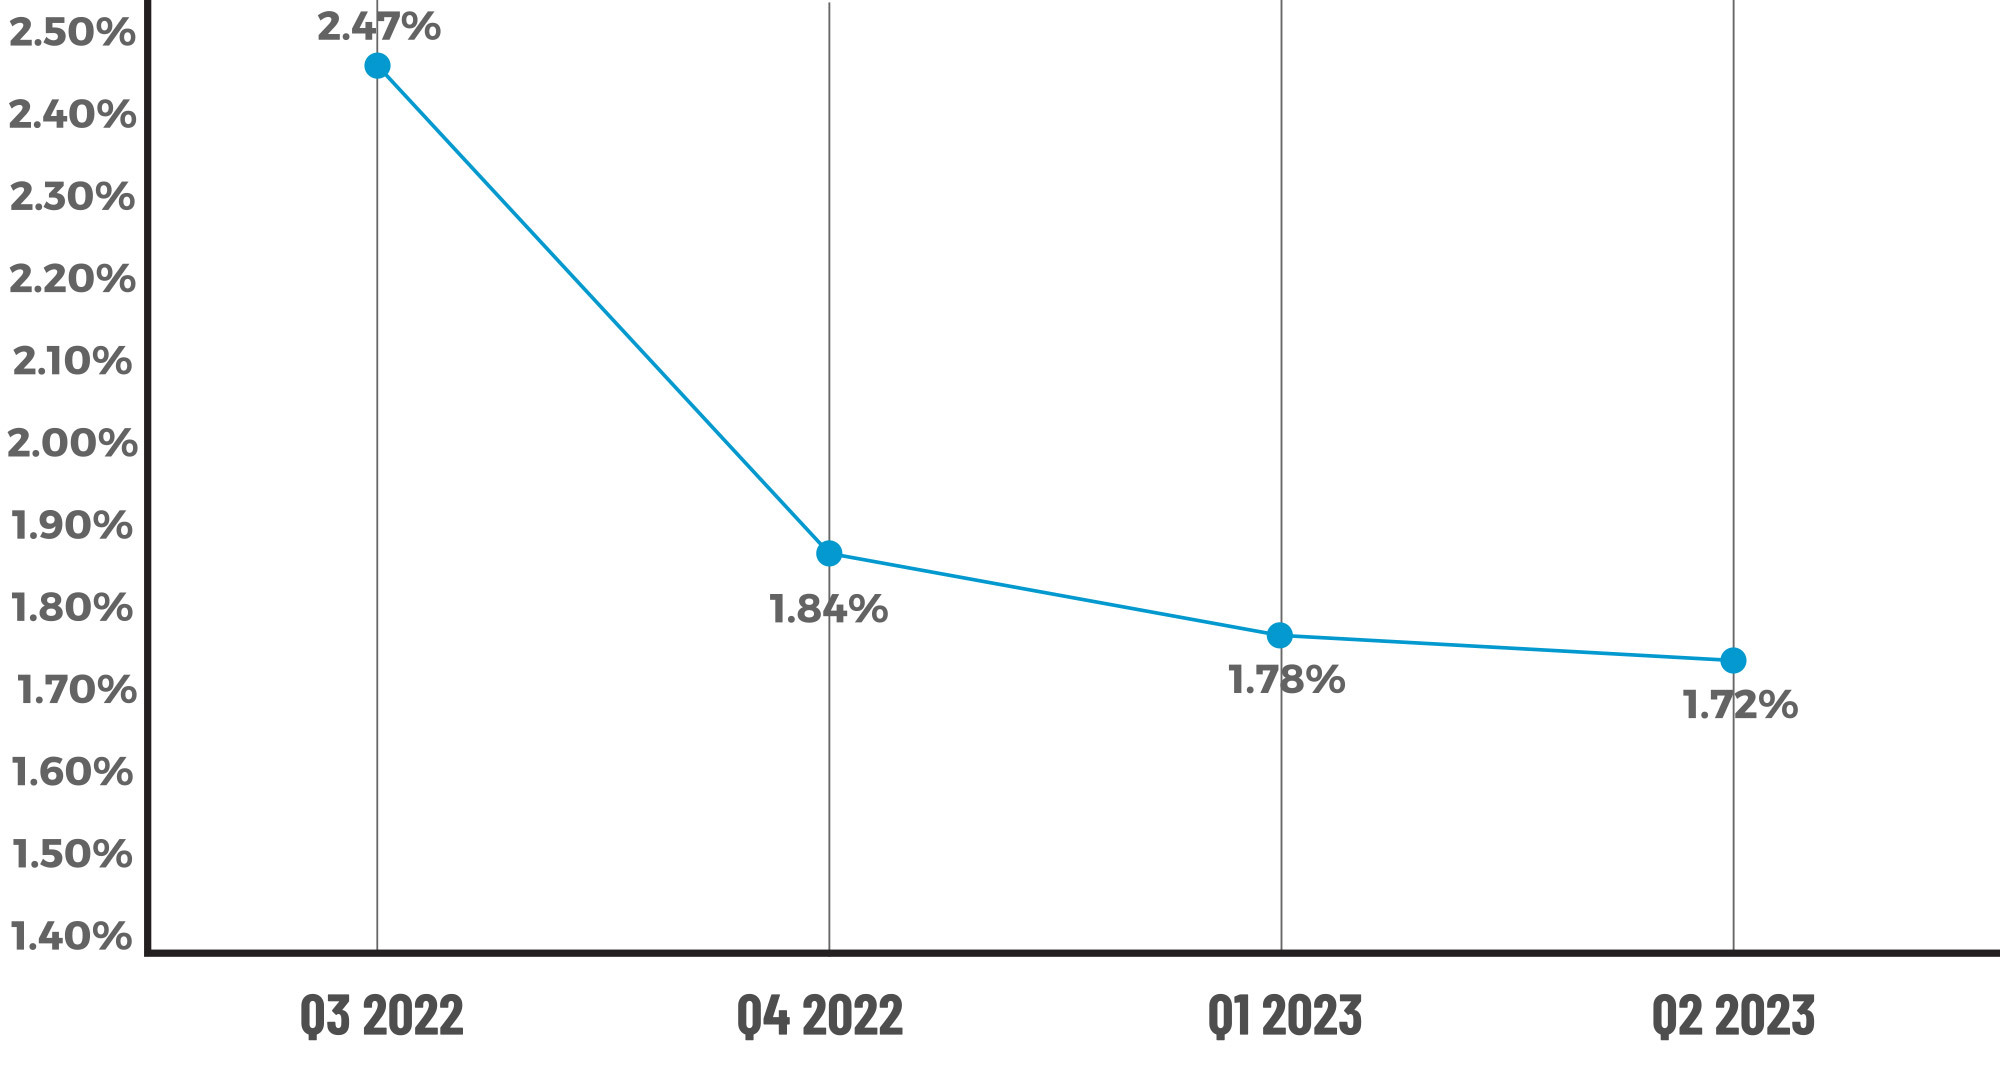
Figure 1 displays the percentage of loans with critical defects by quarter, for Q3 2022 through Q2 2023
QC Trends by Defect Category
Much like death and taxes, the Income/Employment category’s status as the No. 1 area of defects seems inevitable. While defects in this category did decline last quarter, Q2’s findings show that defect share remained relatively steady at 31.25%, declining by less than 1%. Mirroring last quarter’s findings, Assets was the second leading category of defects in Q2 at 15.97% despite improving (albeit modestly) for the second consecutive quarter. Given the interest rate environment and continued rise in property appreciation, it is unsurprising that these areas would continue to challenge lenders the most.
While lenders should keep an eye on these categories, the biggest concern regarding the four core underwriting categories is Credit, which increased 114.34% to end the quarter at 11.81%. Defects also increased in the Liabilities category, but the growth here was moderate, rising only 5.84% to 8.33% of all defects. Historically, these two categories have fallen on the bottom end of the spectrum in terms of defect share. However, this quarter’s increase not only marks the second consecutive quarter of defect growth in these areas but also moves these categories up in the overall rankings to the No. 4 and No. 6 spots, respectively.
The sub-category analysis for Assets, Credit and Income/Employment offers interesting insights – and possible explanations – for performance in these areas. For example, much of the Asset category’s improvement can be attributed to the nearly 40% decline in eligibility-related defects, while the significant gains in this sub-category for the Income/ Employment category seem to have been offset by the improvements in the documentation and analysis sub-categories. Regarding Credit, the main culprit here is the 85% increase in documentation-related defects. While there are roughly 100 topics under this sub-category, the most frequently cited findings include expired credit reports, derogatory information on credit reports, previous bankruptcies and judgements and verification of accounts. Simple errors made, such as aged/expired documents, are concerning in the context of lower underwriting timelines and lower volumes overall. Credit defects of these types expose lenders to repurchase risk, and therefore, we hope that the recent rise in these defects is coincidental and temporary.
As noted in past reports, the Loan Documentation category is historically volatile, often experiencing dramatic swings from one quarter to the next. Thus, seeing this category back in the top three defect categories is unsurprising. However, there are two pieces of good news lenders can infer from this state of affairs. The first is that Legal/Regulatory/Compliance errors – which held the No. 3 spot in last quarter’s report – improved nearly 73% to end Q2 amongst the smallest areas of defects at 3.47%. Second, the spike in Loan Documentation errors is not nearly as dramatic as in previous quarters, increasing 22.07% from 10.24% in Q1 to 12.5% in Q2. Past reports have seen this category comprise double that amount in some cases, so this quarter’s increase warrants simply a watchful eye versus full-blown panic.
Another area of improvement to note in this quarter’s report is the Appraisal category. Q1’s uptick in defects seemed to reflect the growing trend of more aggressive buyback requests from the GSEs for appraisal-related issues. Thus, this quarter’s 26.48% improvement to 3.47% of all defects indicates that lenders are taking this issue seriously and increasing their focus accordingly.
Critical Defects by Fannie Mae Category: Q2 2023
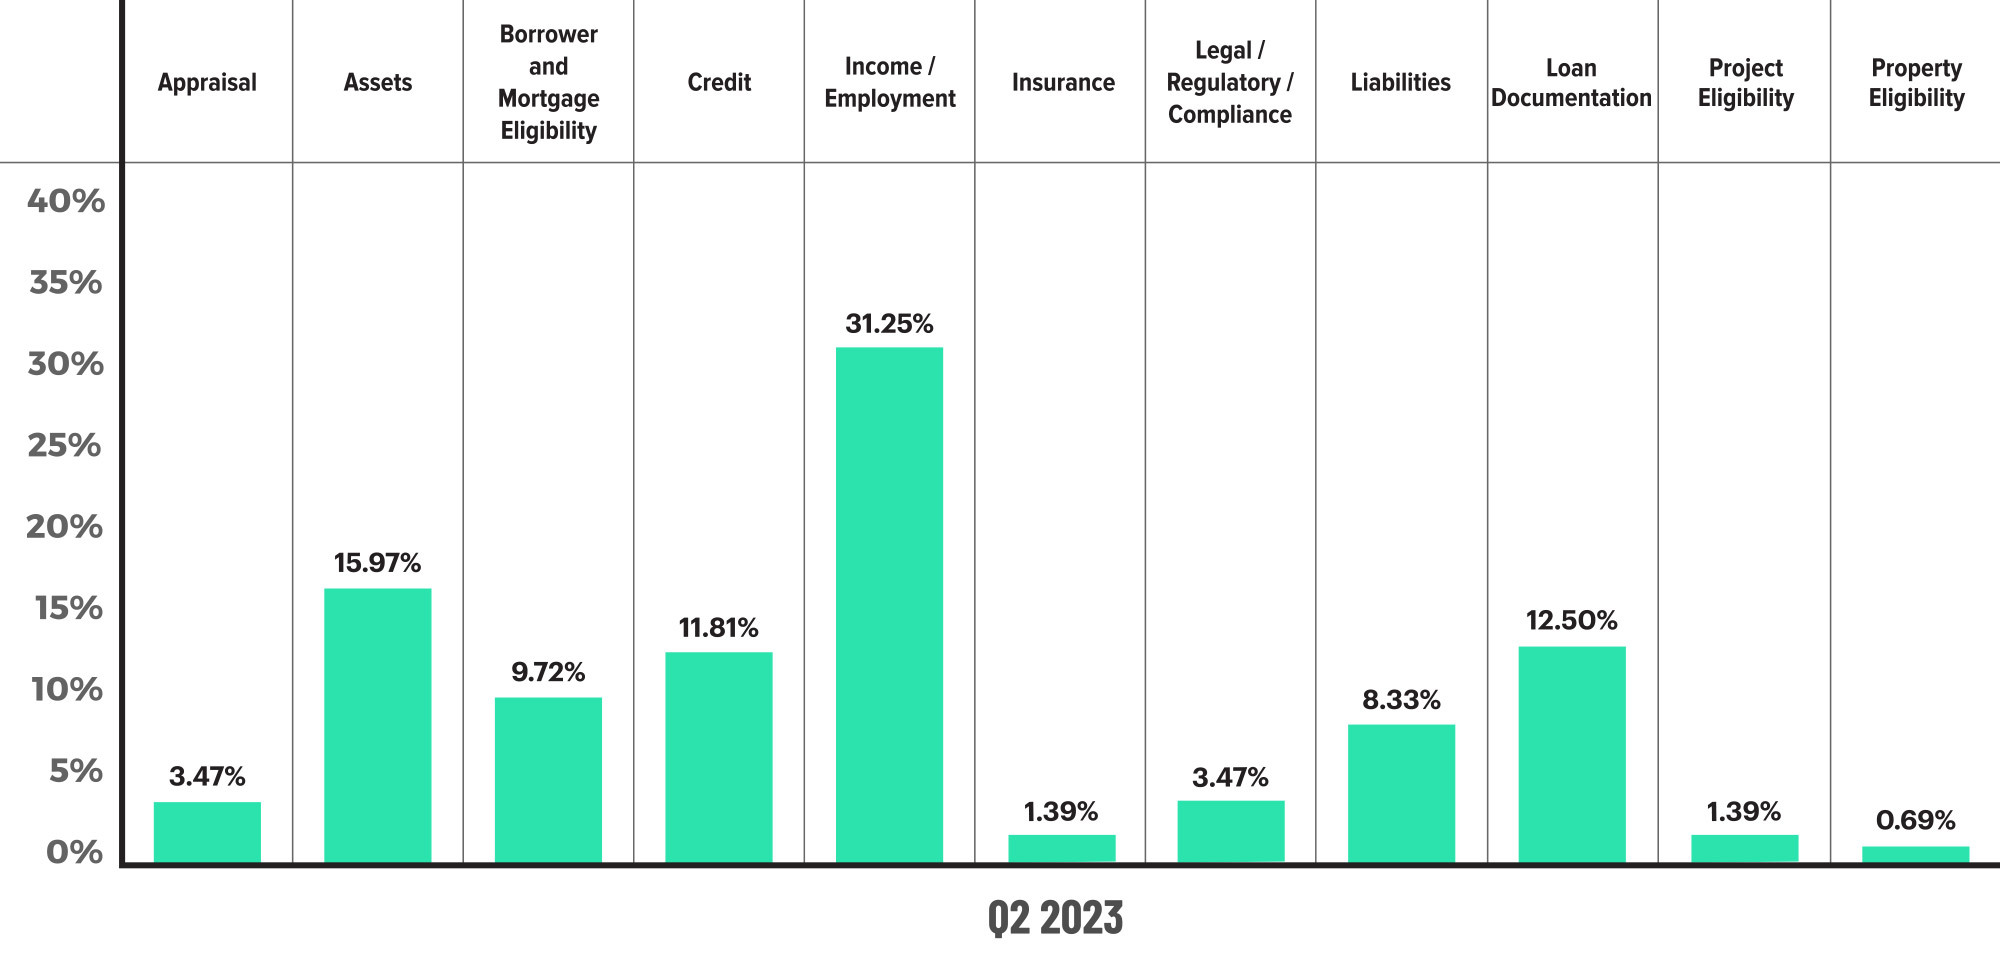
Figure 2 displays the dispersion of critical defects across Fannie Mae categories for Q2 2023.
Critical Defects by Fannie Mae Category: Q1 2023 vs. Q2 2023
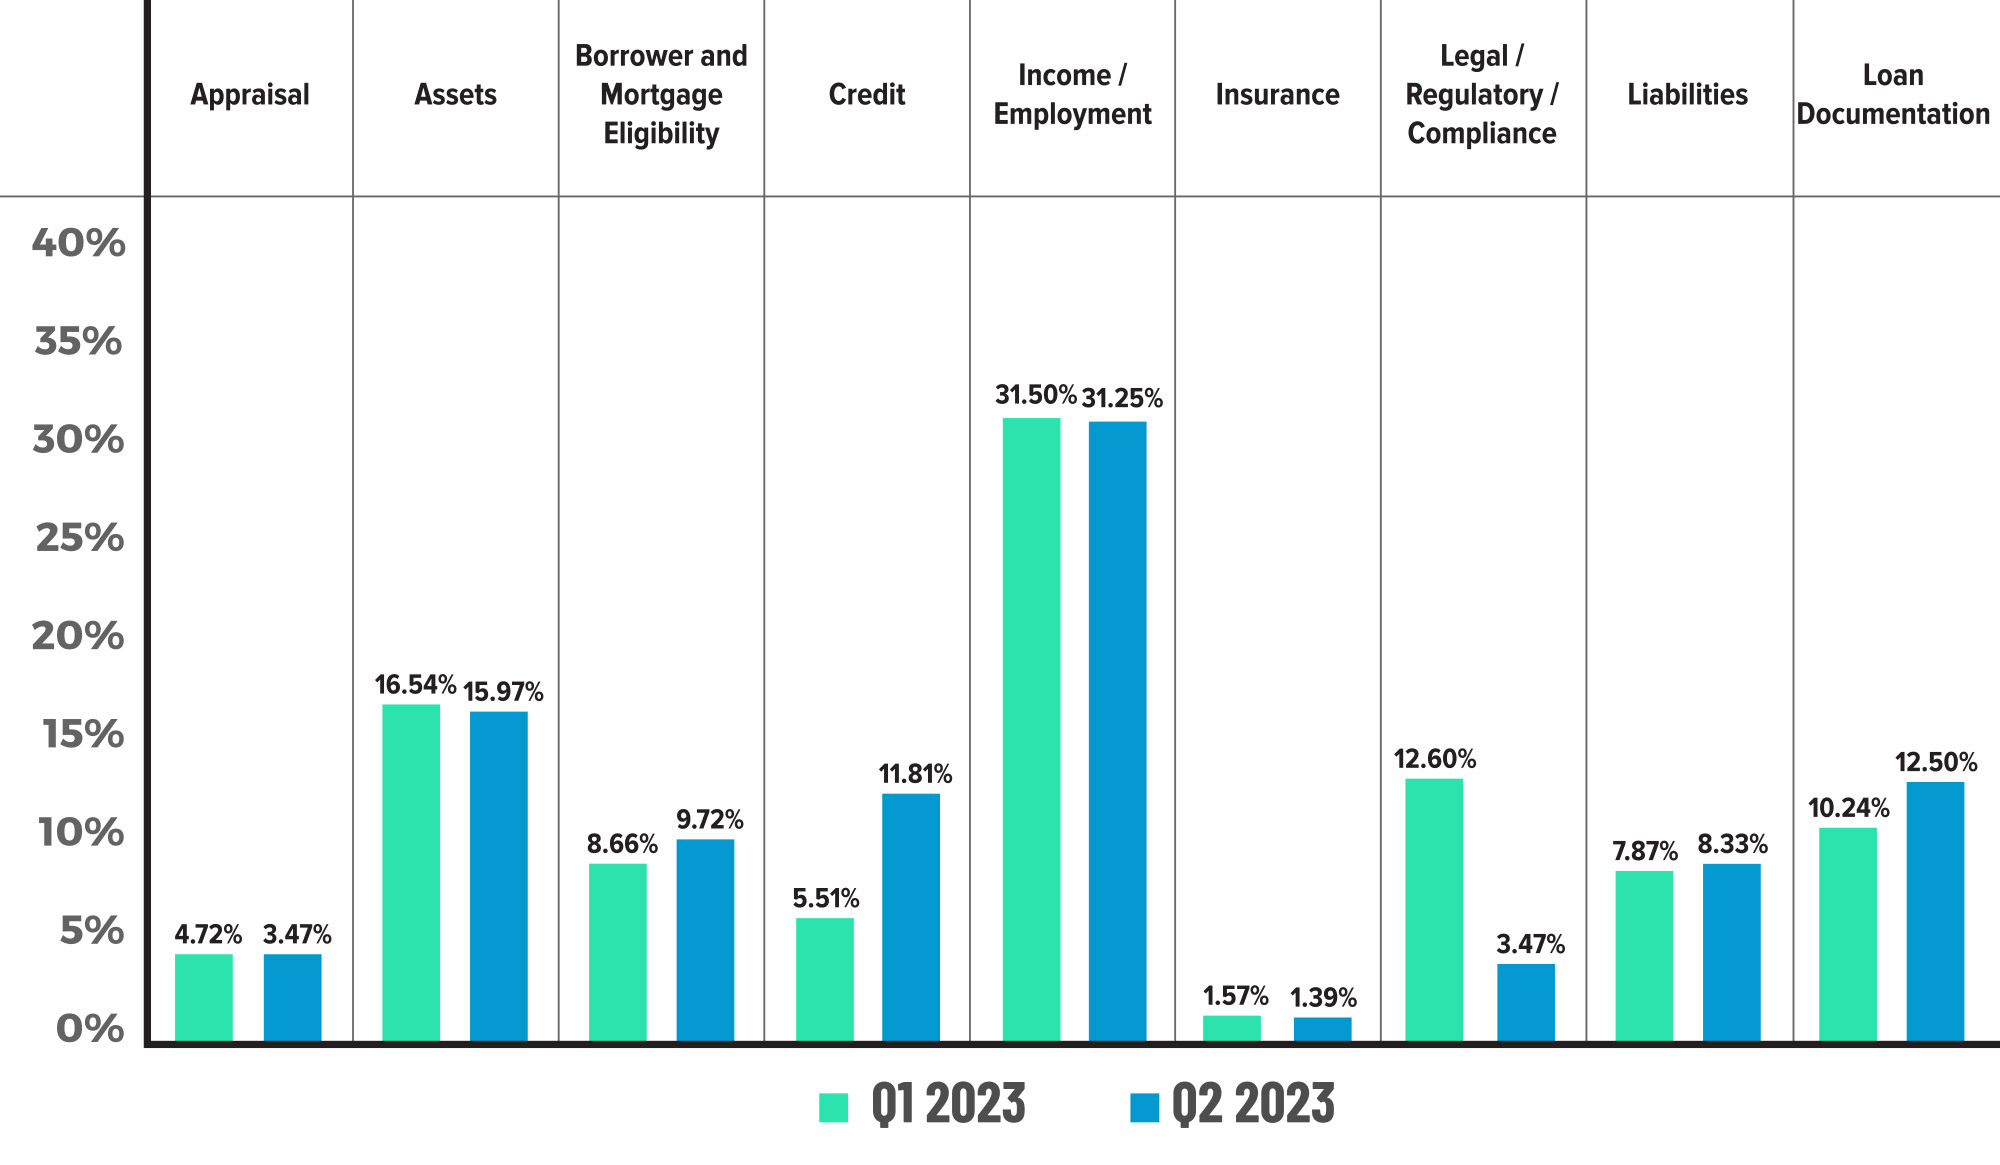
Figure 3 displays the critical defect rate by Fannie Mae category, comparing Q1 2023 to Q2 2023.
Critical Defects by Fannie Mae Sub-Category: Q2 2023
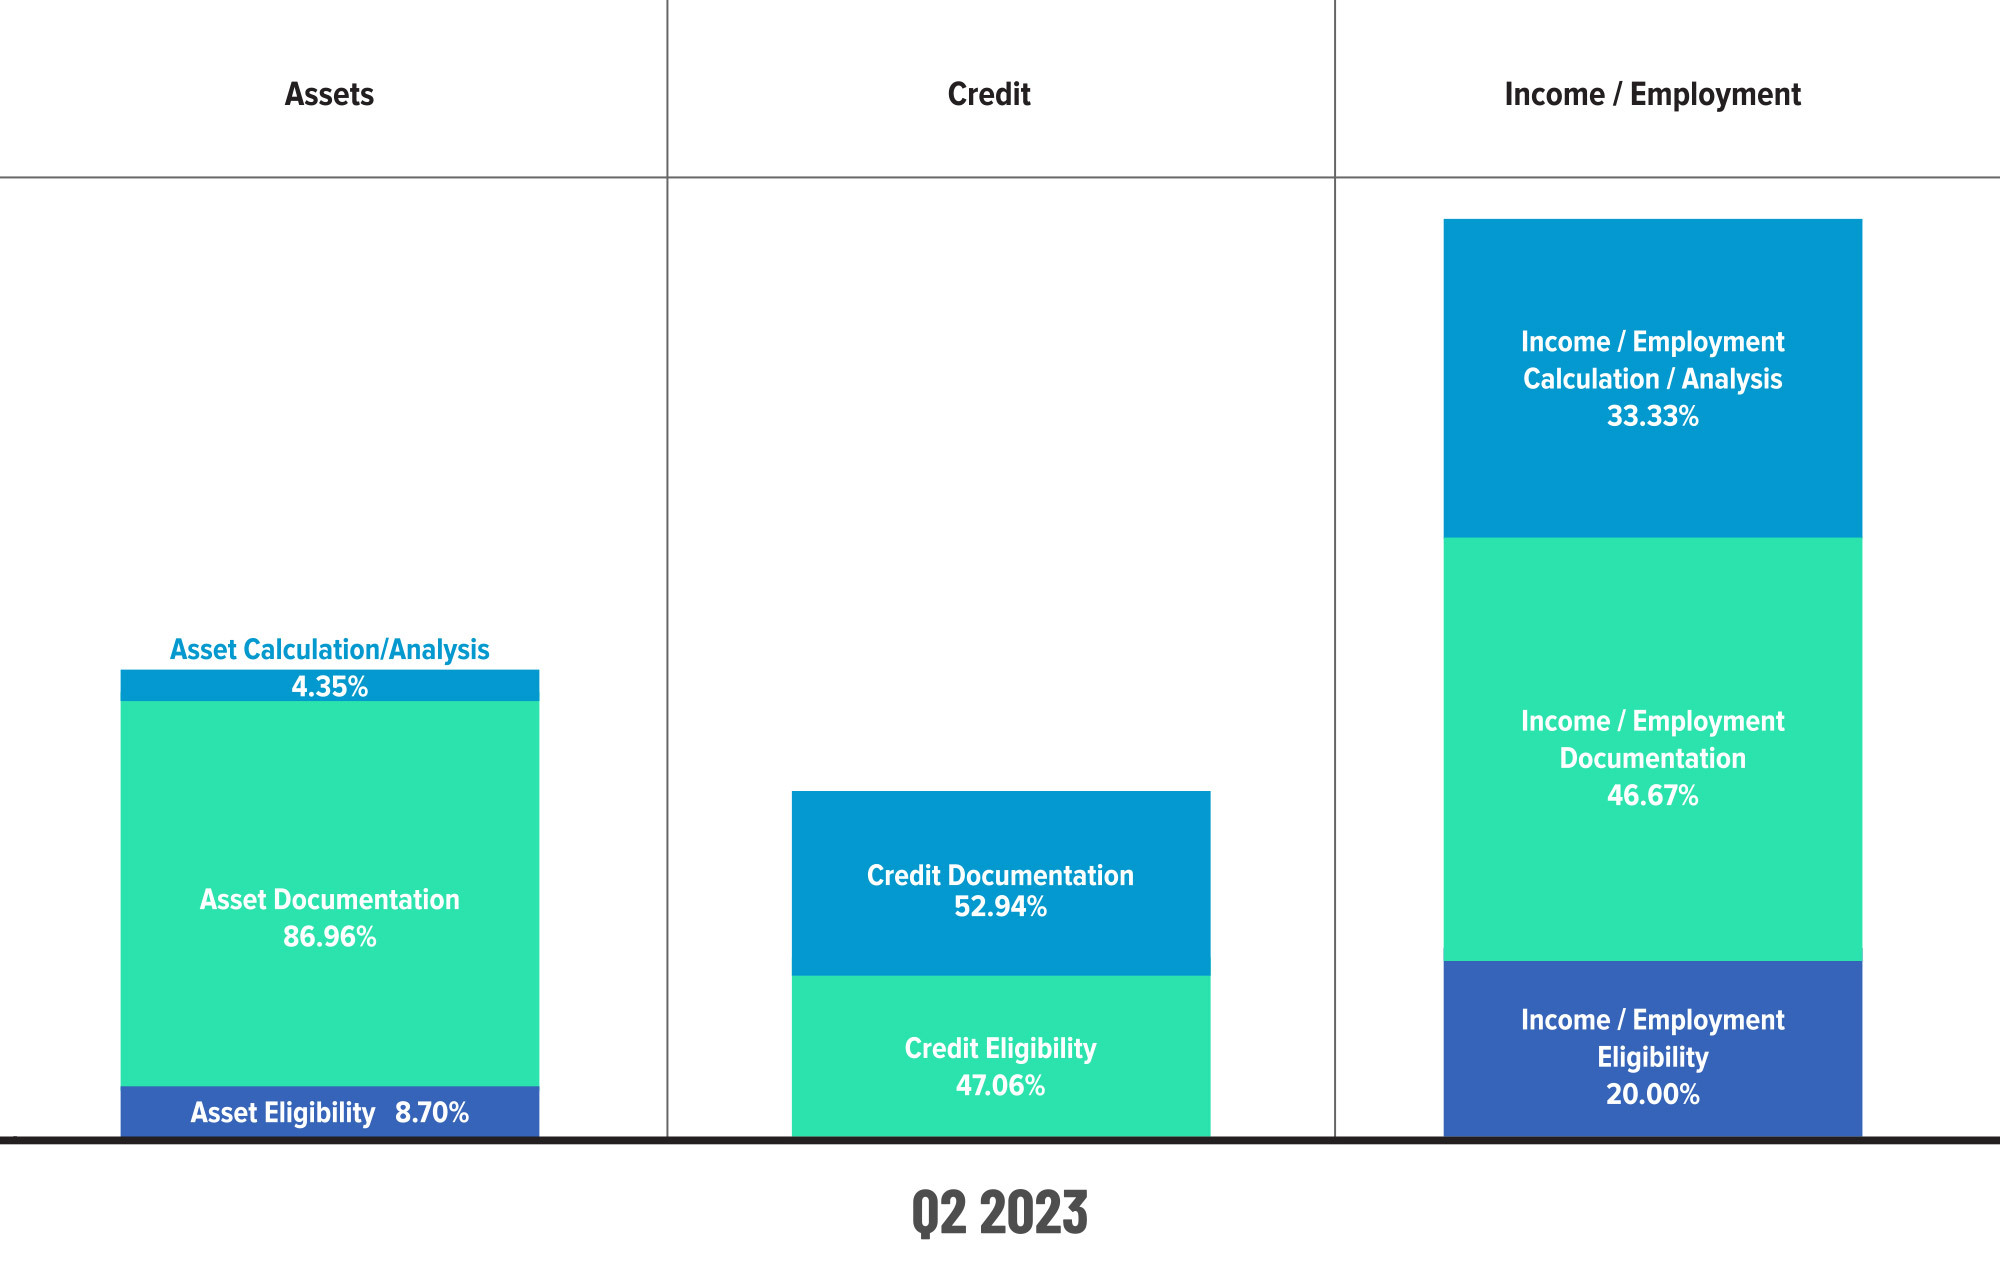
Figure 4 displays sub-category information for Q2 2023 within the Assets, Credit and Income / Employment categories.
Critical Defects by Fannie Mae Sub-Category: Q1 2023 vs. Q2 2023
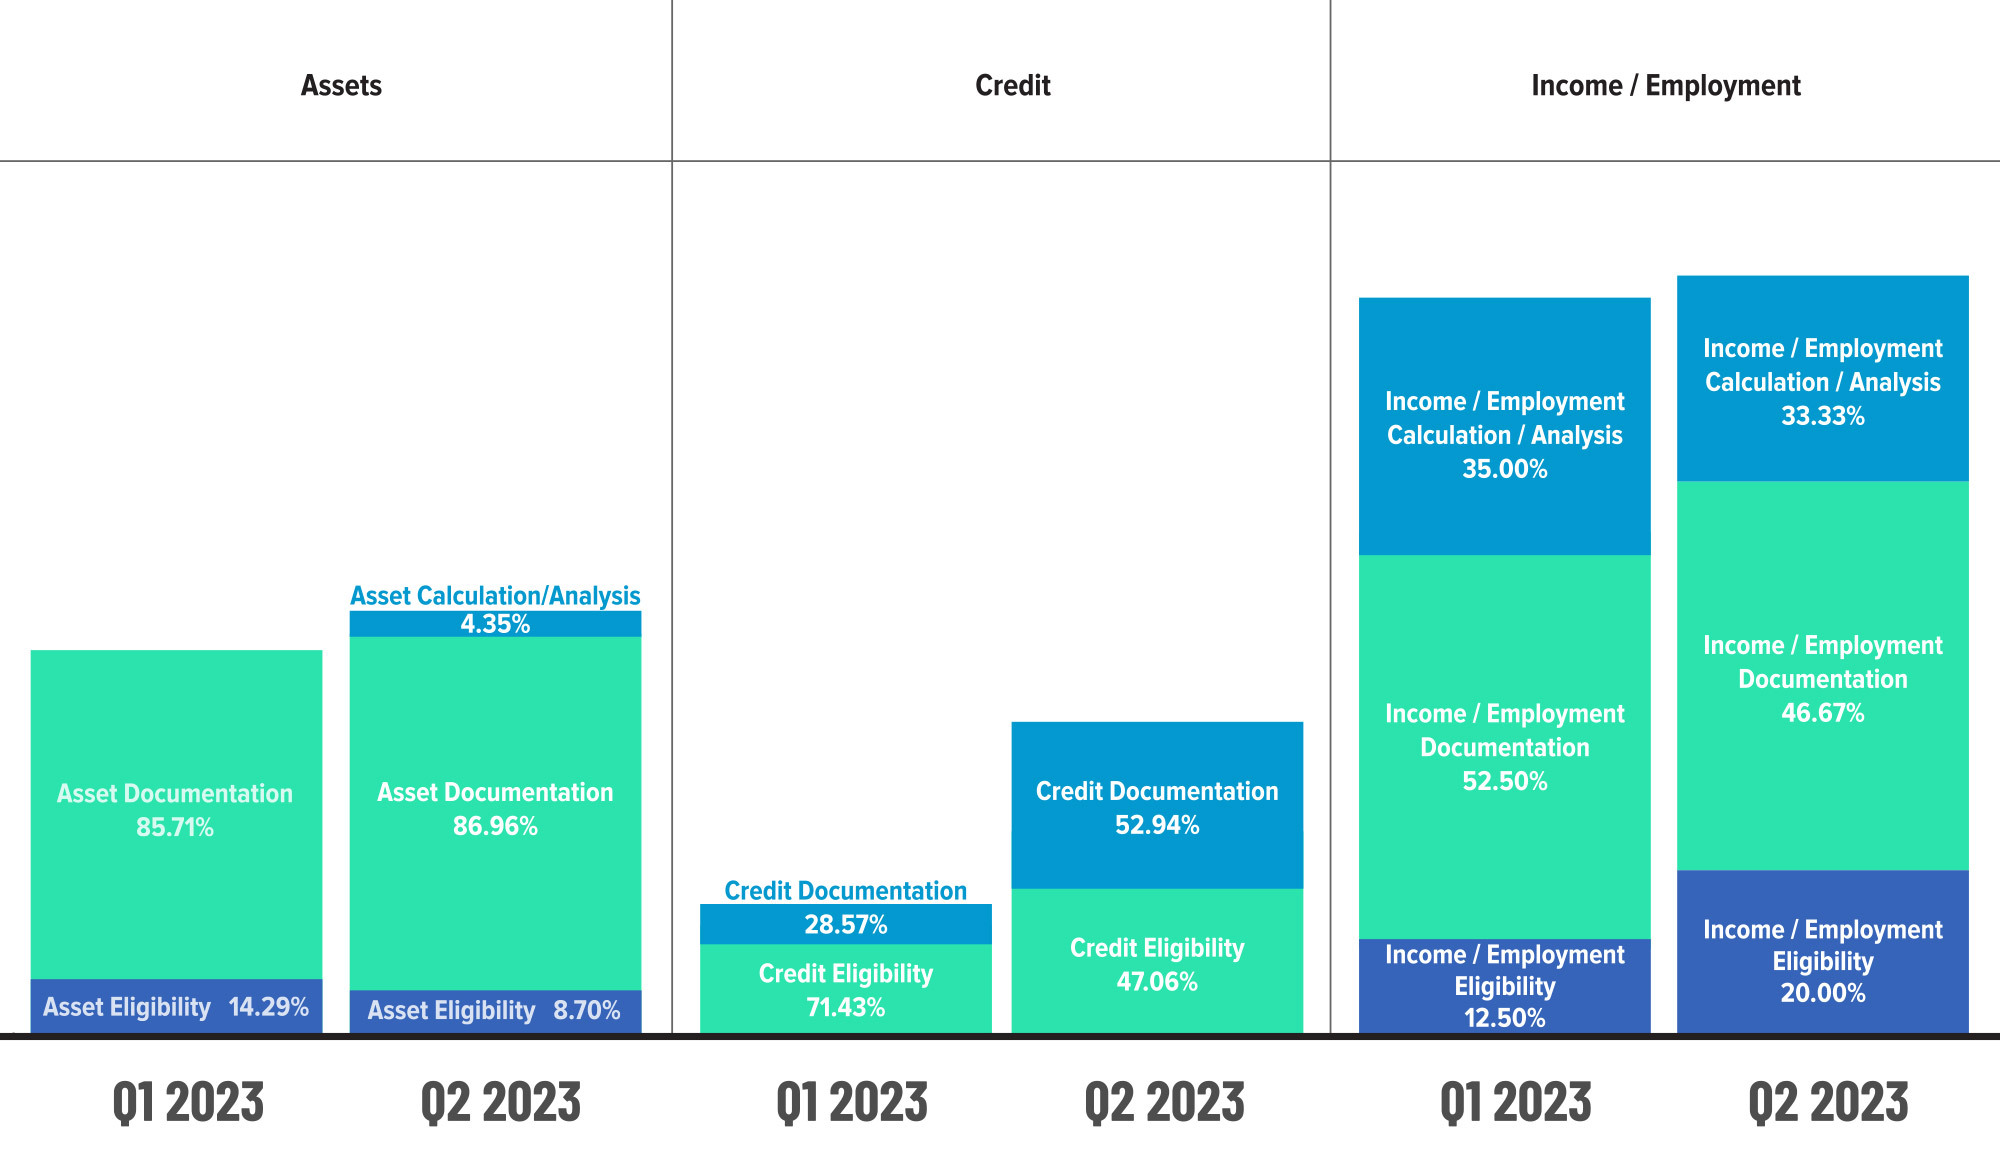
Figure 5 displays sub-category information within the Assets, Credit and Income / Employment categories, comparing Q1 2023 to Q2 2023.
QC Trends by Loan Purpose
To paraphrase the song, “I’m Henry VIII, I Am,” this quarter’s verse is the same as the first (Q1, that is). Both review and defect share for purchase and refinance transactions remained virtually unchanged from last quarter, and both transaction types achieved relative defect parity for the third consecutive quarter.
Defects by Loan Purpose: Q2 2023
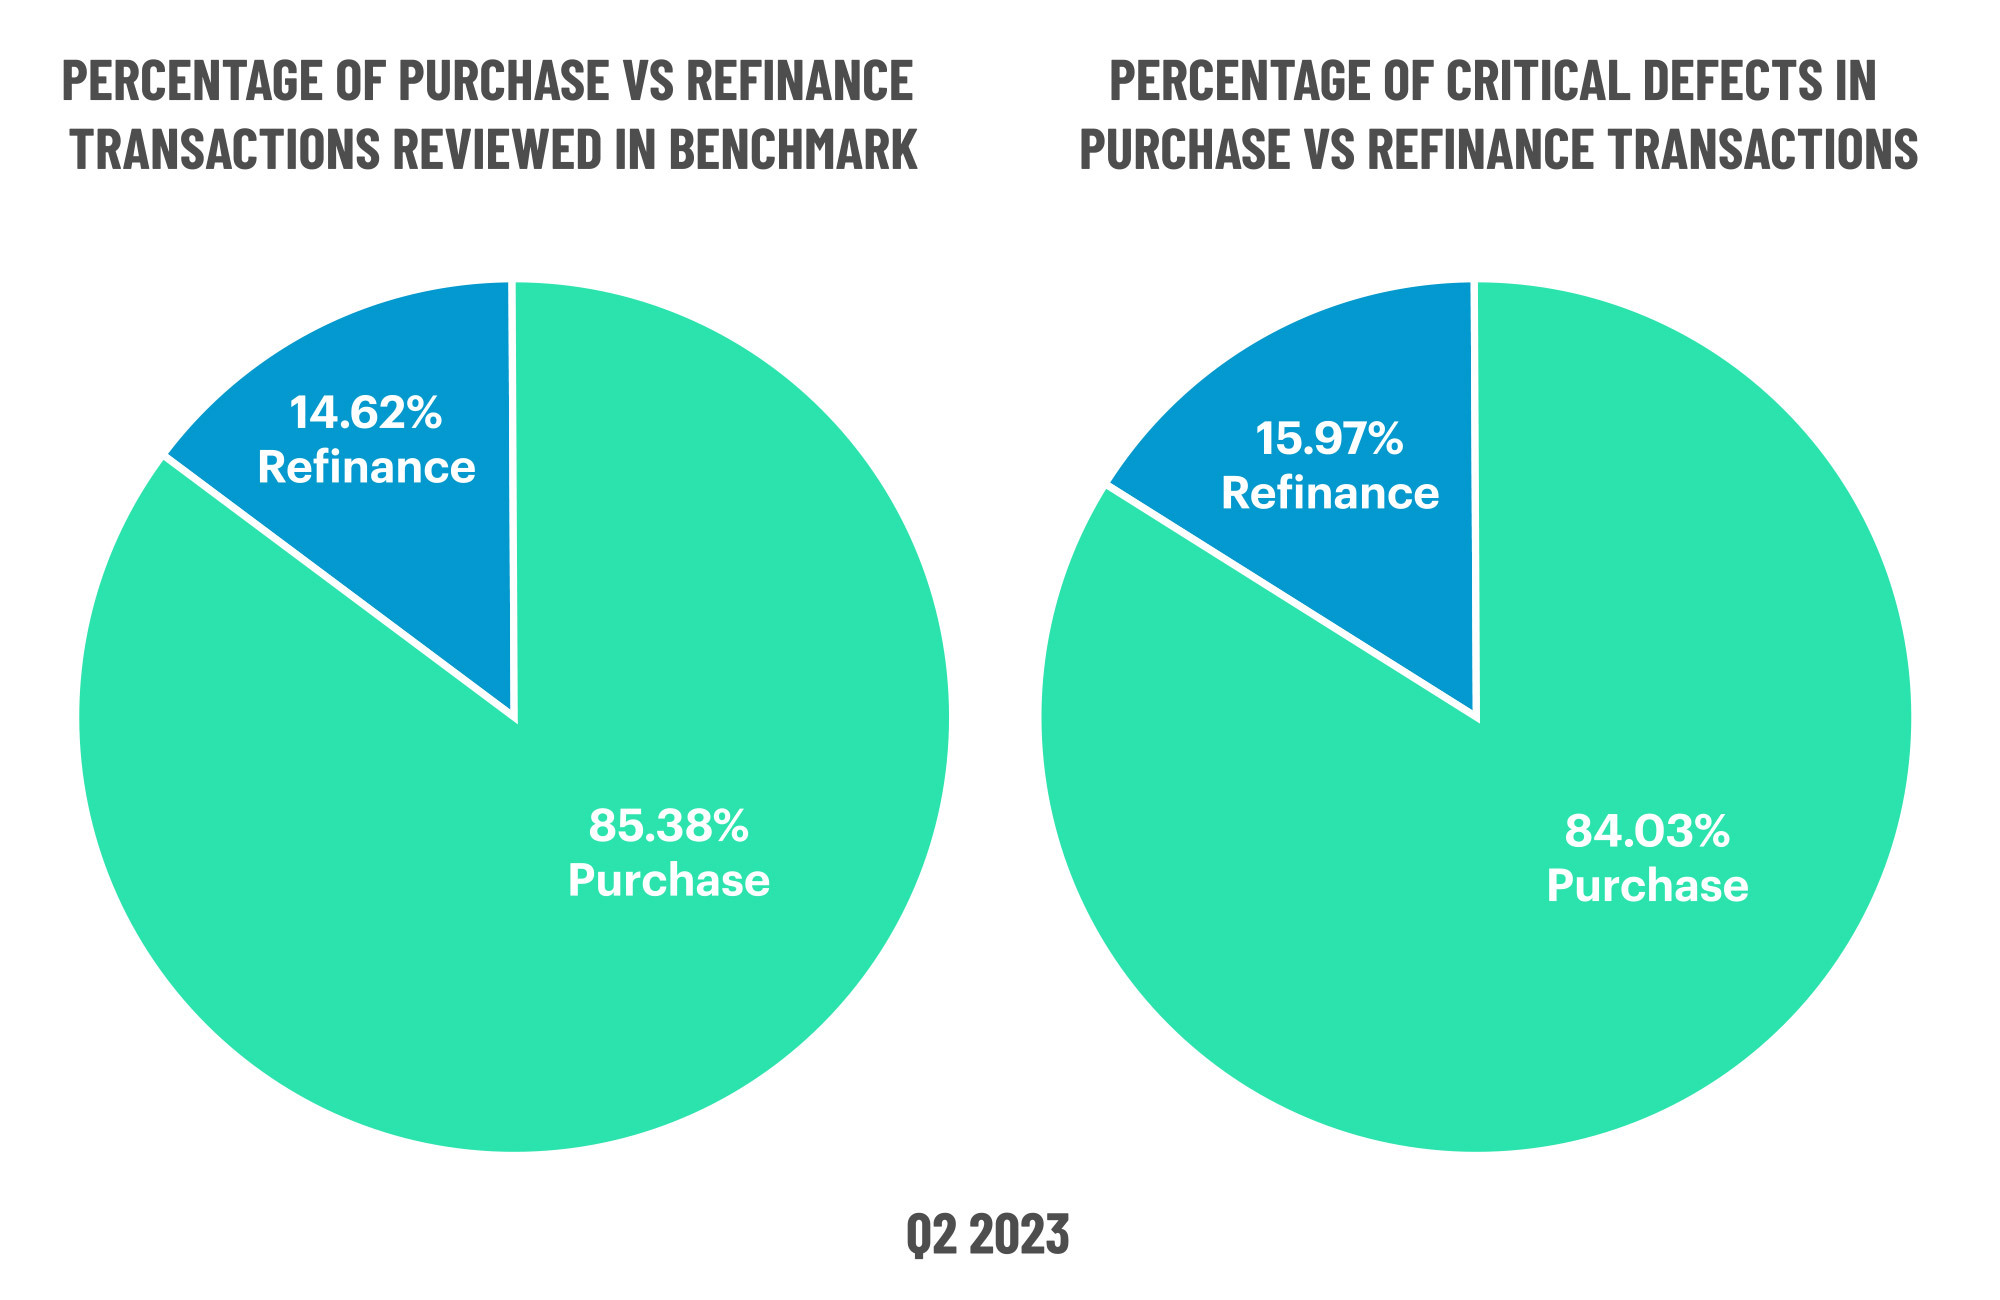
Figure 6 displays the loans reviewed and critical defects by loan purpose for Q2 2023.
QC Trends by Loan Product Type
Review share declined moderately for conventional and FHA loans in Q2 as lenders focused more of their attention on their FHA and VA loan production. The extra vigilance paid off for VA loans, with defect share decreasing by 49.13% to 6.72% overall. The same cannot be said for FHA loans, which experienced a 24.71% increase in defect share to end Q2 at 41.18%. Since FHA loans only comprised 21.86% of review share, this increase indicates a distressing degradation in loan quality.
While there are a multitude of factors likely driving the increase in FHA loan defects, the recent rise in down payment assistance (DPA) programs is one to which lenders should pay close attention moving forward. FHA loans are complicated to originate on their own. Given their purpose and target audience, DPA programs are often paired with FHA loans, and adding such programs can easily add complexity to an already tricky underwriting environment. Many lenders have added these programs to their portfolios to help combat borrowers’ affordability challenges, and increasing opportunities for homeownership amongst first-time and low-to-moderate-income homebuyers is a worthy endeavor. However, lenders must balance this laudable goal with the required compliance and eligibility guidelines to ensure they can continue to offer borrowers these valuable loan programs.
On the brighter side, USDA loan quality continues to rise, with defect share declining 11.11% on the heels of last quarter’s 45% decline. Conventional loan defects also decreased in Q2, dropping 2.83% over the previous quarter to just over 50% of the total defect share.
Defects by Loan Product Type: Q2 2023
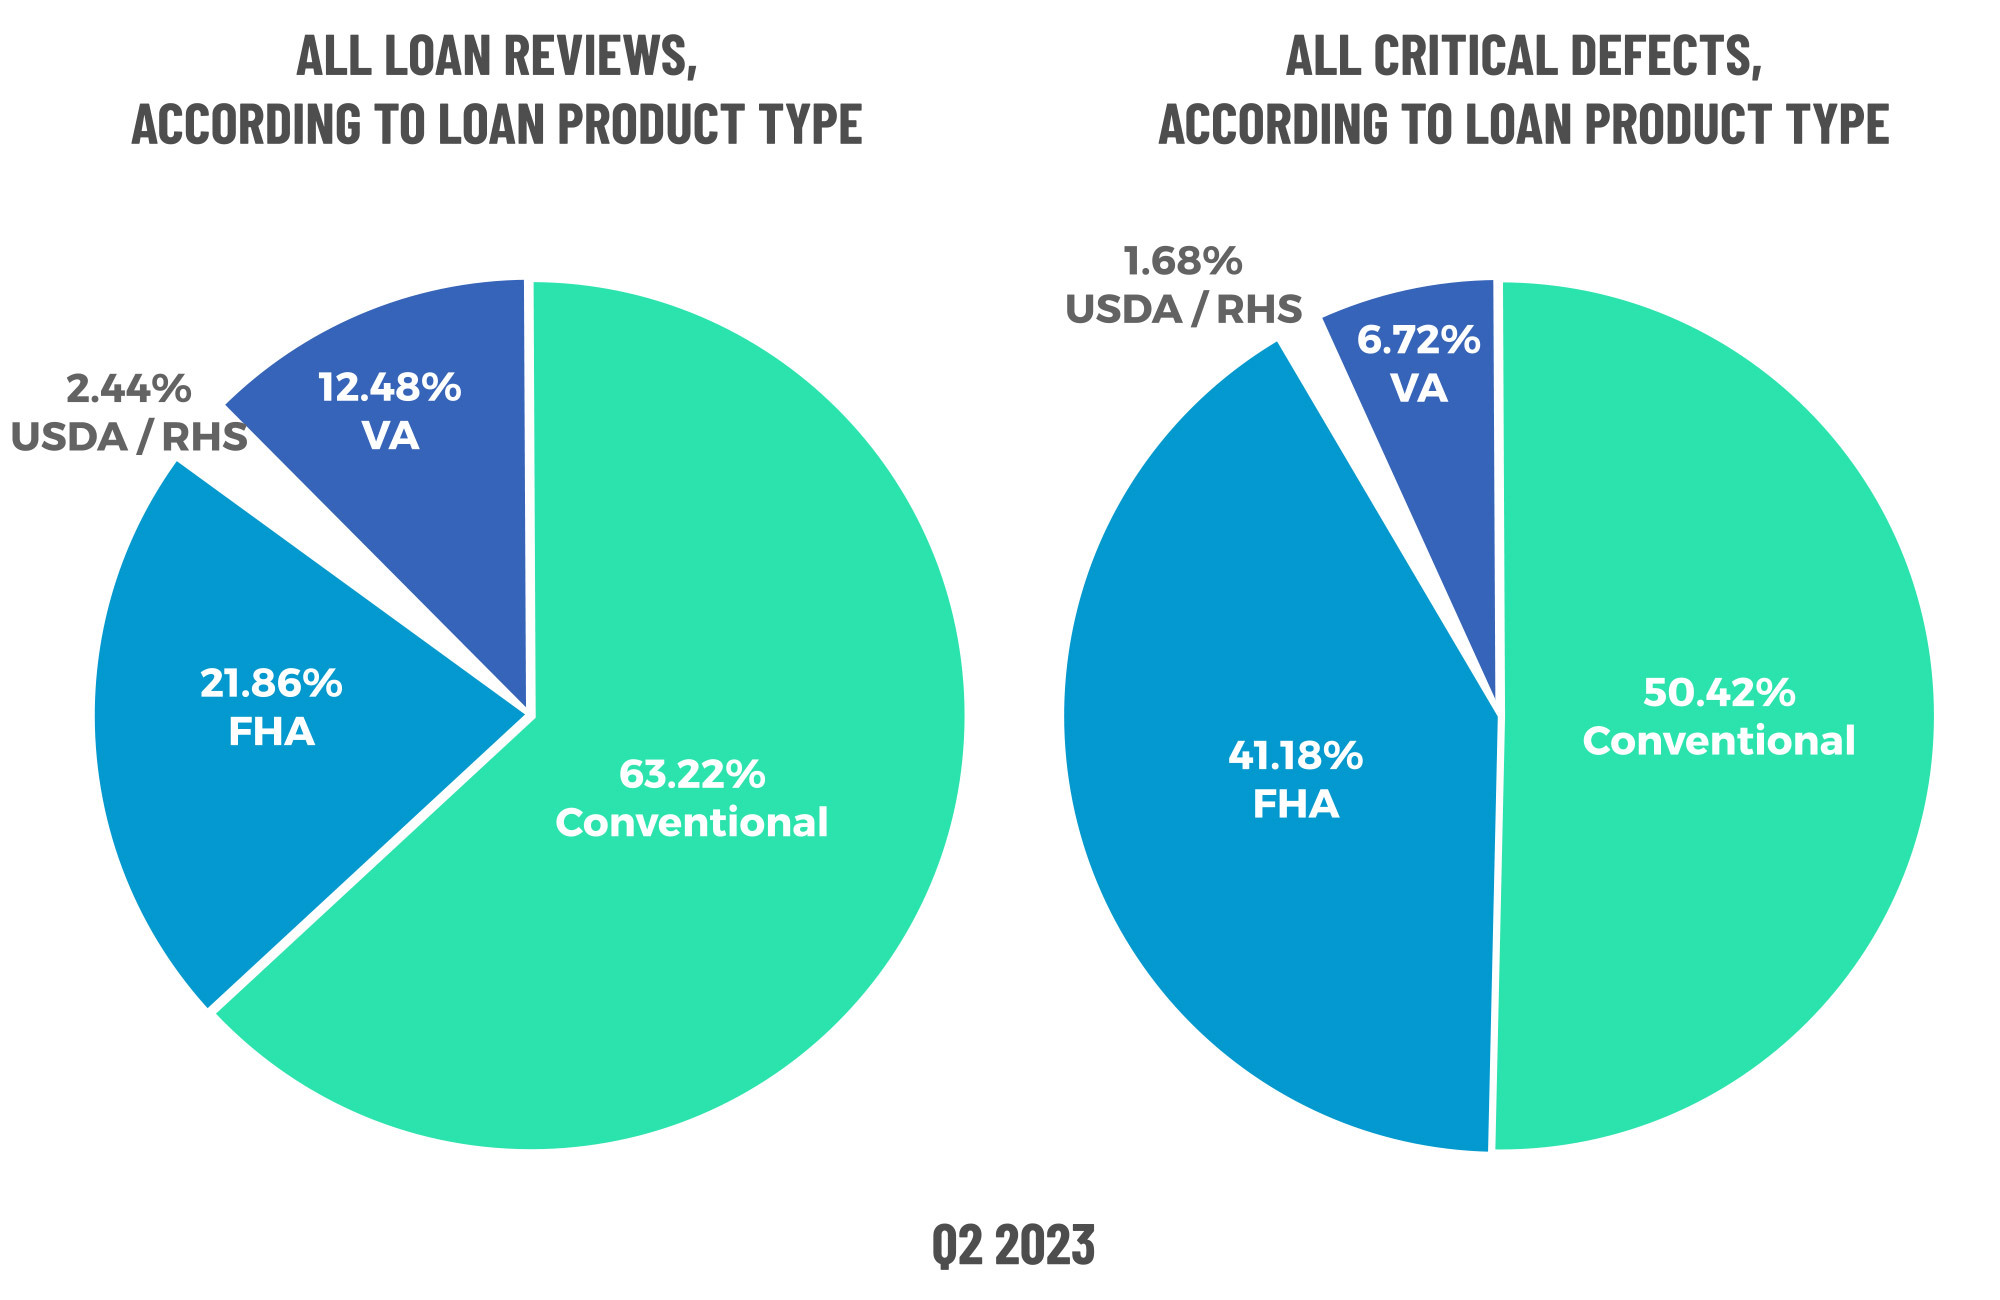
Figure 7 displays the loans reviewed and critical defects by loan type for Q2 2023.
Economic Discussion
“Will there be a recession in 2024?”
If you asked a dozen economists this question right now, you’d likely receive as many answers. Despite all expectations to the contrary, the U.S. economy has avoided entering into a recession in 2023 and may likely do so again in 2024 – which would indicate that the Federal Reserve Bank’s aggressive increases to the Fed Funds Rate struck the right balance between cooling off the economy without triggering a recession.
As a result, delinquencies remain at historic lows despite the rate environment. One of the main drivers here is strong property valuations. If homeowners lose their jobs and get behind in their mortgage payments or cannot refinance out of an adjustable-rate mortgage they can no longer afford, they can simply sell rather than go delinquent and enter into foreclosure.
However, there is some softness in early-stage delinquencies. Data from the end of Q2 2023 showed a 2.2% increase in borrowers who missed one payment and a 1.7% increase in those who missed two3. While this trend has reversed course in early Q4, with 30-day delinquencies declining for the first time since mid-Q2, this is still an area to watch, as foreclosure starts increased in early Q4 despite the overall improvement in delinquencies4.
Of course, it’s nearly impossible to discuss the interest rate environment and not address the spread between the 10-year Treasury bond rates and the average 30-year fixed-rate mortgage. By the end of Q2, the spread between these two rates was as high as it had ever been, reaching 2.96 percentage points5. Historically, mortgage rates largely track with the 10-year Treasury rates, but in this case, mortgage rates have moved up faster than the 10-year Treasury yield, creating tremendous turmoil in the mortgage secondary markets.
To put this in greater perspective, the spreads observed in June 2023 and October/November 2022 are the two highest on record since 1997. The previous two spikes that even come close to this occurred during the late-2000s housing crisis and the start of the COVID-19 pandemic. However, what goes up must come down, and that’s precisely what has happened over the last few months as mortgage interest rates continue inching closer to the sub-7% mark.
3 https://www.blackknightinc.com/data-reports/first-look-at-june-2023-mortgage-data/
4 https://www.blackknightinc.com/data-reports/first-look-at-november-2023-mortgage-data/
5 https://www.brookings.edu/articles/high-mortgage-rates-are-probably-here-for-a-while/
Conclusion
Hindsight is usually 2020...or, in this case, 2023. The second quarter of this year proved to be a bright spot, though those in the thick of it might not have recognized it as such at the time. The critical defect rate continued to improve even as volumes ticked upward, which bodes well for the long-term performance of those assets. With continued predictions for a more robust origination environment in 2024 on the back of declining interest rates, the future looks bright for the lenders that have managed to survive. Of course, future survival is never guaranteed – a lesson the past year has so eloquently and brutally taught. Thus, as always, we implore all lenders to keep quality at the center of their operations to ensure a safe, sound and prosperous new year.
About the ACES Mortgage QC Industry Trends Report
The ACES Mortgage QC Industry Trends Report represents a nationwide post-closing quality control analysis using data and findings derived from mortgage lenders utilizing the ACES Analytics benchmarking software.
This report provides an in-depth analysis of residential mortgage critical defects as reported during post-closing quality control audits. Data presented comprises net critical defects and is categorized in accordance with the Fannie Mae loan defect taxonomy.
About ACES
ACES Quality Management is the leading provider of enterprise quality management and control software for the financial services industry. The nation’s most prominent lenders, servicers and financial institutions rely on ACES Quality Management & Control® Software to improve audit throughput and quality while controlling costs, including:
- 4 of the top 5 and more than 60% of the top 50 independent mortgage lenders;
- 8 of the top 10 loan servicers;
- 11 of the top 30 banks; and
- 3 of the top 5 credit unions in the USA.
Unlike other quality control platforms, only ACES delivers Flexible Audit Technology, which gives independent mortgage lenders and financial institutions the ability to easily manage and customize ACES to meet their business needs without having to rely on IT or other outside resources. Using a customer-centric approach, ACES clients get responsive support and access to our experts to maximize their investment.
For more information, visit www.acesquality.com or call 1-800-858-1598.
Media Contact: Lindsey Neal | DepthPR for ACES | (404) 549-9282 | lindsey@depthpr.com
View all reports