ARMCO’s Mortgage QC Industry Trends Report represents an analysis of nationwide quality control findings based on data derived from the ACES Analytics benchmarking software.
Executive Summary
QC Industry Trends – Overview
QC Industry Trends – by Category
QC Industry Trends – by Loan Purpose
QC Industry Trends – by Loan Type
Conclusion
About this Report
Executive Summary
This report utilizes information derived from loan files analyzed by the ACES Analytics benchmarking system to provide defect-related mortgage quality control data for Q3 2017.
Findings for the Q3 2017 Trends Report were based on post-closing quality control data from just under 100,000 closed loans that identified more than 125,000 defects. All reviews and defect data that were evaluated for this report were based on loan audits selected by lenders for full file reviews.
Defects are categorized using the Fannie Mae loan defect taxonomy. Data for any given calendar quarter is analyzed no earlier than 90 days after the end of the quarter, which allows sufficient elapsed time for the post-closing quality control cycle to be completed. Hence, the analysis for Q3 2017 is released by ARMCO in Q2 2018.
Summary of Findings
Q3 reported the first decline in the critical defect rate for 2017. The leading critical defect categories were (1) Borrower and Mortgage Eligibility, (2) Credit, and (3) Income/Employment. The percentage of purchase transactions declined in Q3 but still dominated refinance transactions, accounting for over 67% of loans reviewed within the benchmark.
Report highlights include:
- The Q3 critical defect rate declined 6% from the previous quarter, revealing the first decrease in this rate for 2017.
- The percentage of purchase transactions declined in Q3.
- Purchase transactions and FHA loans accounted for a disproportionately higher number of critical defects in Q3.
QC Industry Trends – Overview
The critical defect rate decreased by 6%, from 1.76% in Q2 to 1.65% in Q3. This represents the first decrease in this rate for 2017.
NOTE: A critical defect is defined as a defect that would result in the loan being uninsurable or ineligible for sale. The critical defect rate reflects the percentage of loans reviewed for which at least one critical defect was identified during the post-closing quality control review and all reported defects are net defects.
Figure 1 displays critical defect rates—the number of loans containing at least one critical defect as a percentage of the total closed loans reviewed—for the past four calendar quarters. All loans reviewed are part of a lenders’ monthly random post-closing quality control review.
Critical Defect Rate: Q4 2016 – Q3 2017
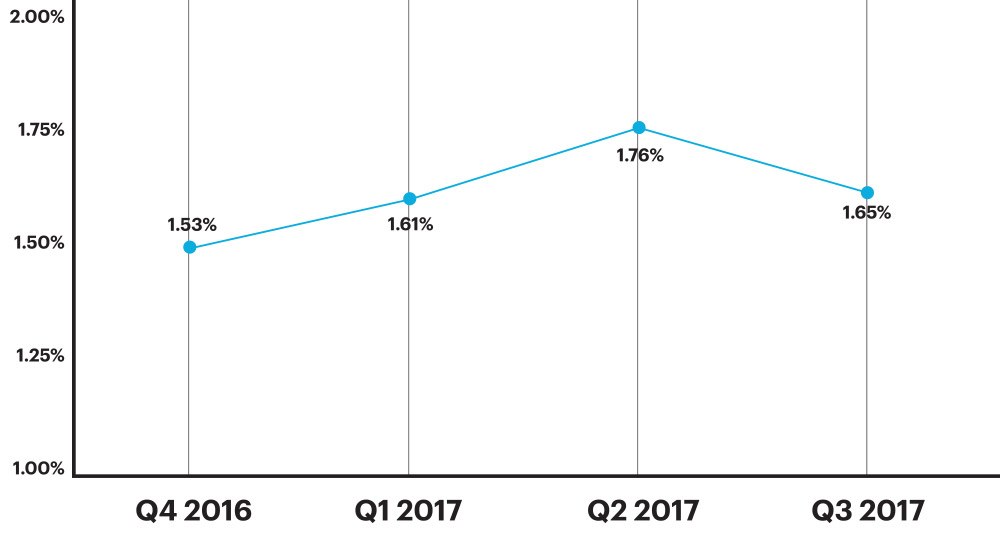
Figure 1: Percentage of loans with critical defects by quarter, Q4 2016 through Q3 2017
QC Industry Trends by Category
In keeping with a trend reported in the previous two quarters, the reported net critical defects for Q3 2017 appear to be affiliated primarily with the process of underwriting a mortgage loan.
The categories of Borrower and Mortgage Eligibility, Credit, and Income/Employment—which are all facets of the underwriting process—comprised almost 60% of all critical defects reported in Q3 2017. Of the 60%, Borrower and Mortgage Eligibility accounted for more than one third with 23% of all reported critical defects. Credit accounted for 22% of all reported critical defects, and Employment/ Income accounted for 14%.
Figure 2 shows all reported net critical defects, ranked according to Fannie Mae defect category.
Critical Defects by Fannie Mae Category, Q3 2017
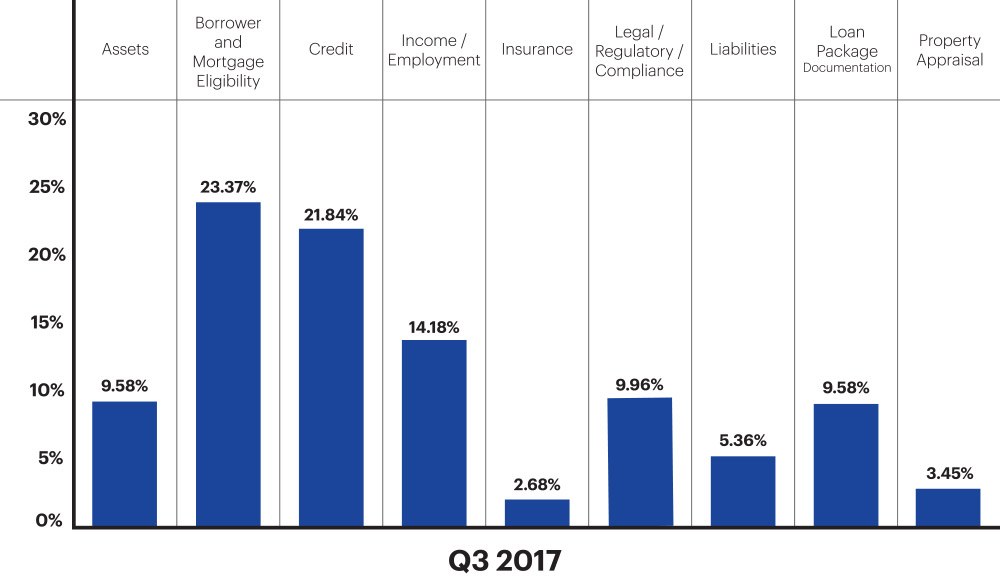
Figure 2: Q3 2017 net critical defects according to Fannie Mae defect category
QC Industry Trends – By Loan Purpose
In Q3 2017, purchase transactions accounted for just over 67% of all reviewed loans, but over 72% of all reported critical defects. This imbalance — the ratio of critical defects in purchase transactions, versus the ratio of purchase transactions as a percentage of the benchmark — indicates that critical defects were attributed more to purchases than to refinances in Q3. This finding supports the tenet that the greater complexity associated with purchase transactions is associated with a greater number of critical defects.
Figure 3 provides a comparison of all reviewed loans by loan purpose and all critical defects by loan purpose.
Loans Reviewed by Loan Type vs. Critical Defects by Loan Type

Figure 3: Q3 2017 Loans reviewed, categorized by loan purpose and critical defects, categorized by loan purpose
QC Industry Trends – Critical Defect Rates in Relation to Percentage of Purchase Transactions
In Q3, the critical defect rate dropped slightly as compared to previous quarters, which coincides with an increase in the percentage of refinances of overall closed loans. During the first two quarters of 2017, the critical defect rate was on a steady upswing as the percentage of purchase transactions comprising total closed loan market share continued to increase. This indicates a direct correlation between the rate of critical defects and the percentage of purchase transactions.
The correlation between the critical defect rate and the market share of purchase vs refinance transactions in any given quarter is not surprising. The added complexity in the origination process for purchase transactions lends itself to a greater risk of critical defects. We can continue to expect that, barring improvements in lender processes or external impacts such as regulatory changes, defect rates will trend upward in a purchase-driven market and downward as market share tilts toward refinancing.
Figure 4 compares the number of purchase transactions as a percentage of the overall market, to the critical defect rate over the past four quarters.
Critical Defect Rate and Purchase Transaction Percentages, Q4 2016 – Q3 2017
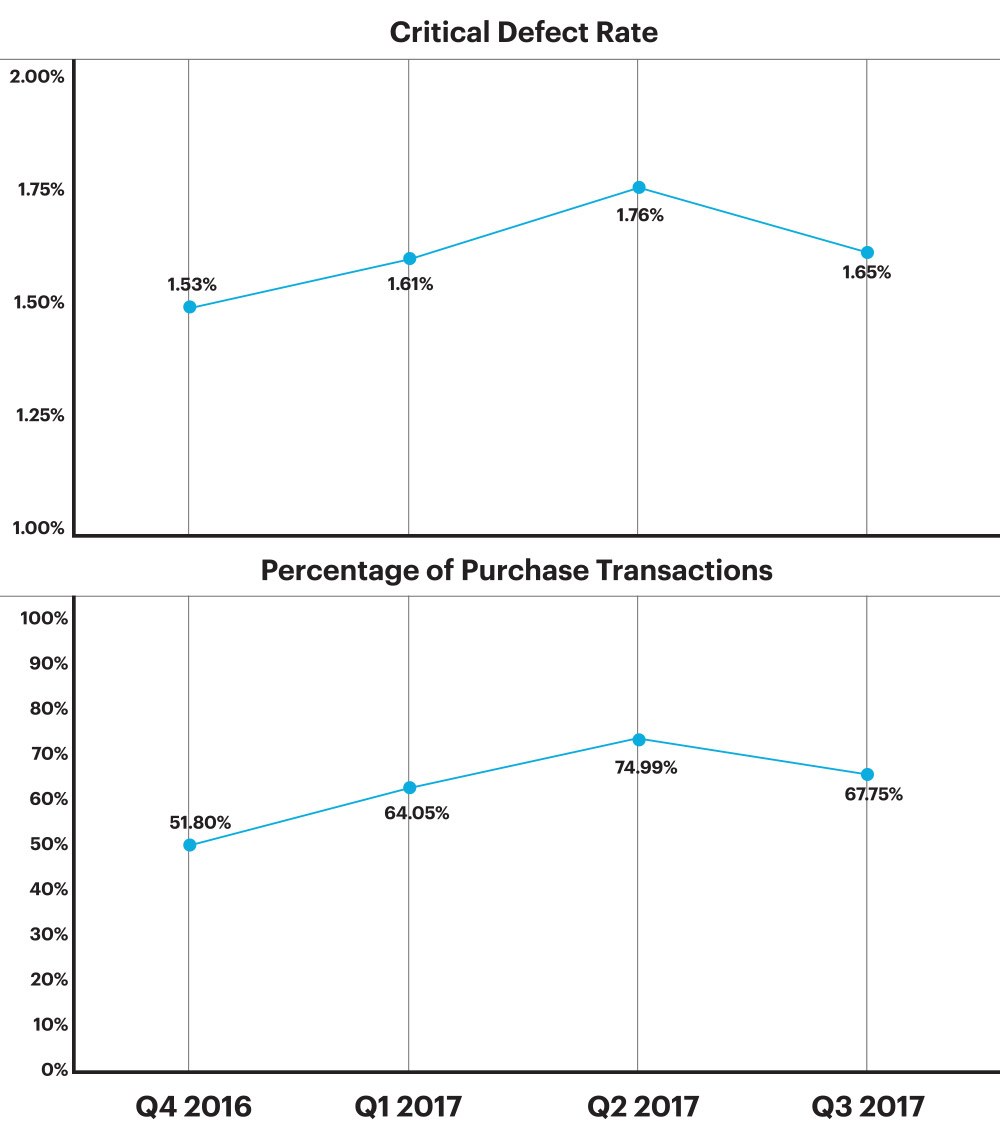
Figure 4: Critical defect rate vs percentage of purchase transactions for the past four quarters
QC Industry Trends – By Loan Type
In Q3 2017, conventional loans accounted for 56.2% of all loans reviewed. FHA loans accounted for 26.9%, VA loans, for 11.7% and USDA loans, for 5.2%. The distribution of critical defects among loan types did not directly correlate to the distribution of loans reviewed. Most notably, FHA loans accounted for just under 27% of the loans reviewed but represented over 37% of all loans containing critical defects.
Figure 5 charts all loans in the benchmark by loan type in comparison with all critical defects by loan type. (Conventional, FHA, VA and USDA)
Critical Defects as a Percentage of All Loan Types, Q3 2017
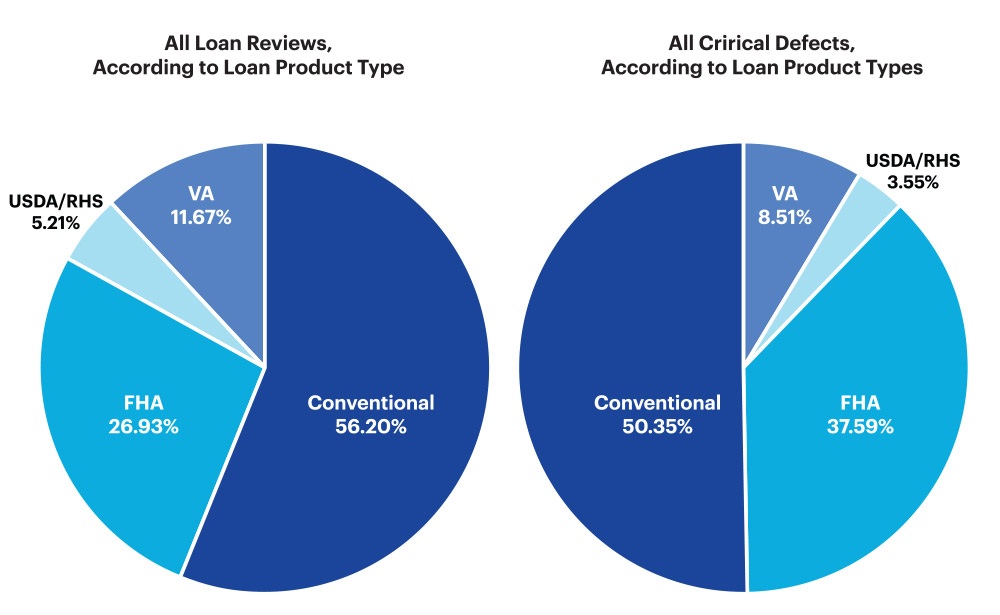
Figure 5: Q3 2017 loans broken down by loan type, and critical defects broken down by loan type
Conclusion
The industry remains in a purchase driven market. While purchase transactions continued to outpace mortgage refinance originations in Q3 2017, the data does show a slight change in direction with a 10% decrease in the percentage of purchase transactions as a share of the overall market, vs Q2 2017.
Purchase transactions are inherently more prone to underwriting related defects. As a result of Q3 2017’s purchase driven market, the majority of defects continued to reside within the Employment/ Income, Credit, and Borrower and Mortgage Eligibility categories – all key components of the underwriting process.
The disproportionate share of critical defects among both purchase transactions and FHA loans represents a prime example of the need for analytics in business decision making. Identifying the key areas where defects are disproportionately high empowers lenders to conduct discretionary and/or targeted reviews. This in turn enables them to implement strategies that correct these issues by addressing the sources of the defects.
Effectively managing risk requires knowing where the greatest risks lie. Only then can lenders allocate appropriate resources to loan auditing and quality reviews, proactively moving beyond mere random sampling to achieve an effective method for properly managing risk.
About the ARMCO Mortgage QC Industry Trends Report
The ARMCO Mortgage QC Industry Trends Report represents a nationwide post-closing quality control analysis using data and findings derived from mortgage lenders utilizing the ACES Analytics benchmarking software.
This report provides an in-depth analysis of residential mortgage critical defects as reported during post-closing quality control audits. Data presented comprises net critical defects and is categorized in accordance with the Fannie Mae loan defect taxonomy.
About ARMCO
ARMCO – ACES Risk Management delivers web-based audit technology solutions, as well as powerful data and analytics, to the nation’s top mortgage lenders, servicers, investors and outsourcing professionals. A trusted partner devoted to client relationships, ARMCO offers best-in-class risk management software that provides U.S. banks, mortgage companies and service providers the technology and data needed to support loan integrity, meet regulatory requirements, reduce risk and drive positive business decisions. ARMCO’s flagship product, ACES Flexible Audit Technology®, is available at any point in the mortgage loan lifecycle, to any size lender, and is user-definable. ACES standardizes audit requirements, ties pre-funding reviews to post-closing quality control audits, enables seamless trend analysis, identifies credit, compliance and process deficiencies and helps create manageable action plans. For more information, visit www.acesquality.com or call 1-800-858-1598.
MEDIA CONTACT:
Jeri Yoshida
Yosh Communications
jeri@yoshcomm.com
310 651 0057