ARMCO’s Mortgage QC Industry Trends Report represents an analysis of nationwide quality control findings based on data derived from the ACES Analytics benchmarking software.
Executive Summary
QC Industry Trends – Overview
QC Industry Trends – by Category
QC Industry Trends – by Loan Purpose
QC Industry Trends – by Loan Type
Conclusion
About this Report
Executive Summary
This report represents an analysis of post-closing quality control data derived from loan files analyzed by the ACES Analytics benchmarking system during the third quarter of 2018 (Q3 2018).
Findings for the Q3 2018 Trends Report were based on post-closing quality control data from over 90,000 unique loans. All reviews and defect data that were evaluated for this report were based on loan audits selected by lenders for full file reviews.
Defects are categorized using the Fannie Mae loan defect taxonomy. Data for any given calendar quarter is analyzed no earlier than 90 days after the end of the quarter to allow sufficient time for lenders to complete the post-closing quality control cycle. Hence, ARMCO releases analyses for Q3 2018 in Q1 2019.
Summary of Findings
The leading critical defect categories for Q3 2018 were (1) Loan Package Documentation, (2) Credit and (3) Income/Employment. Purchase transactions continued to overshadow refinances in Q3 2018, comprising 77.17% of all transactions reviewed.
Report highlights include the following findings:
- In Q3 2018, the critical defect rate reached 1.89%, its second highest level since the TRID rule went into effect in October 2015, increasing roughly 11% from the previous quarter’s rate of 1.71%.
- In Q3 2018, critical defects attributed to Loan Package Documentation spiked nearly 23% over the previous quarter, making Q3 2018 the fourth consecutive quarter to see a significant increase in this category.
- In Q3 2018, the number of defects attributed to Income/Employment dropped almost in half, from 22.73% in the previous quarter to 12.50%.
- In Q3 2018, FHA loans accounted for a disproportionate number of critical defects, comprising 28.20% of originated loans in the benchmark, but accounting for 49.55% of loans with critical defects.
QC Industry Trends – Overview
Rising interest rates in Q3 2018 were largely responsible for the industry’s continued purchase market trend. Overall origination volumes were down and purchases accounted for 77.17% of loans in the benchmark.
In Q3 2018, the critical defect rate increased approximately 11%, from 1.71% to 1.89%. This marks the highest critical defect rate since the rate reached 1.92% in Q1 2016, the first full quarter after the TILA-RESPA Integrated Disclosure (TRID) rule went into effect on October 3, 2015.
NOTE: A critical defect is defined as a defect that would result in the loan being uninsurable or ineligible for sale. The critical defect rate reflects the percentage of loans reviewed for which at least one critical defect was identified during the post-closing quality control review and all reported defects are net defects.
Figure 1 displays critical defect rates—the number of loans containing at least one critical defect as a percentage of the total closed loans reviewed—for the past four calendar quarters. All loans reviewed are part of a lenders’ monthly random post-closing quality control review.
Critical Defect Rate by Quarter: Q3 2018
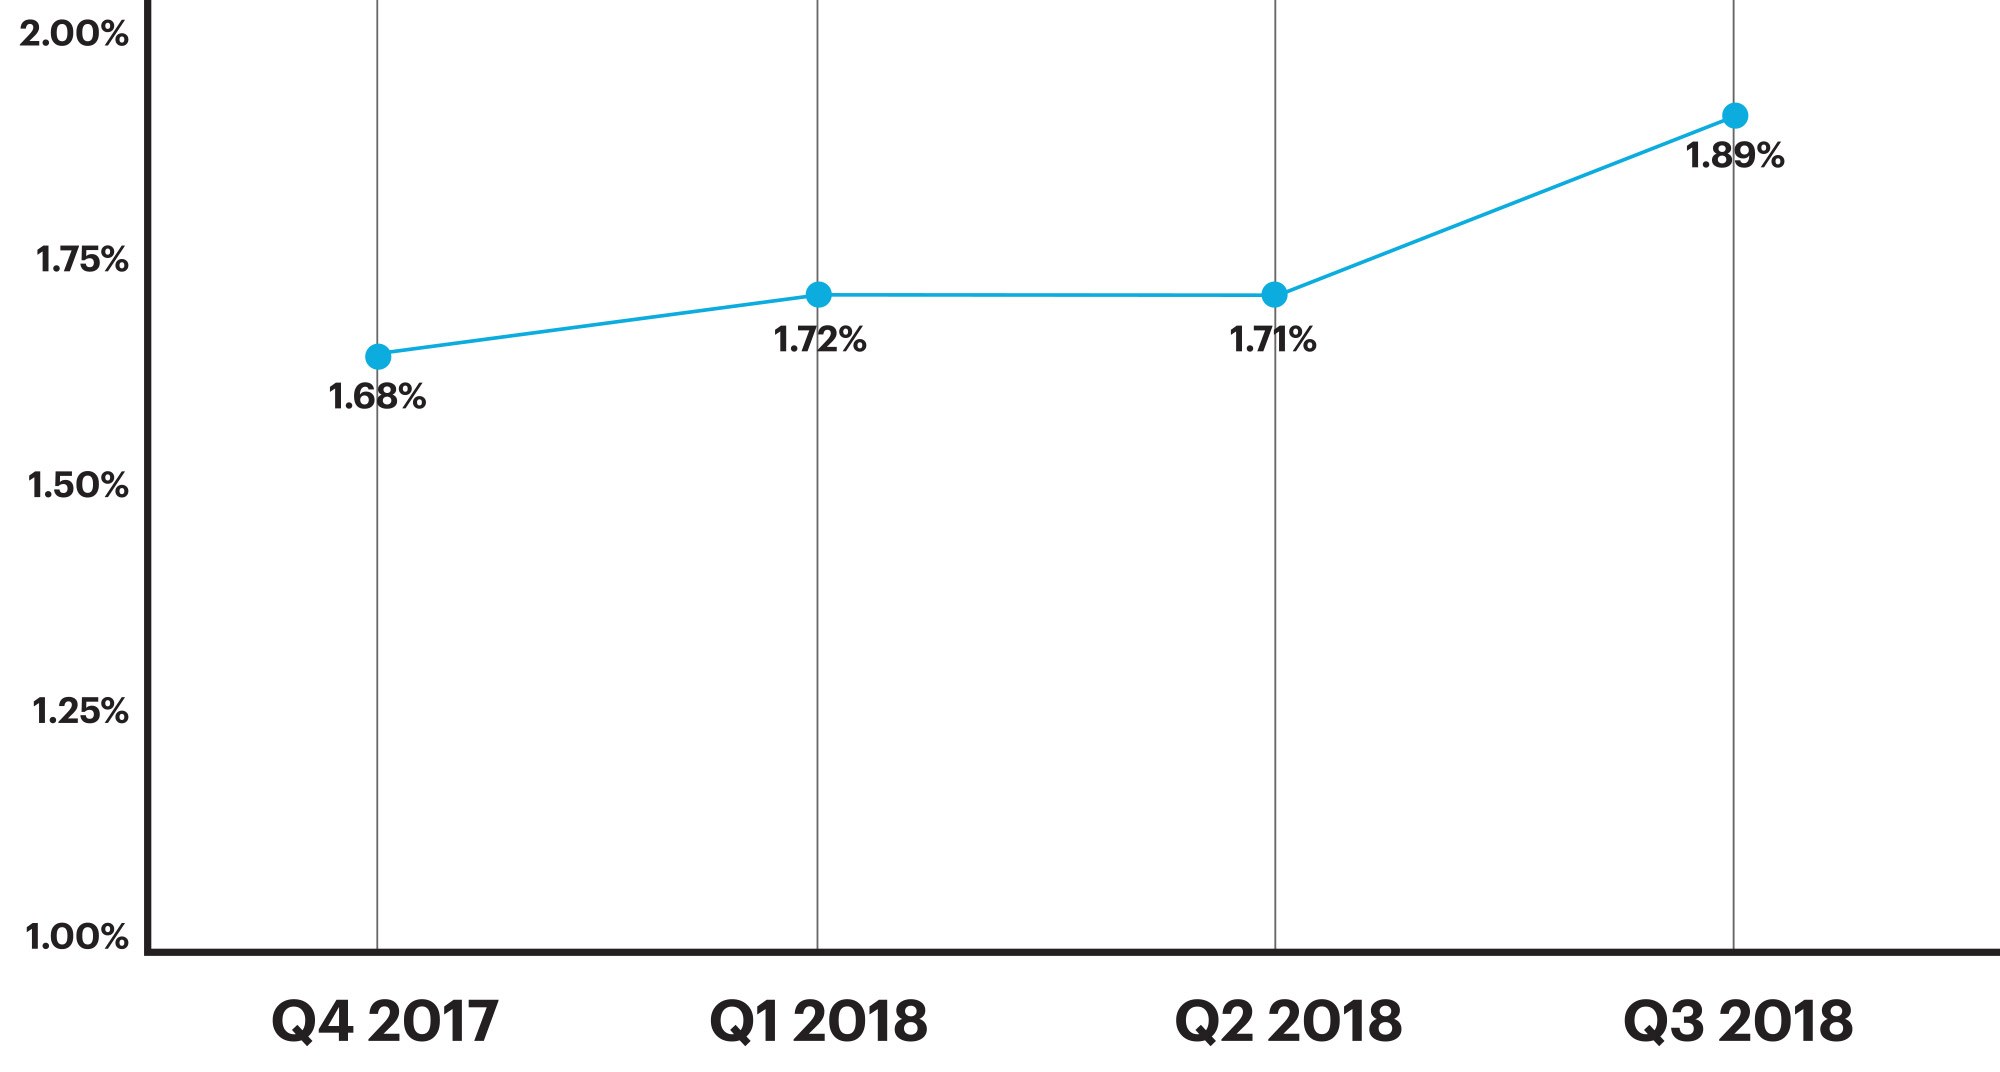
Figure 1: Percentage of loans with critical defects by quarter, Q4 2017 through Q3 2018
QC Industry Trends by Defect Category
The distribution of critical defects and activity within specific defect categories reflect the state of their corresponding markets. In other words, you can tell a lot about a specific market by evaluating its critical defects.
In Q3 2018, the top three defect categories were Loan Package Documentation, Credit and Income/Employment, which accounted for 23.61%, 16.67% and 12.50% of all critical defects, respectively.
The most significant observations derived from the distribution of critical defects in Q3 2018 are a continued trend of lender downsizing and high ratio of purchase transactions.
Figure 2 shows net critical defects, sorted according to Fannie Mae defect category, for Q3 2018.
Critical Defects by Fannie Mae Category: Q3 2018
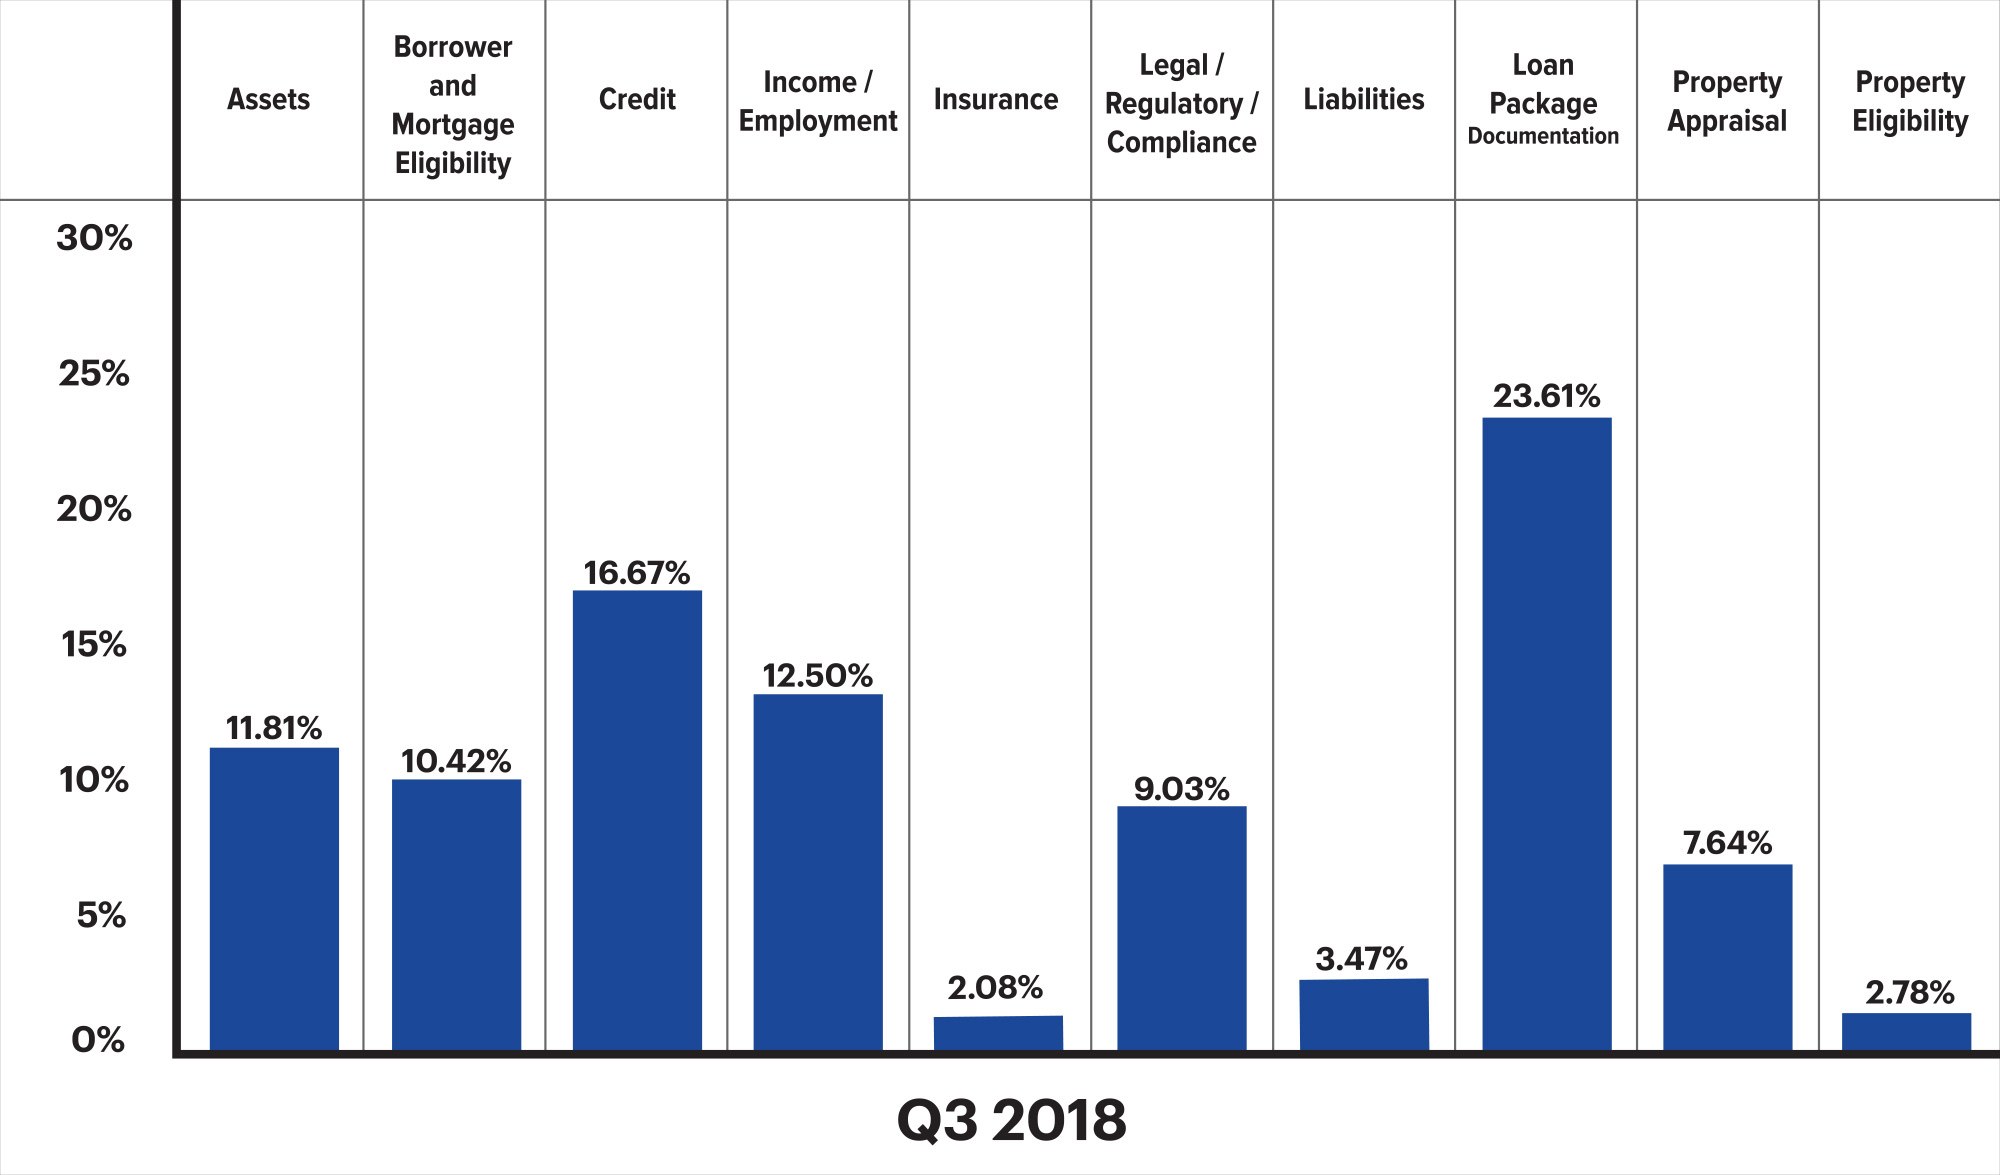
Figure 2: Q3 2018 net critical defects according to Fannie Mae defect category
The distribution among defect categories for Q3 2018 remained fairly consistent with Q2 2018. Two of the top three defect categories carried over from the previous quarter: Loan Package Documentation and Income/Employment. As with the previous quarter, credit and underwriting-related defects accounted for over 50% of all critical defects.
However, while the defect categories themselves remained relatively consistent, activity within the top defect category varied significantly from the previous quarter. In Q3 2018, the percentage of defects attributed to Loan Package Documentation—the quarter’s leading defect category—spiked nearly 19%, reaching 23.61% of all loans reviewed, up from 19.89% in Q2 2018. This upswing marks the fourth consecutive quarter to see double digit increases in the percentage of defects attributed to Loan Package Documentation, a category that, when coupled with a declining market, is often associated with lending staff downsizing and the greater complexity of document packages for purchase transactions.
In Q3 2018, both the Credit and the Liabilities categories increased moderately. Property Appraisal-related defects reached their highest point of the year. The increased percentage of defects in the two former categories could be attributed to lower overall production and compressed margins, which together produce hyper-competitive markets. In these situations, in an effort to win market share, investors often become more aggressive with product offerings, expanding eligibility guidelines to accommodate lower credit scores and higher loan-to-value ratios.
Figure 3 shows net critical defects, sorted according to Fannie Mae defect category, for Q2 2018 vs. Q3 2018.
Critical Defects by Fannie Mae Category: Q2 2018 vs. Q3 2018
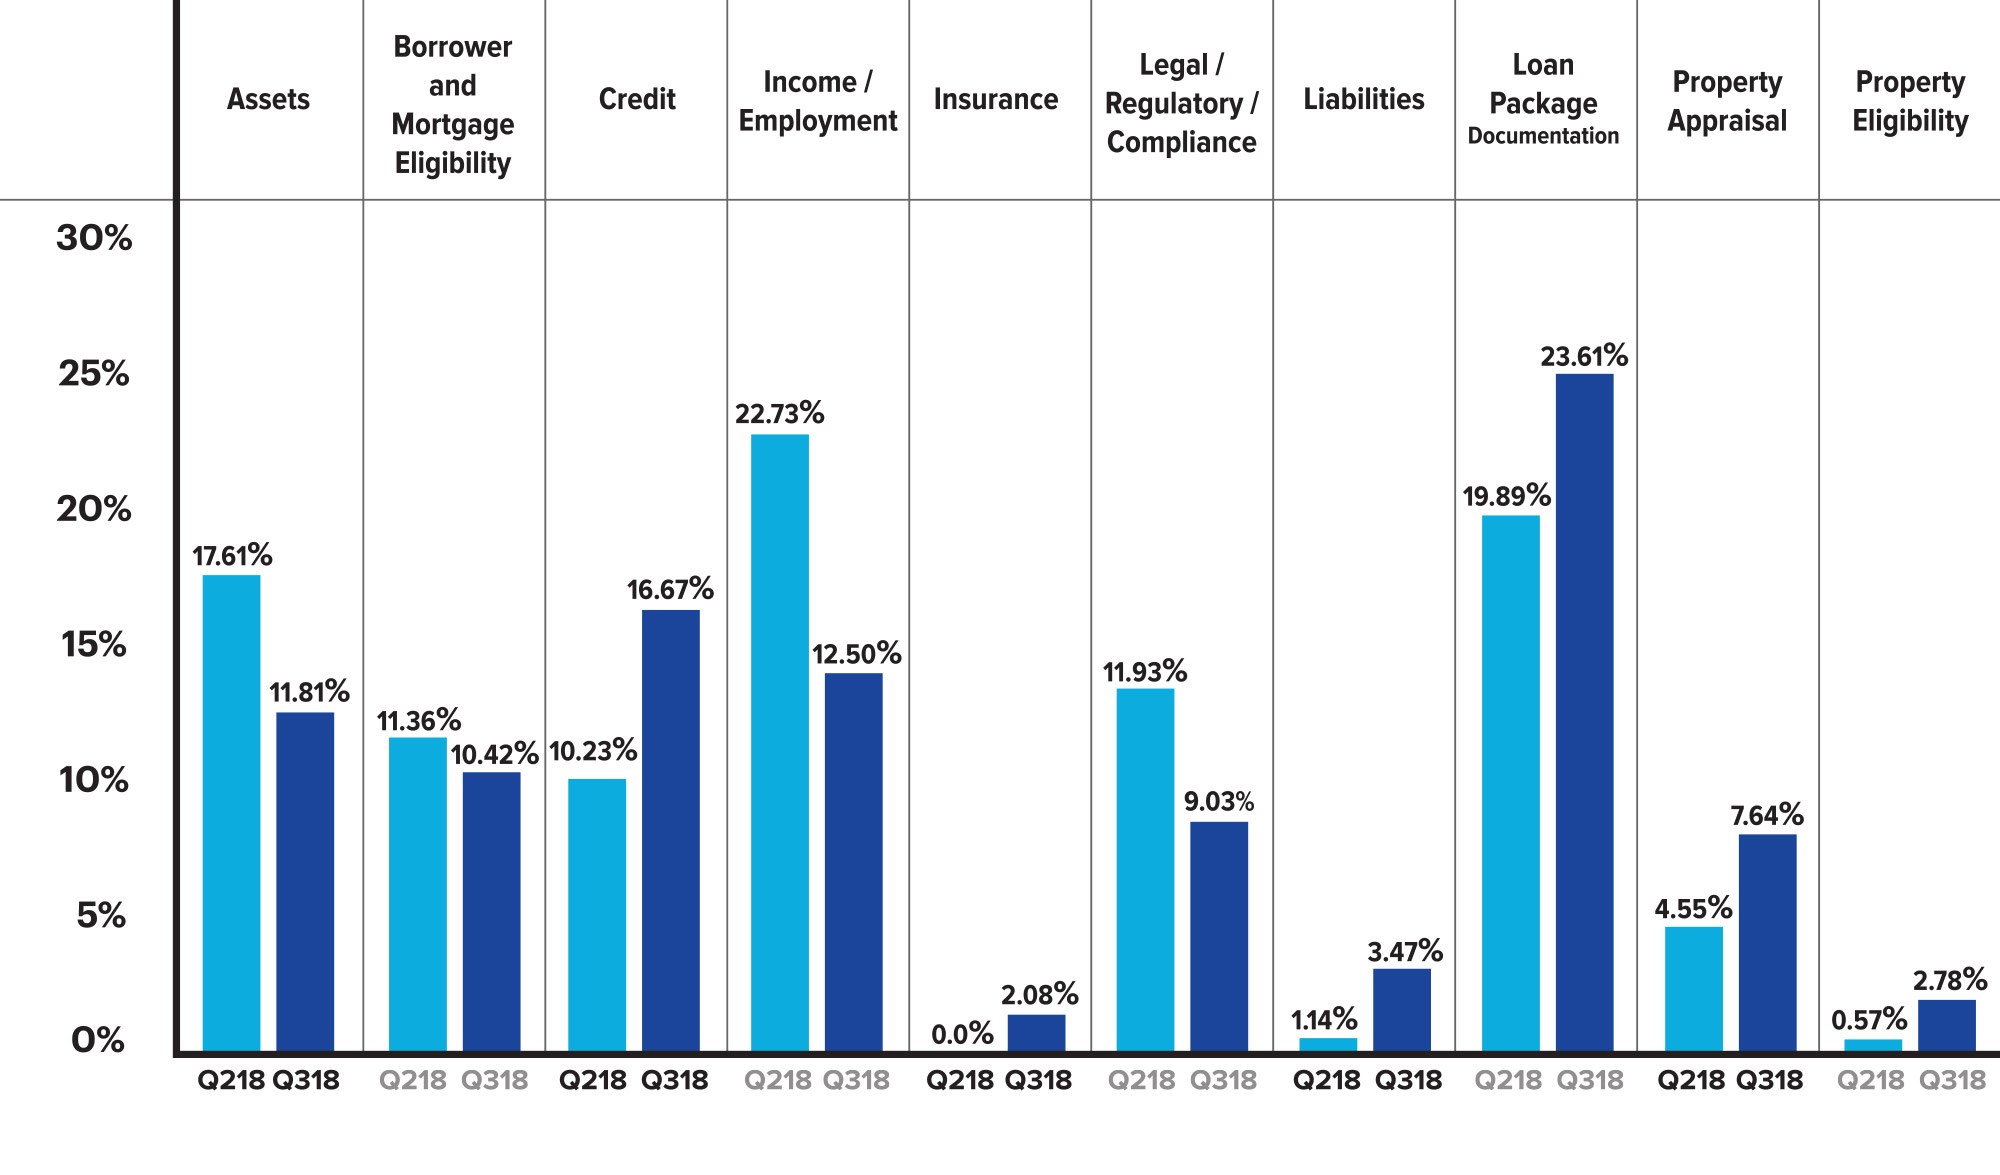
Figure 3: Q2 2018 vs. Q3 2018 net critical defects according to Fannie Mae defect category
QC Industry Trends by Loan Purpose
In Q3 2018, purchase transactions represented roughly 77% of all reviewed loans, and accounted for just over 78% of all reported critical defects. This marks the third consecutive quarter of progres- sively closer alignment between the percentage of purchase transactions and percentage of defects attributed to purchase transactions. In the previous two quarters, purchase transactions accounted for a greater percentage of defects than their percentage of the total benchmark. This continued alignment demonstrates that lenders have improved their ability to assure quality for purchase transactions. More lenders have reacted to the continued purchase-dominated market by proac- tively engaging in strategies to better handle the complexity of purchase transactions.
Figure 4 provides a comparison of all reviewed loans by loan purpose and all critical defects by loan purpose for Q3 2018.
Loans Reviewed and Critical Defects by Loan Type: Q3 2018

Figure 4: Q3 2018 loans reviewed according to loan purpose
Figure 4a provides the percentage difference of reviewed loans versus critical defects for purchase versus refinance transactions from Q4 2017 through Q3 2018.
Percentage Difference of Reviewed Loans vs. Critical Defects for Purchase vs. Refinance Transactions: Q4 2017 through Q3 2018
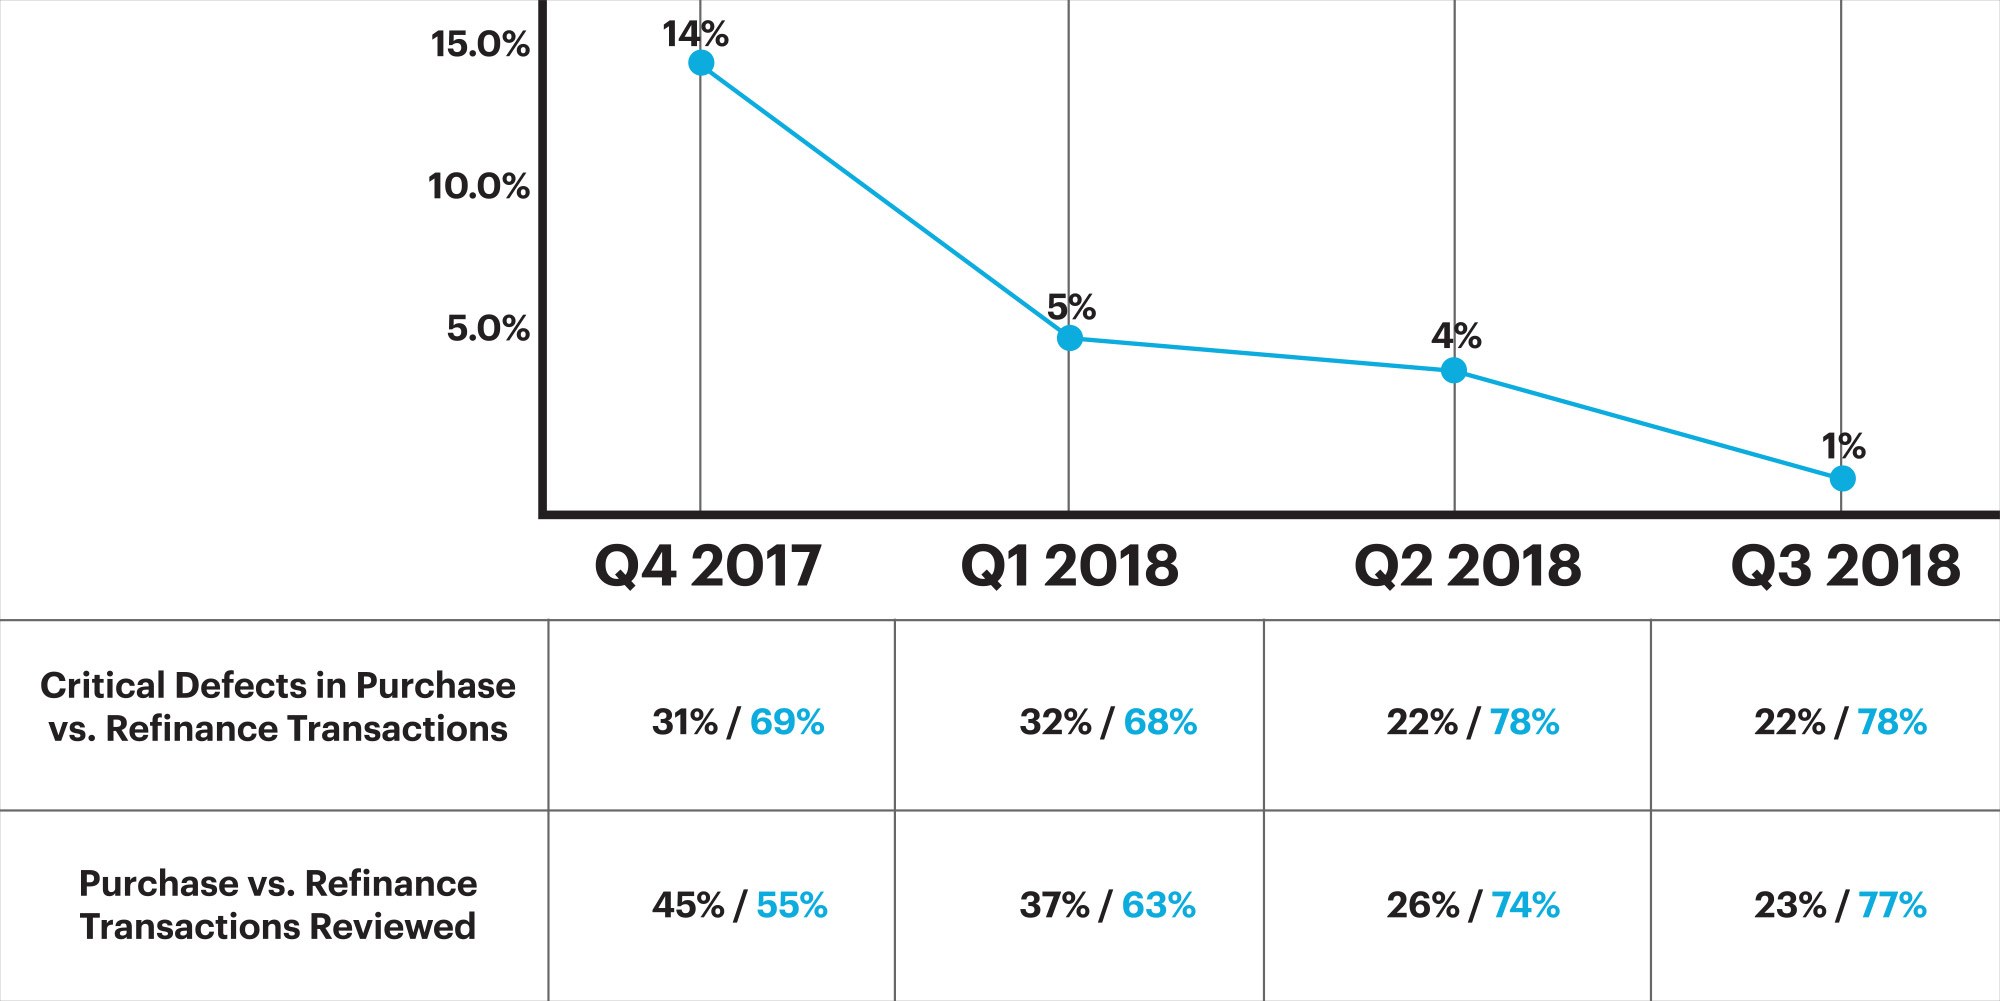
Figure 4a outlines the 12-month trend of loan defects in relation to the loan purpose
QC Industry Trends by Loan Type
In Q3 2018, conventional loans accounted for 59.72% of all loans reviewed, FHA loans accounted for 28.20%, VA loans comprised 8.28%, and USDA loans accounted for 3.81%.
The distribution of critical defects among loan types did not directly correlate to the distribution of loans reviewed. Most notably, FHA loans accounted for 28.20% of loans reviewed, but represented 49.55% of loans with critical defects. The percentage of FHA loans with critical defects in Q3 2018 reached its highest point since Q1 2017, when the rate was 52.47%. The top three exceptions associated with FHA loans were: (1) incomplete or inaccurate loan applications, (2) incorrect income calculations, and (3) missing or misstated credit obligations/liabilities.
The inordinate share of critical defects attributed to FHA loans align with a contracting and ultra-competitive market. Lender downsizing has led to a lack of FHA-knowledgeable staff, while at the same time, originators are submitting more complex loans, and investors are loosening guidelines to allow more borrowers to qualify.
This disproportionate distribution illustrates lenders’ need for flexible analytics, particularly in contracting markets. A flexible, configurable analytical technology enables lenders to better scrutinize certain loan types—FHA, for example—without the need for added staff. By specifically identifying the primary sources of defects, they can develop effective solutions to manage these issues during the loan origination and auditing processes.
Figure 5 provides a comparison between loan types as a percentage of the benchmark and loan type as a percentage of critical defects (conventional, FHA, VA and USDA).
Critical Defects as a Percentage of All Loan Types: Q3 2018

Figure 5: Q3 2018 Loans reviewed and critical defects by loan type
Conclusion
In Q3 2018, higher interest rates, fewer refinance transactions and low origination volume resulted in a hyper-competitive, contracted, purchase-dominant market, a trend that has continued from the past several quarters.
The percentage of critical defects reached its highest point since the quarter following the October 2015 implementation of TRID guidelines. Approximately 80% of those defects were associated with purchase transactions.
Not only in Q3 2018, but also in the previous quarters, contracting conditions and lower revenue precipitated layoffs and staff consolidation whose results surfaced in Q3 2018. As lenders down- sized, some have continued operations using a less qualified workforce that overall lacked the deep knowledge base and skill set required to function at optimal levels from a quality standpoint. As a result, errors and oversights increased, leading to an increase in critical defects.
As competition increased, investors broadened guidelines while individual loan originators attempted to make up for reduced revenue by initiating more lower-than-usual quality loans into the system.
In Q3 2018 the former and later phenomena resulted in a significant disparity between the percentage of FHA loans transacted and the percentage of defects attributed to FHA loans. With reductions in staff, and more originators originating more complex FHA loans, the result was a differential of nearly twice the number of defects identified among FHA loans, as the number of loans evaluated.
The spike in percentage of critical defects clearly indicates that, while the use of analytics is always important, they are perhaps even more important in contracting markets. Lenders that refrain from purchasing technology in slower markets can expect a spike in costs associated with delays, fees, fines and buybacks. If lenders want to secure their profits and protect their reputations, they need to use auditing technologies that are flexible enough to allow for quick configuration and produce robust analytics. This is the only way they can quickly adapt, preventing defects regardless of loan type, investor guidelines or staff weaknesses.
About the ARMCO Mortgage QC Industry Trends Report
The ARMCO Mortgage QC Industry Trends Report represents a nationwide post-closing quality control analysis using data and findings derived from mortgage lenders utilizing the ACES Analyt- ics benchmarking software.
This report provides an in-depth analysis of residential mortgage critical defects as reported during post-closing quality control audits. Data presented comprises net critical defects and is categorized in accordance with the Fannie Mae loan defect taxonomy.
About ARMCO
Over half of the Top 20 mortgage lenders in the U.S. choose ARMCO as their provider of risk management software. ARMCO’s product line includes loan quality enterprise software, services, data and analytics. Its flagship product, ACES Flexible Audit Technology®, has set the bar for user definability in its category. It is used at virtually every point in the mortgage lifecycle, as well as for a wide range of risk-prone business operations outside traditional mortgage origination and servicing. ARMCO’s consultative approach to customer relationships leverages 25 years of mortgage risk intel, assuring that its clients are using the most effective risk mitigation strategies, and are using the fastest, most reliable, most efficient means for preventing risk-related loss. ARMCO distributes the ARMCO Mortgage QC Industry Trends Report, a free quarterly analysis of industry-wide mortgage loan quality. For more information, visit www.acesquality.com or call 1-800-858-1598.
MEDIA CONTACT:
Jeri Yoshida
Yosh Communications
jeri@yoshcomm.com
310 651 0057