ARMCO’s Mortgage QC Industry Trends Report represents an analysis of nationwide quality control findings based on data derived from the ACES Analytics benchmarking software.
Executive Summary
QC Industry Trends – Overview
QC Industry Trends – by Category
QC Industry Trends – by Loan Purpose
QC Industry Trends – by Loan Type
Conclusion
About this Report
Executive Summary
This report represents an analysis of post-closing quality control data derived from loan files analyzed by the ACES Analytics benchmarking system during the third quarter of 2019 (Q3 2019). The analysis and commentary include prior quarter data and prior year data.
Findings for the Q3 2019 Trends Report are based on post-closing quality control data from over 90,000 unique loans. All reviews and defect data that were evaluated for this report were based on loan audits selected by lenders for full file review.
Defects are categorized using the Fannie Mae loan defect taxonomy. Data for any given calendar quarter is analyzed no earlier than 90 days after the end of the quarter to allow sufficient time for lenders to complete the post-closing quality control cycle. Hence, ARMCO releases analyses for Q3 2019 in Q1 2020.
NOTE: A critical defect is defined as a defect that would result in the loan being uninsurable or ineligible for sale. The critical defect rate reflects the percentage of loans reviewed for which at least one critical defect was identified during the post-closing quality control review and all reported defects are net defects.
Summary of Findings
With low interest rates resulting in an active refinance market, the critical defect rate continued its decline in Q3 2019 and is now at its lowest point since Q4 2016. The overall rate of 1.56% is similar to the Q4 2016 rate of 1.50% and approaching the 5-year low of 1.27% that was reached in Q3 2016.
Report highlights include the following findings for Q3 2019:
- The critical defect rate fell more than 9% from the prior quarter, continuing a downward trend since the peak in Q4 2018. The critical defect rate for Q3 2019 represents a 19+% improvement from the peak.
- The share of refinances in Q3 2019 were significantly higher than prior quarters, having a positive effect on critical defect rates.
- The % of Government loans reviewed in Q3 fell as the interest rate environment drove more conventional refinances.
- FHA loan defects saw a 10% improvement compared to the previous quarter.
QC Industry Trends – Overview
The Q3 2019 critical defect rate is 1.56%, which is down 9.3% from last quarter’s 1.72%. The two key metrics to review closely when analyzing the critical defect rate are loan type and loan purpose. Changes in interest rates and volumes are almost immediately visible when comparing the last 4 quarters (Q4 2018 to Q3 2019). In Q3 2019, when the share of refinances and conventional loans increased, critical defect rates almost inevitably fell.
Looking at the overall state of the market, borrowers are happy with the interest rate environment and property appreciation, and lenders appear happy with volumes and profitability. Rental property availability remains constrained, driving further parity between renting and owning.
The results are a mortgage market that is healthy and expanding. Based on the Q3 2019 critical defect rate and the overall lending environment, ARMCO’s outlook for the mortgage market remains incredibly strong.
Critical Defect Rate by Quarter: Q4 2018 – Q3 2019
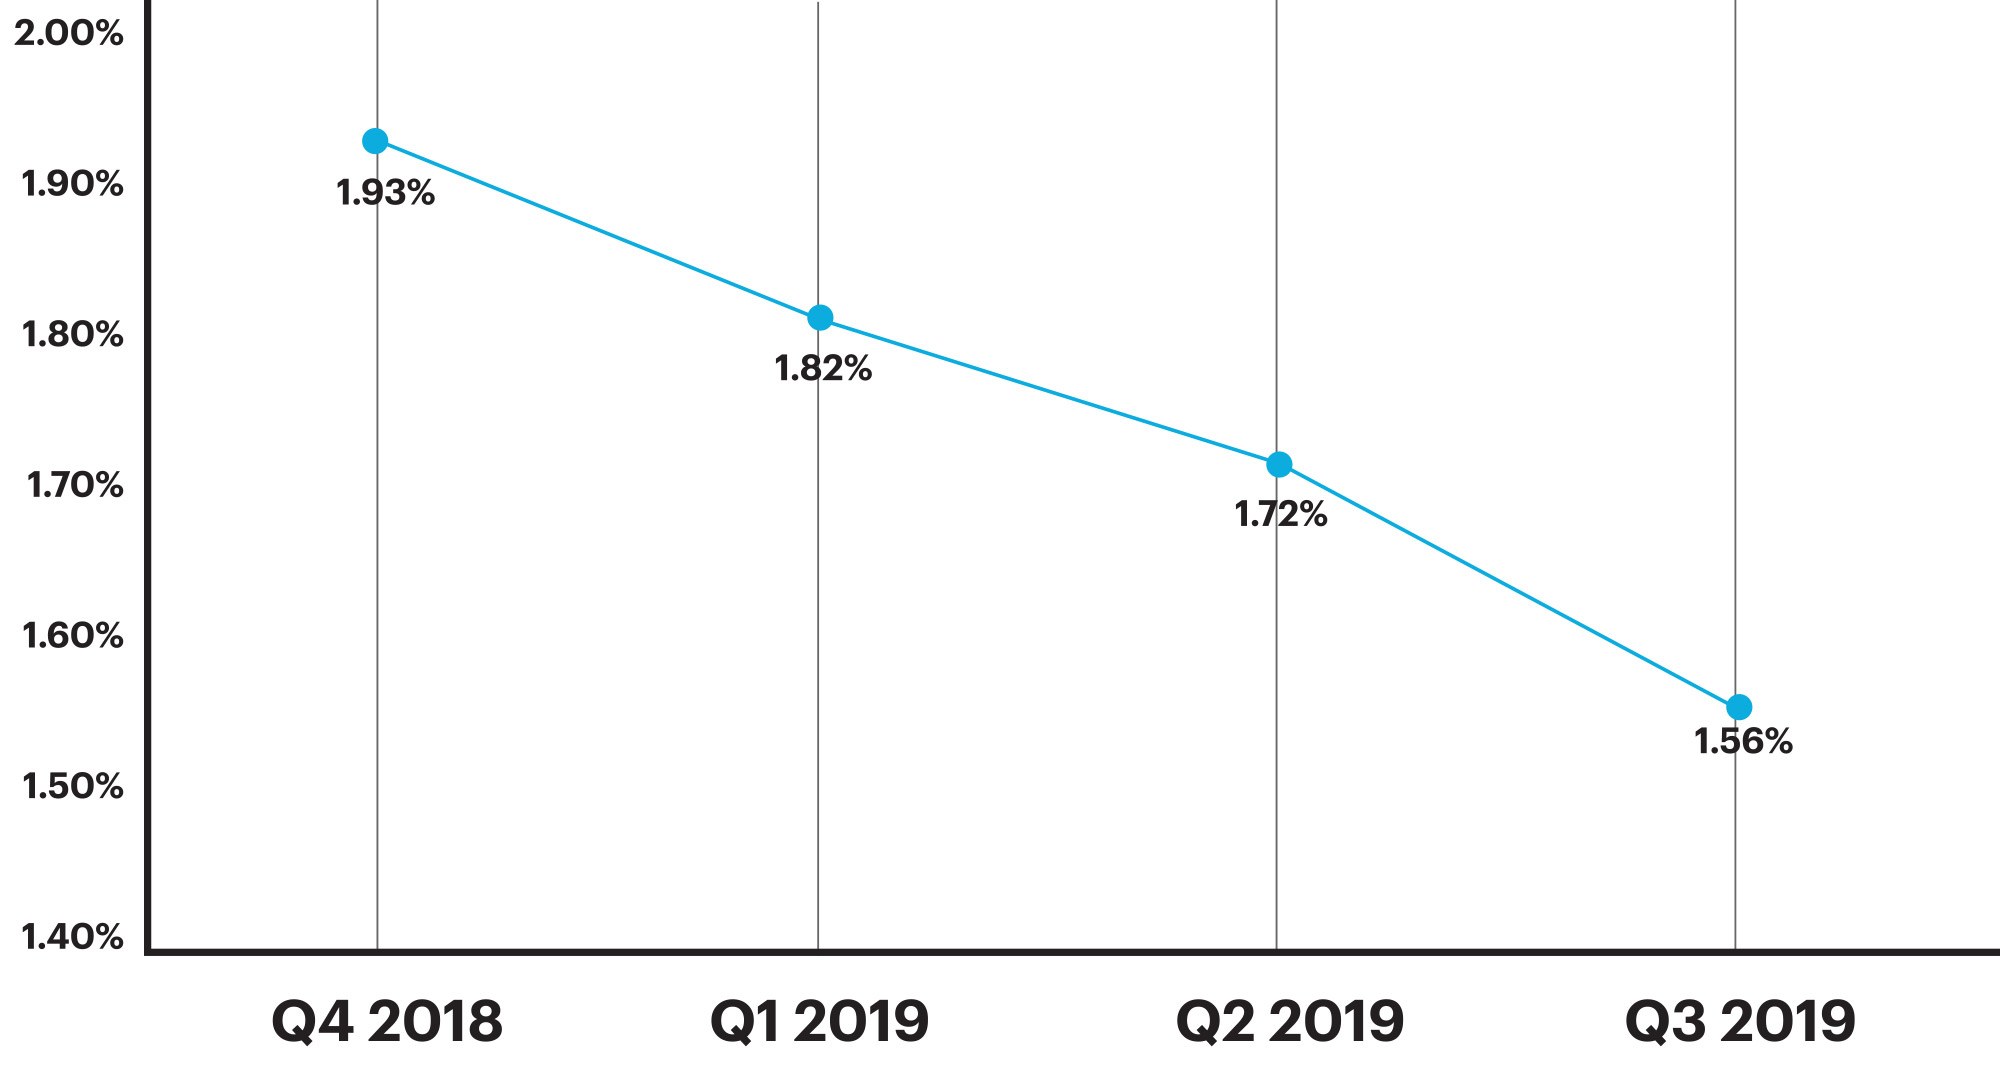
Figure 1: Percentage of loans with critical defects, by quarter. Figures reflect the number of loans containing at least one critical defect as a percentage of the total closed loans reviewed.
QC Industry Trends by Defect Category
Income/Employment defects were the leading category of defects at 20.53%. While these defects were up slightly when compared to the prior quarter’s 18.85%, it is important to keep perspective. Income/Employment defects in the prior quarter (Q1 2019) accounted for 27.78% of all critical defects. This slight increase is considered is a normal fluctuation.
Of the 10 categories that had measurable critical defects rates, five experienced increases while the remaining five decreased from the previous quarter. Categories relating to core underwriting and qualification saw improvements compared to the previous quarter, although remain the leading defect categories in Q3 2019. Assets, which were elevated in the prior quarter, moderated a bit in the current quarter (17.80% in Q2 down to 13.25% in Q3) but still remain higher than the 11.11% in Q1 2019.
For the defects reflective more of the manufacturing process than core underwriting and qualification, we saw positive results this quarter in the Compliance (4.64% - down 11% from last quarter), Liabilities (3.31% - down 30%), and Documentation (12.58% - down 20%) defect categories.
The only possible area of concern is the increase in property-related defects in Q3 2019. Property/Appraisal-related defects more than doubled in Q3 2019 and stand at 7.95%, a more than 100% increase from prior quarters. Property Eligibility defects also rose, albeit at a much slower pace. ARMCO reviewed individual loan exception data to explore the root cause and found approximately half of the defects in this category were related to natural disasters. These appraisal-related defects were missing/expired disaster inspections and the associated lender overlays. Q3 2019 was a particularly bad quarter for natural disasters as it encompasses the timeline for the two largest hurricanes to make landfall (Humberto and Dorian), as well as the multiple large wildfires in Northern and Southern California last year. Because of the strong property market (lack of inventory, rental demand), we remain cautiously optimistic that these types of defects remain something to monitor but not panic over.
Critical Defects by Fannie Mae Category: Q3 2019
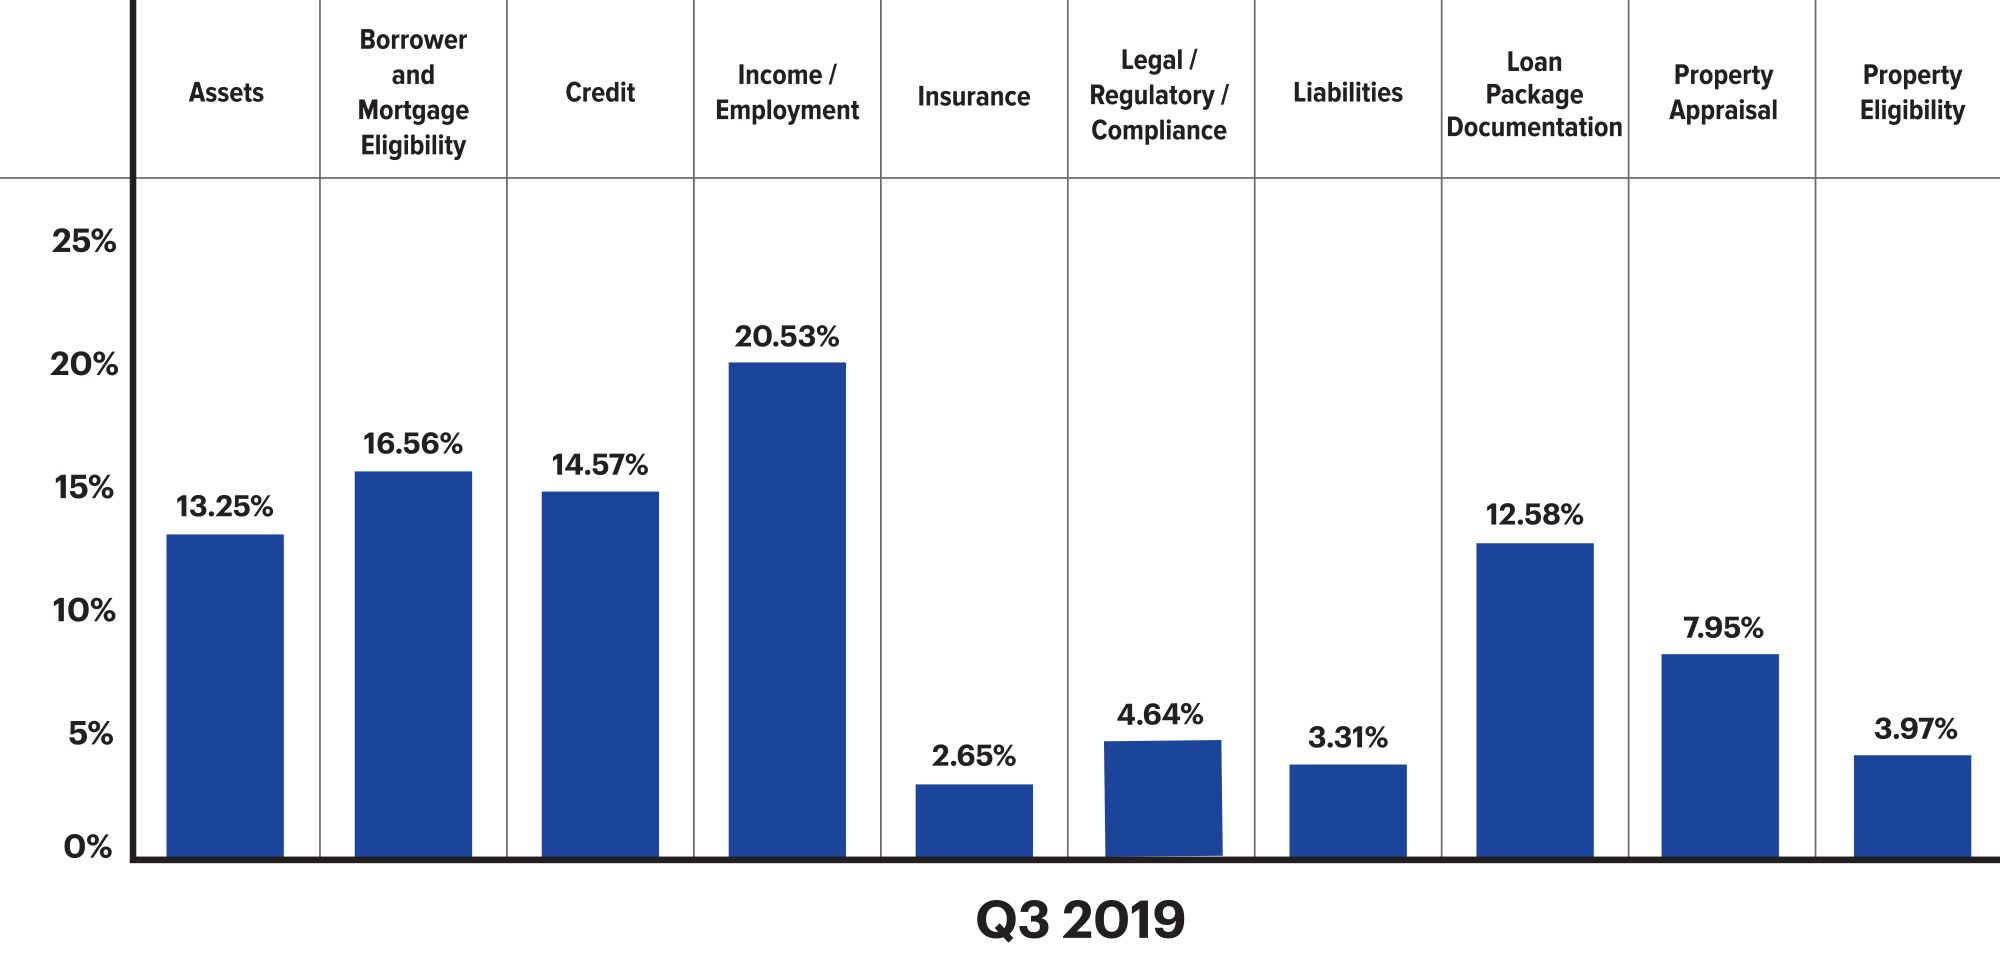
Figure 2: Displays Q3 2019 net critical defects as a percentage of all critical defects, according to Fannie Mae defect category.
Critical Defects by Fannie Mae Category: Q2 2019 vs. Q3 2019

Figure 3: Q2 2019 vs. Q3 2019 share of net critical defects according to Fannie Mae Category.
As lending volumes rose in early 2019, we saw an increase in income and asset documentation issues. Most often these issues are related to proof of income and asset documents expiring (according to underwriting guidelines) prior to closing and are reflective of extended turn times that accompany rapid increases in application volume. The results for Q3 2019 reflect much of the same, particularly as it relates to Income/Employment, where the Income Documentation sub-category made up 64.52% of all Income/Employment defects. This percentage is up from 55.56% in the prior quarter.
For this quarter, Loan Package Documentation dropped off of this report, as critical defects for that category declined, and was replaced by Borrower and Mortgage Eligibility. Digging deeper into this category shows that Mortgage/Program Eligibility sub-category drove the results, making up 71% of the defects. Because this sub-category relates to core underwriting and qualification, we will closely monitor this defect rate in future quarters.
Critical Defects by Fannie Mae, by sub-categories: Q3 2019
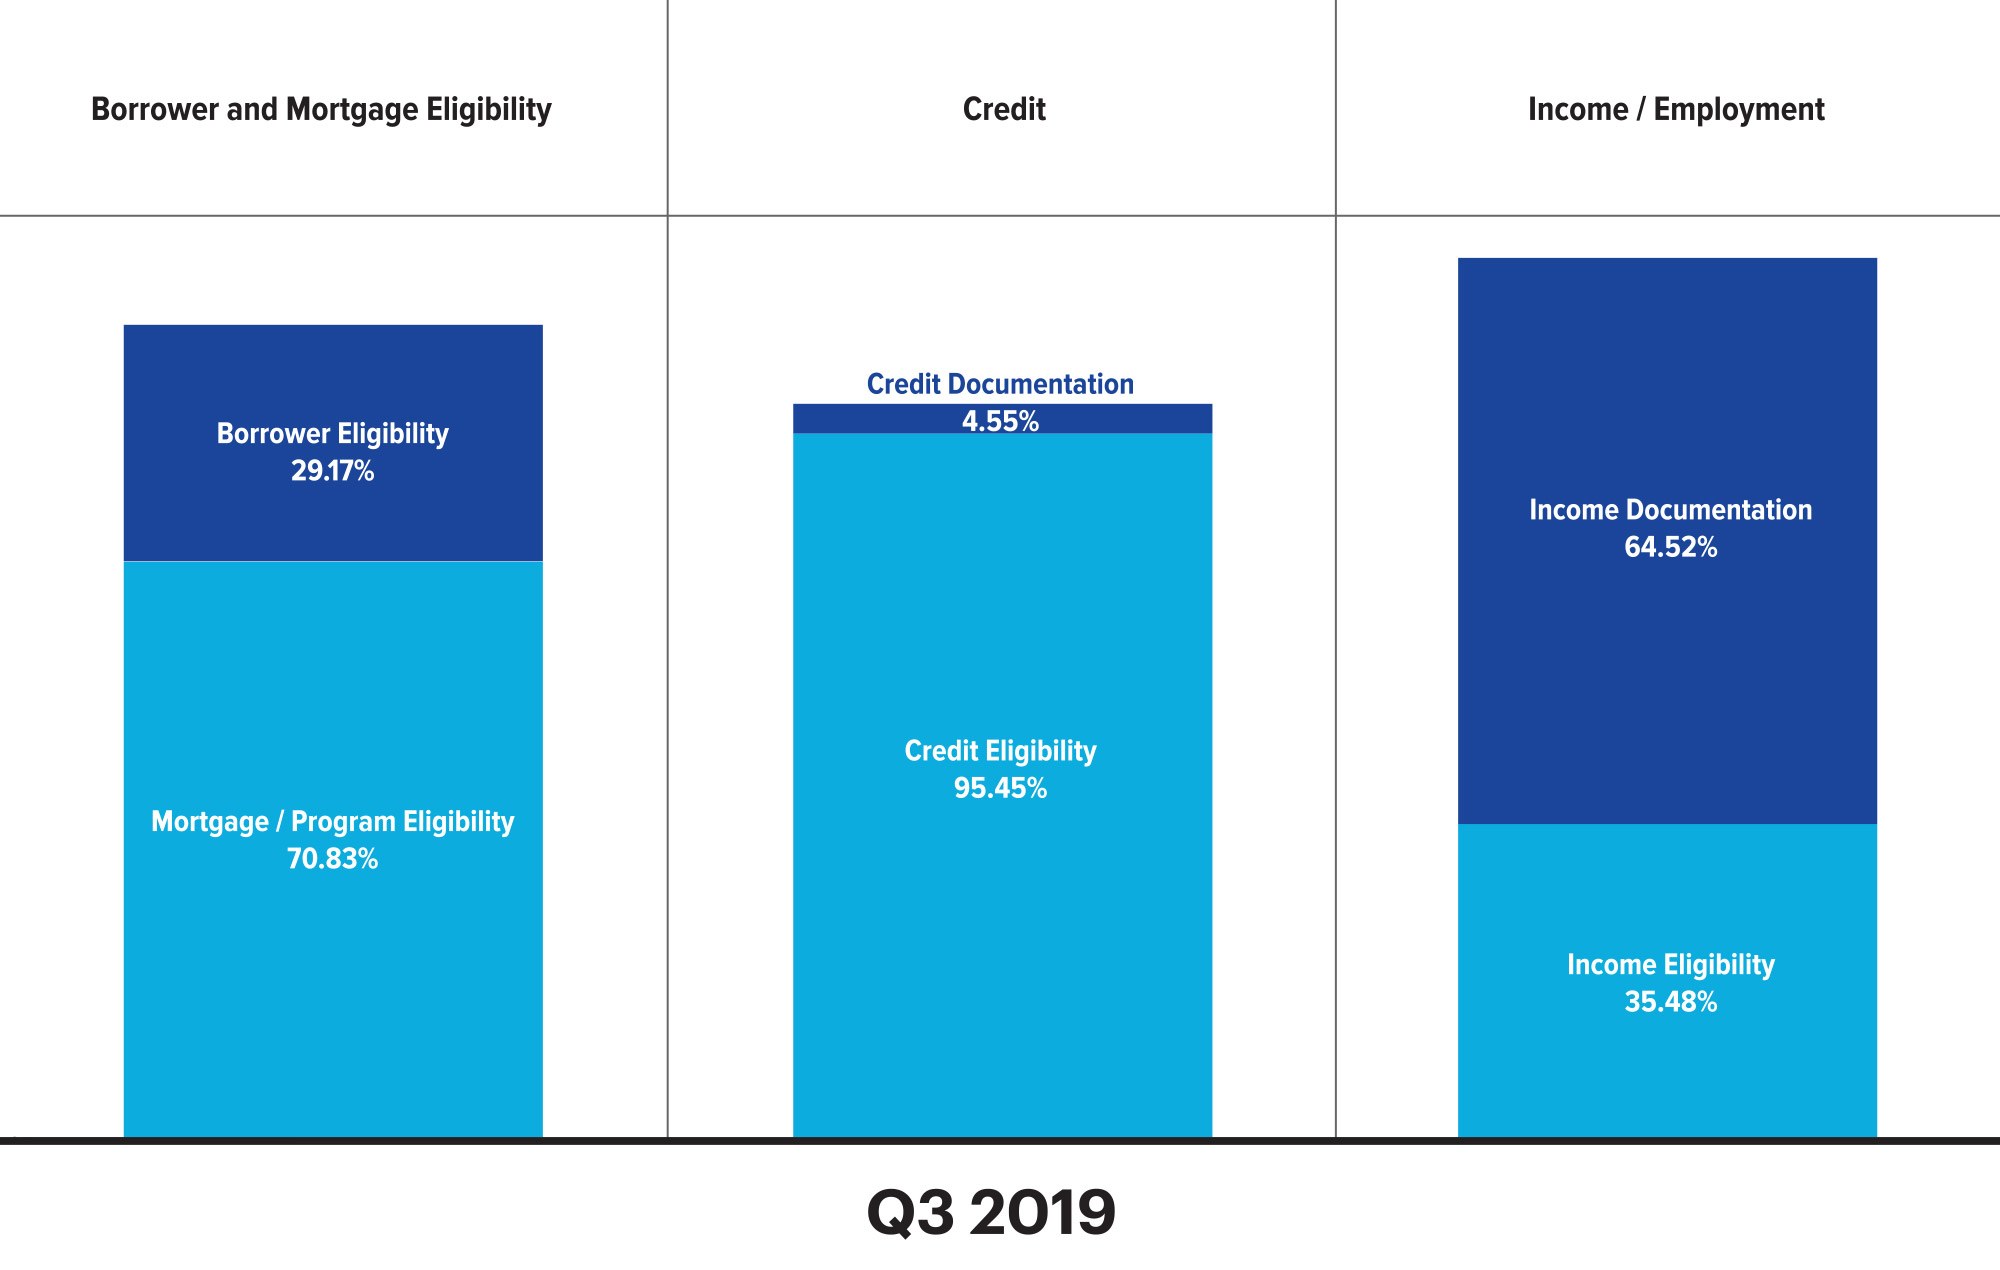
Figure 4: Displays the Q3 2019 defects by Fannie Mae sub-category expressed as a percentage of the overall category.
QC Industry Trends by Loan Purpose
Changes in metrics to the distribution of purchase versus refinance loans have a direct correlation to the overall critical defect rate. This quarter, we saw refinances climb to 40% of overall volume, up from 28% in the prior quarter. Purchases fell below the 60% threshold for the first time in nearly three years.
Additionally, we saw defect performance for purchases improve. Purchases made up 59.86% of the loans reviewed and the share of critical defects for those purchase loans made up only 57.50% of all defects by loan purpose. Typically, the percentage of defects related to purchases is higher than the percentage of purchase loans overall. Last quarter, purchases made up 71.72% of loans reviewed and 72.73% of the critical defects.
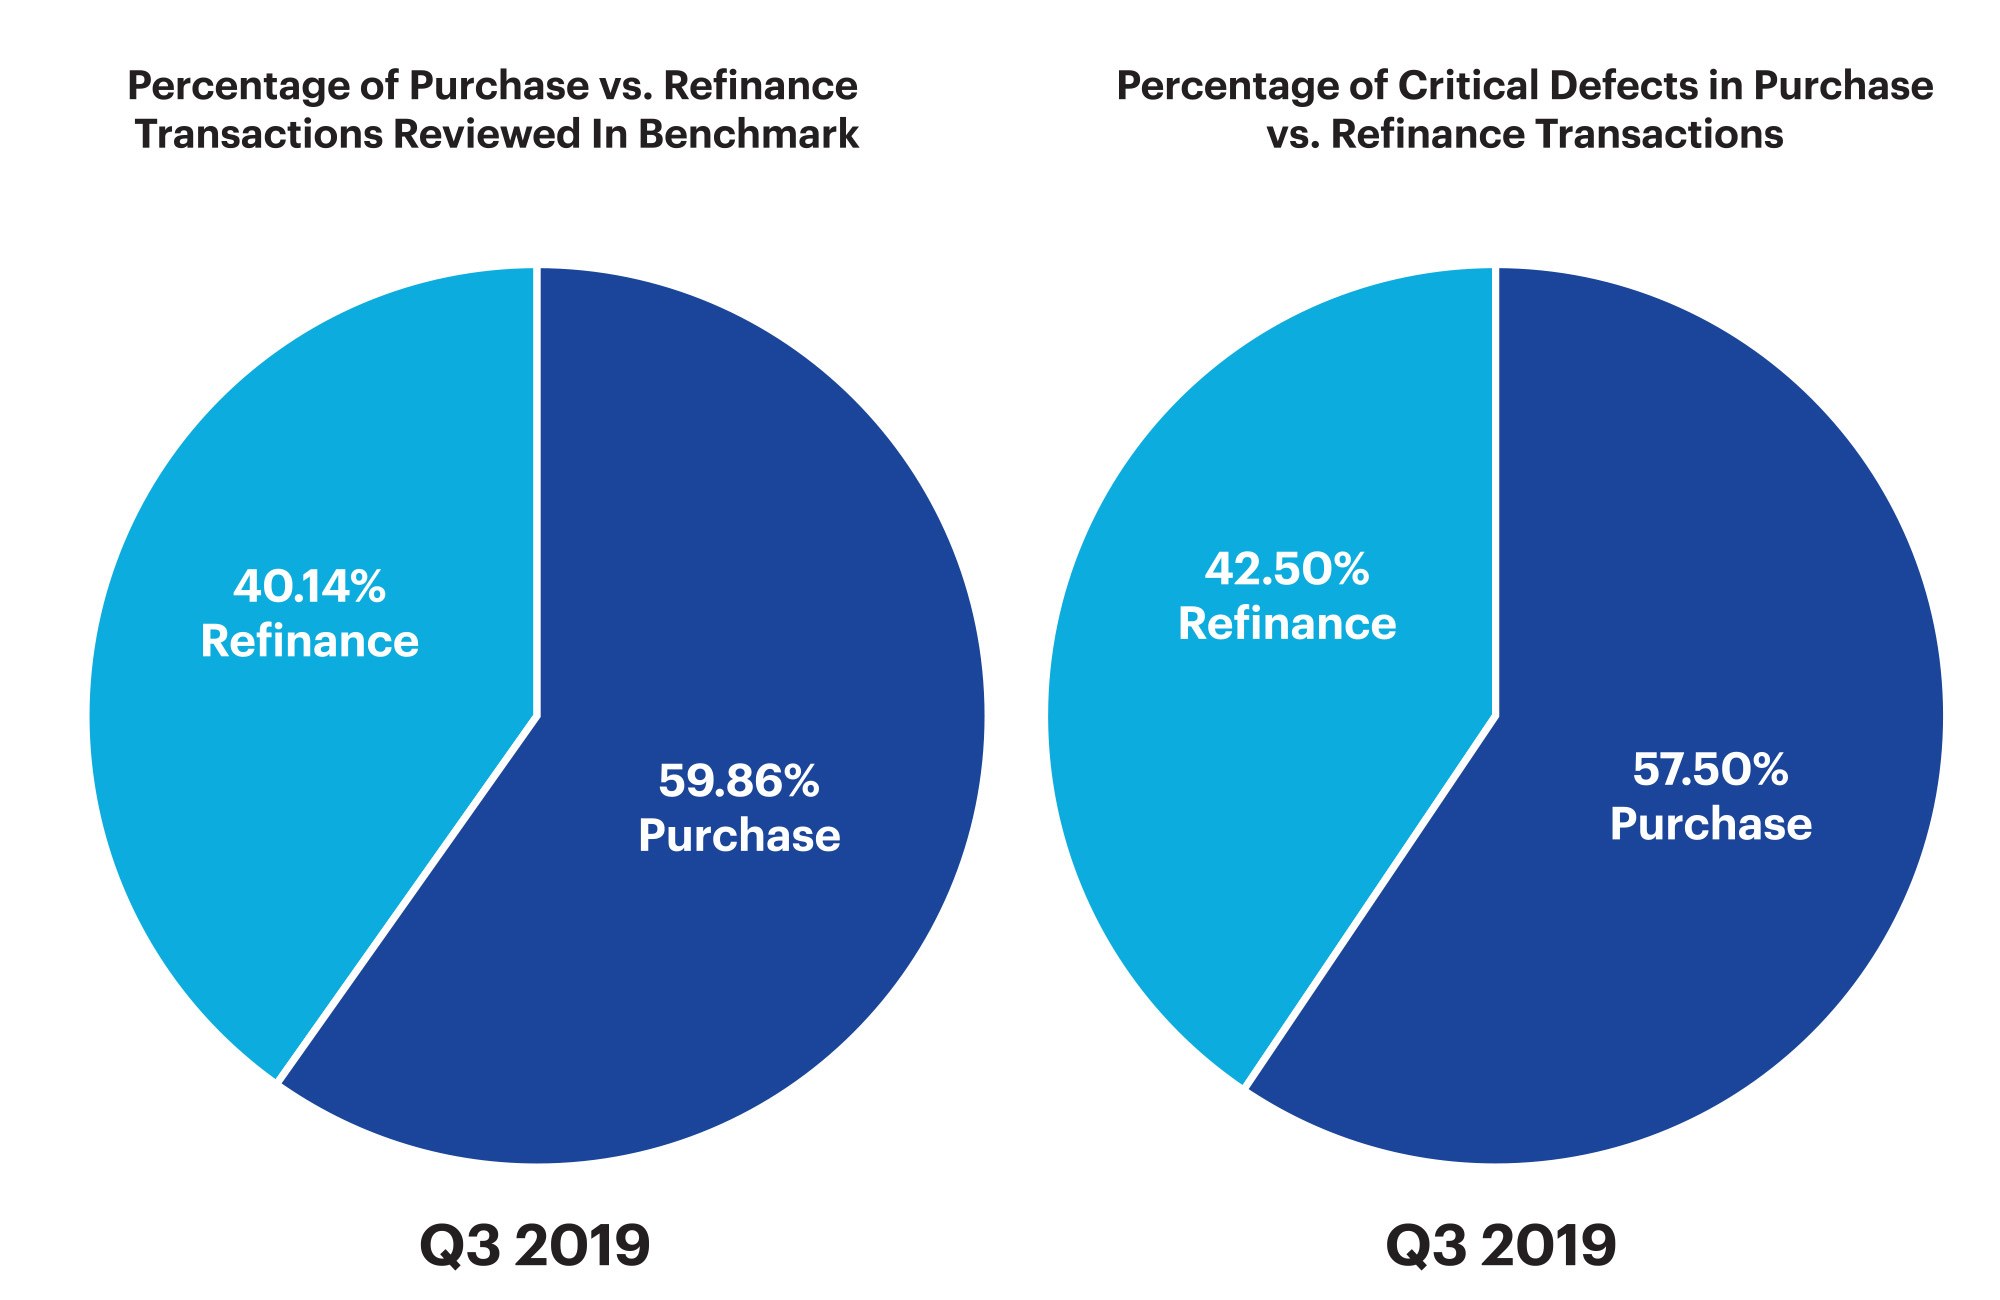
Figure 5 displays Q3 2019 provides a comparison of loan performance between purchase and refinance transactions.
QC Industry Trends by Loan Type
Similar to the mix of purchase loans versus refinance loans, the mix of loan type is a leading indicator of the critical defect rate. Historical data shows government-insured loans have higher defects as compared to conventional loans. In Q3 2019, the share of conventional loans reviewed was 64.02%, which increased from 61.88% in the prior quarter. FHA loan share decreased to 25.69%, a decline of 2% from Q2 2019. VA and USDA loans were flat as compared to prior quarters.
Improvement on FHA defects drove the stellar performance seen in this category. As mentioned above, FHA loans made up 25.69% of the loans reviewed, and the same loans accounted for 36.67% of the defects, resulting in a ‘+10.98% spread.’ In the prior quarter, FHA loans had a share of 27.85% and accounted for 48.25% of the defects — for a spread of +20.4%. This is 10% improvement over the prior quarter.
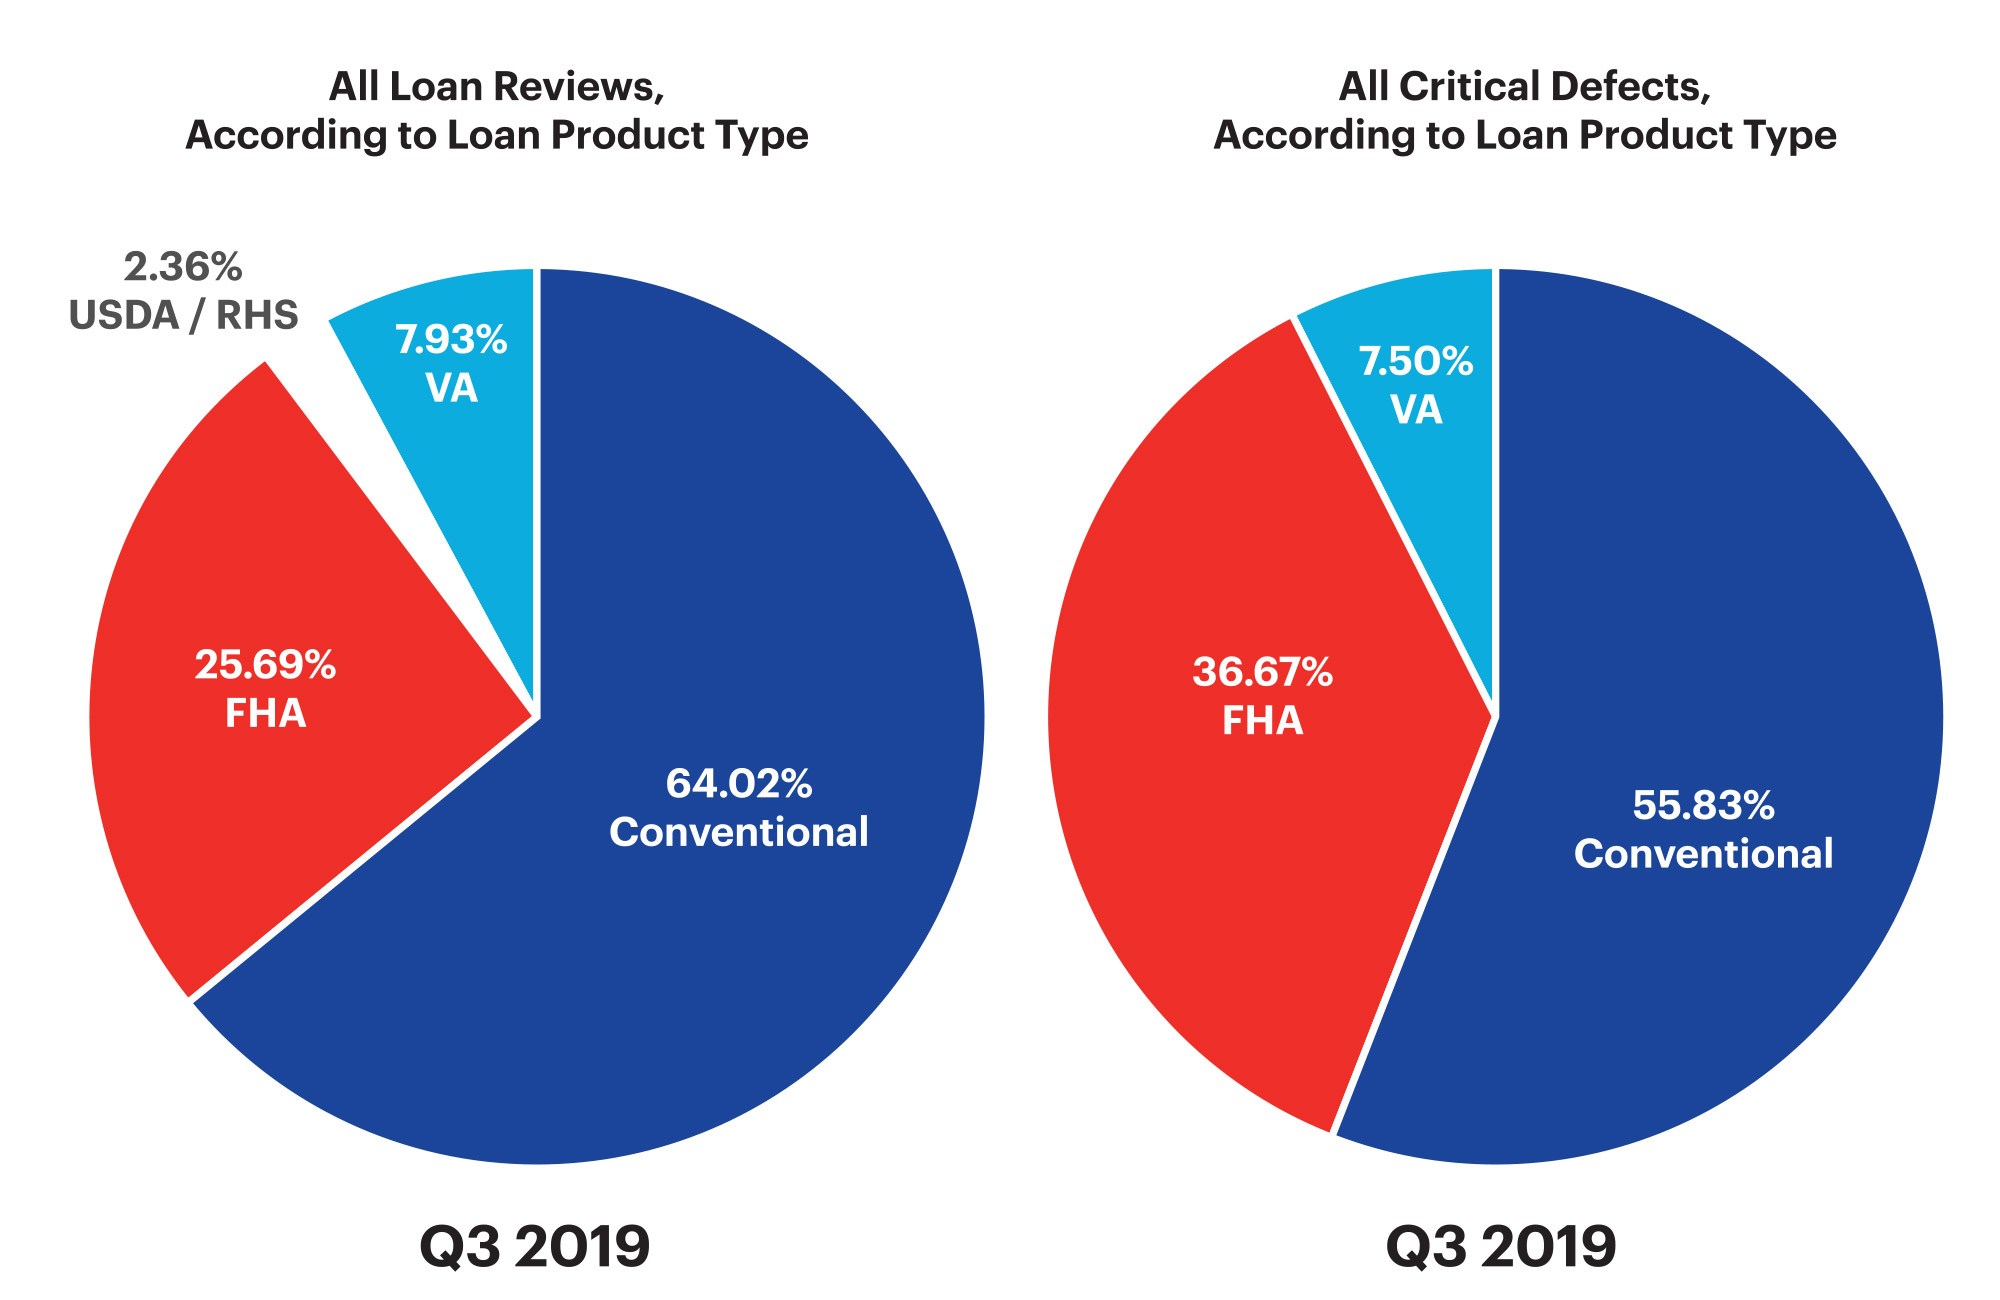
Figure 6 provides a comparison of loan performance among all loan types in the benchmark (conventional, FHA, VA, and USDA).
Conclusion
It is safe to say that the industry, by and large, is originating quality loans. The latter half of 2019 and the early part of 2020 represent positive times in our industry, and at risk of jinxing it, we are going to keep the conclusion short and let the numbers speak for themselves. Or as we hear salespeople say from time to time, “Don’t keep selling past the ‘Yes.’” In all seriousness, the critical defect numbers for Q3 2019 are encouraging.
Many lenders are suggesting that the first quarter of 2020 will be incredibly strong, and the looming Spring buying season portends favorably as well. Interest rates in February 2020 fell below 3%, and we will be anxiously awaiting updated economists’ reports on the size of the borrowers with economic incentive to refinance. In the meantime, we will be hard at work analyzing data from future quarters for early warning signs of deterioration.
About the ARMCO Mortgage QC Industry Trends Report
The ARMCO Mortgage QC Industry Trends Report represents a nationwide post-closing quality control analysis using data and findings derived from mortgage lenders utilizing the ACES Analytics benchmarking software.
This report provides an in-depth analysis of residential mortgage critical defects as reported during post-closing quality control audits. Data presented comprises net critical defects and is categorized in accordance with the Fannie Mae loan defect taxonomy.
About ARMCO
Over half of the top 25 mortgage lenders and 33% of the top 150 lenders and servicers combined choose ARMCO. ARMCO’s product line includes loan quality enterprise software, services, data and analytics. Its flagship product, ACES Flexible Audit Technology®™, has set the bar for user definability in its category. It is used at virtually every point in the mortgage lifecycle, as well as for a wide range of risk-prone business operations outside traditional mortgage origination and servicing. ARMCO’s consultative approach to customer relationships leverages 25 years of mortgage risk intel, assuring that its clients are using the most effective risk mitigation strategies, and are using the fastest, most reliable, most efficient means for preventing risk-related loss. ARMCO distributes the ARMCO Mortgage QC Industry Trends Report, a free quarterly analysis of industry-wide mortgage loan quality.
For more information, visit https://www.acesquality.com or call 1-800-858-1598.
Learn more
Email us at info@armco.us