ACES’ Mortgage QC Industry Trends Report represents an analysis of nationwide quality control findings based on data derived from the ACES Quality Management & Control Software.
Executive Summary
QC Industry Trends – Overview
QC Industry Trends – by Category
QC Industry Trends – by Loan Purpose
QC Industry Trends – by Loan Product Type
Early Payment Defaults
Economic Discussion
Conclusion
About this Report
Executive Summary
This report represents an analysis of post-closing quality control data derived from loan files analyzed by the ACES Quality Management and Control® benchmarking system during the third quarter of 2021 (Q3 2021) and incorporates data from prior quarters and/or calendar years, where applicable.
Findings for the Q3 2021 Trends Report were based on post-closing quality control data from approximately 100,000 unique records. All reviews and defect data that were evaluated for this report were based on loan audits selected by lenders for full file reviews.
Defects are categorized using the Fannie Mae loan defect taxonomy. Data analysis for any given quarter does not begin until 90-days after the end of the quarter to allow lenders to complete the post-closing quality control cycle, resulting in a delay between the end of the quarter and publication of the data.
NOTE: A critical defect is defined as a defect that would result in the loan being uninsurable or ineligible for sale. The critical defect rate reflects the percentage of loans reviewed for which at least one critical defect was identified during the post-closing quality control review, and all reported defects are net defects.
Summary of Findings
Lenders executed well in Q3 2021 despite a difficult lending environment. After creeping up in the prior quarter, quality control critical defects fell 18% and ended the quarter at 1.87%. In a lot of ways, we are starting to see various metrics trend back to their historic norms as volumes moderate. Lenders are facing rising interest rates, lower volume, worsening profitability, staffing changes and a very active Federal Reserve, and the environment is unlikely to improve in the near-term as war rages on in Ukraine. It is becoming more and more difficult to predict a bottom to refinance volume, and a lot would have to go right for that to happen. There are so many external factors currently impacting mortgage lending, and we talk about a few of the most impactful in this quarter’s report.
Report highlights include the following findings:
- Mortgage lenders managed mortgage origination quality extremely well in Q3 2021, which led to a 18% improvement in the overall credit defect rate. This comes on the heels of a 13% increase in the defect rate last quarter.
- The share of defects attributable to Income/Employment issues remains an out-sized part of all defects. With unemployment numbers steadily improving, lenders should be mindful that these defects are increasingly stemming from underwriting/manufacturing issues. Another sub-category to watch will be self-employed borrowers.
- Volumes have declined resulting in lower manufacturing-related defects, likely because of a manufacturing process that is less stressed.
- Refinances are taking a back seat to purchases. The defect performance on purchases worsened as a result.
- Conventional loan share still dominates but fell when compared to government lending in Q3 2021. Defect performance on conventional loans stabilized while FHA defects rose.
- The Early Payment Defaults (“EPDs”) trend line indicates that reviews peaked and are now below pre-pandemic levels. The focus should now shift to the remaining loans in forbearance status and exit plans for those borrowers.
QC Industry Trends – Overview
The critical defect rate for Q3 2021 dropped 18% from the previous quarter to 1.86%. This is a welcome improvement compared to Q2, which experienced a 13% increase after erasing a streak of three straight quarters of declines in the critical defect rate.
The lending environment was very positive in Q3 2021, with interest rates remaining below 3% until the very end of the quarter. The average rate on a 30-year fixed rate mortgage was 2.87% for the quarter1. Interest rates were also steady, starting the quarter at 2.98% and ending at 3.01%. The low for the quarter was August when rates were 2.77%. It should be noted that Q3 2021 is likely to be the last quarter for some time where rates fell below 3%. As of February 2022, mortgage rates are hovering near 3.90%.
Borrowers lost a little bit of steam in Q3 2021, with originations volume down 8% from the prior quarter2. Volumes are now down for two straight quarters – historically the two peak purchase lending quarters. The decrease was driven primarily by a ~10% drop in refinance activity, although, according to ATTOM Data Solutions, purchase activity fell as well. The only sector reporting an increase in volume was home equity lending. Lenders were also dealing with declining profitability because of tighter capital markets spreads. In viewing publicly available filings, the gain-on-sale margins were between 30% and 40% lower comparing Q3 2021 to Q3 2020.
There is no doubt that lenders have a lot on their plate as the market transitions to higher rates and lower volumes, combined with lots of volatility in the key macroeconomic indicators that impact mortgage lending. All these factors have an effect on loan origination quality. That makes the improvement in the overall critical defect even more impressive, and we believe it shows that lenders take quality seriously and QC and risk policies are holding up under tough conditions.
1 http://www.freddiemac.com/pmms/
Critical Defect Rate by Quarter: Q4 2020 — Q3 2021
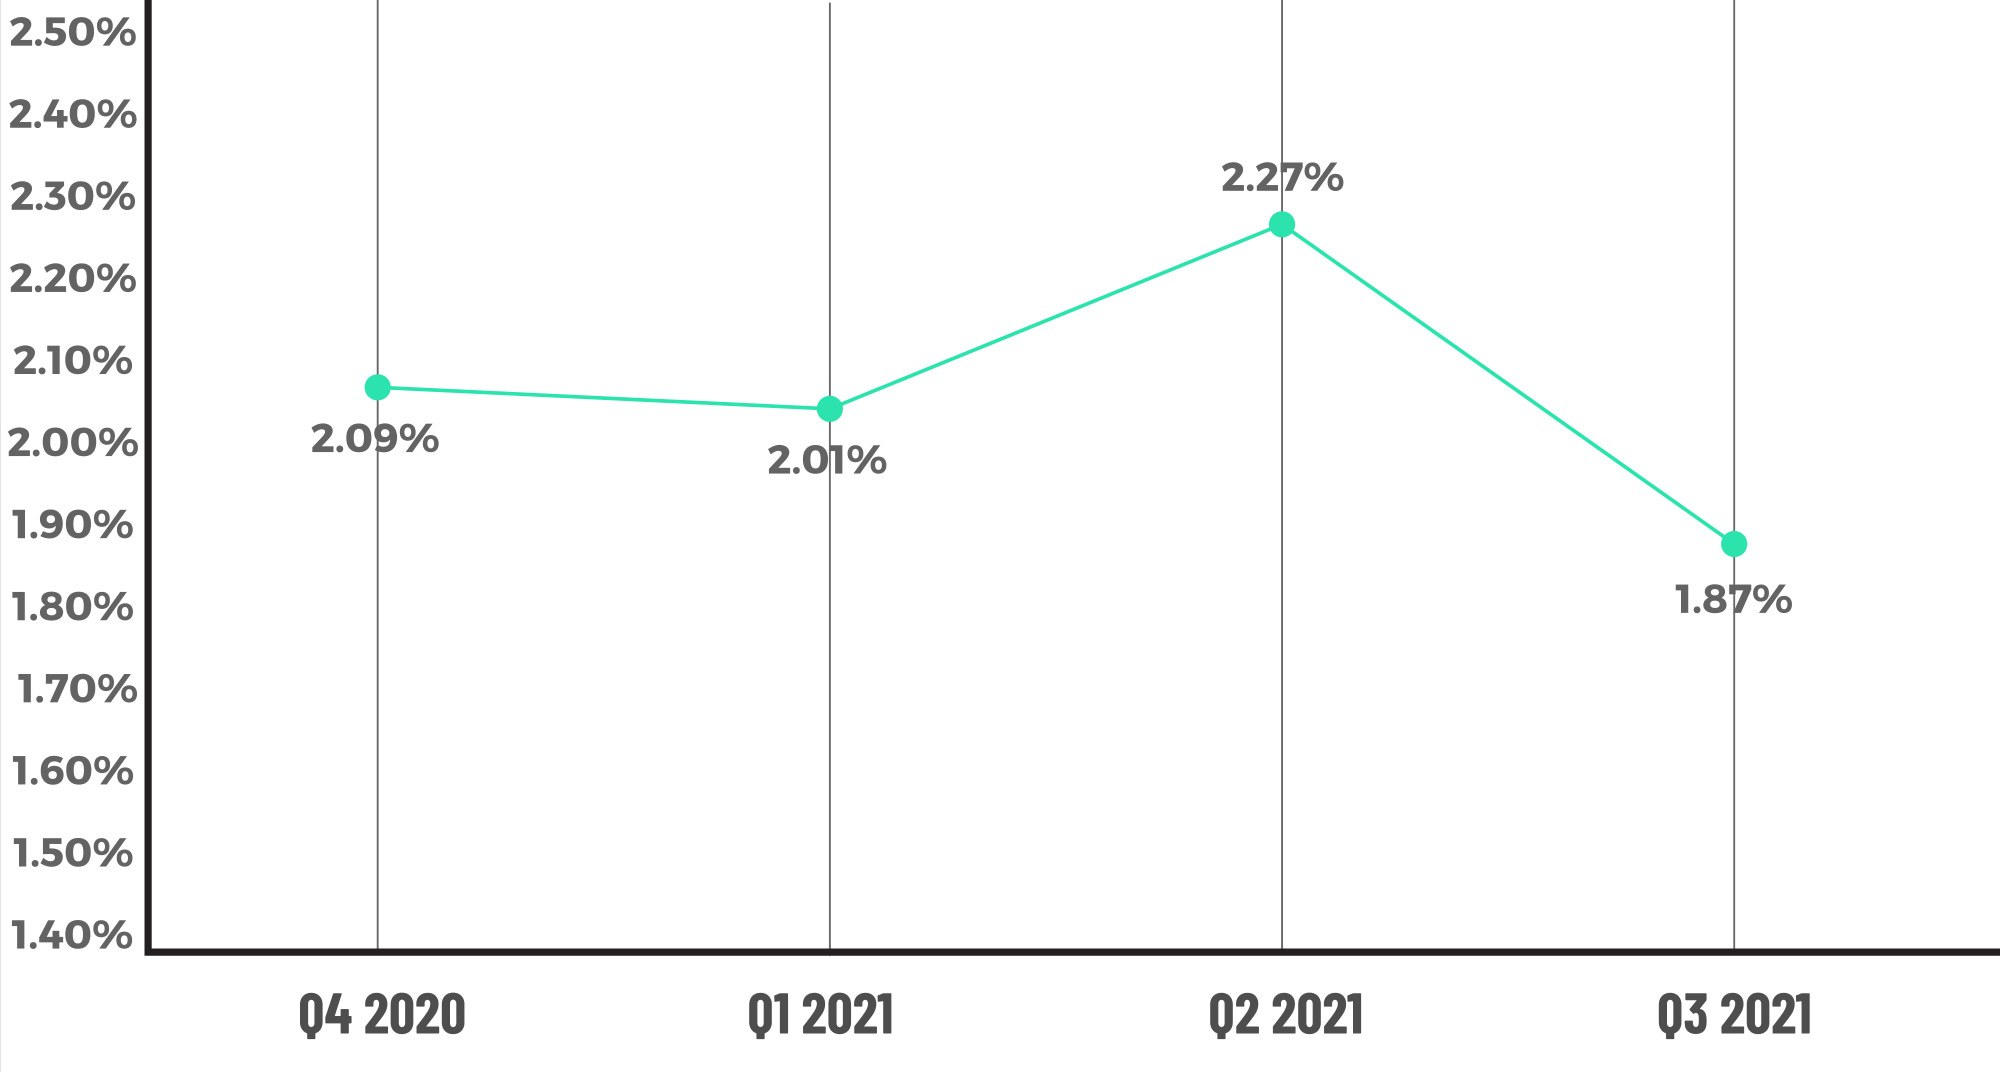
Figure 1 displays the percentage of loans with critical defects by quarter, for Q4 2020 through Q3 2021.
QC Industry Trends by Defect Category
Defects were again driven by the Income/Employment category, which made up 33.33% of all critical defects in Q3 2021 versus 32.08% in the prior quarter. The numbers continue a multi-quarter trend of increasing share of Income/Employment defects, and that category remains at an all-time high. It also illustrates, we believe, the difficulties that lenders face at the end of a refinance cycle where loans and borrower profiles tend to be more complex and difficult to qualify. Prior to spiking to the 30%+ level in the early days of the pandemic, defects in the Income/Employment category hovered in the low-to-mid 20% range. Given the overall improvement in unemployment rates in the past 12 months, the high levels of de- fects in this category mean lenders should re-double their underwriting efforts and institute targeted pre-funding quality control for the income calculation and documentation areas.
Including the Income/Employment category, three of the four core underwriting categories saw increases in defect share. The Assets category increased from 10% of all defects last quarter to 16.40% in Q3 2021. Liabilities increased slightly from 6.67% last quarter to 7.94% this quarter. The only core category that decreased was Credit, where defects fell from 7.50% last quarter to 5.29% this quarter. These categories speak directly to borrower health and lender origination quality. The overall critical defect rate can hinge on the performance of these categories, and lenders should monitor their own pipelines to see where to target their risk and quality control mitigation efforts.
The categories that saw improvement in defect share were led by the Appraisal and Loan Documentation categories. Appraisal defects continue to be low, declining to 2.12% of all defects in Q3 2021 and down from 5.42% last quarter. The rate/term refinance market continues to benefit from appraisal waivers, but lenders should be mindful of this category as the market transitions into higher purchases and cash-out refinances (including HELOC lending). Defects attributed to Loan Documentation problems also fell to a 7.41% share in Q3 2021 versus 12.5% in the prior quarter. We view defects in the Loan Documentation category as primarily related to strains on the manufacturing process and are not surprised to see this improvement. As processes normalize and turn times shorten, we expect that lenders have a prime opportunity to drive continued improvement in this category.
Critical Defects by Fannie Mae Category: Q3 2021
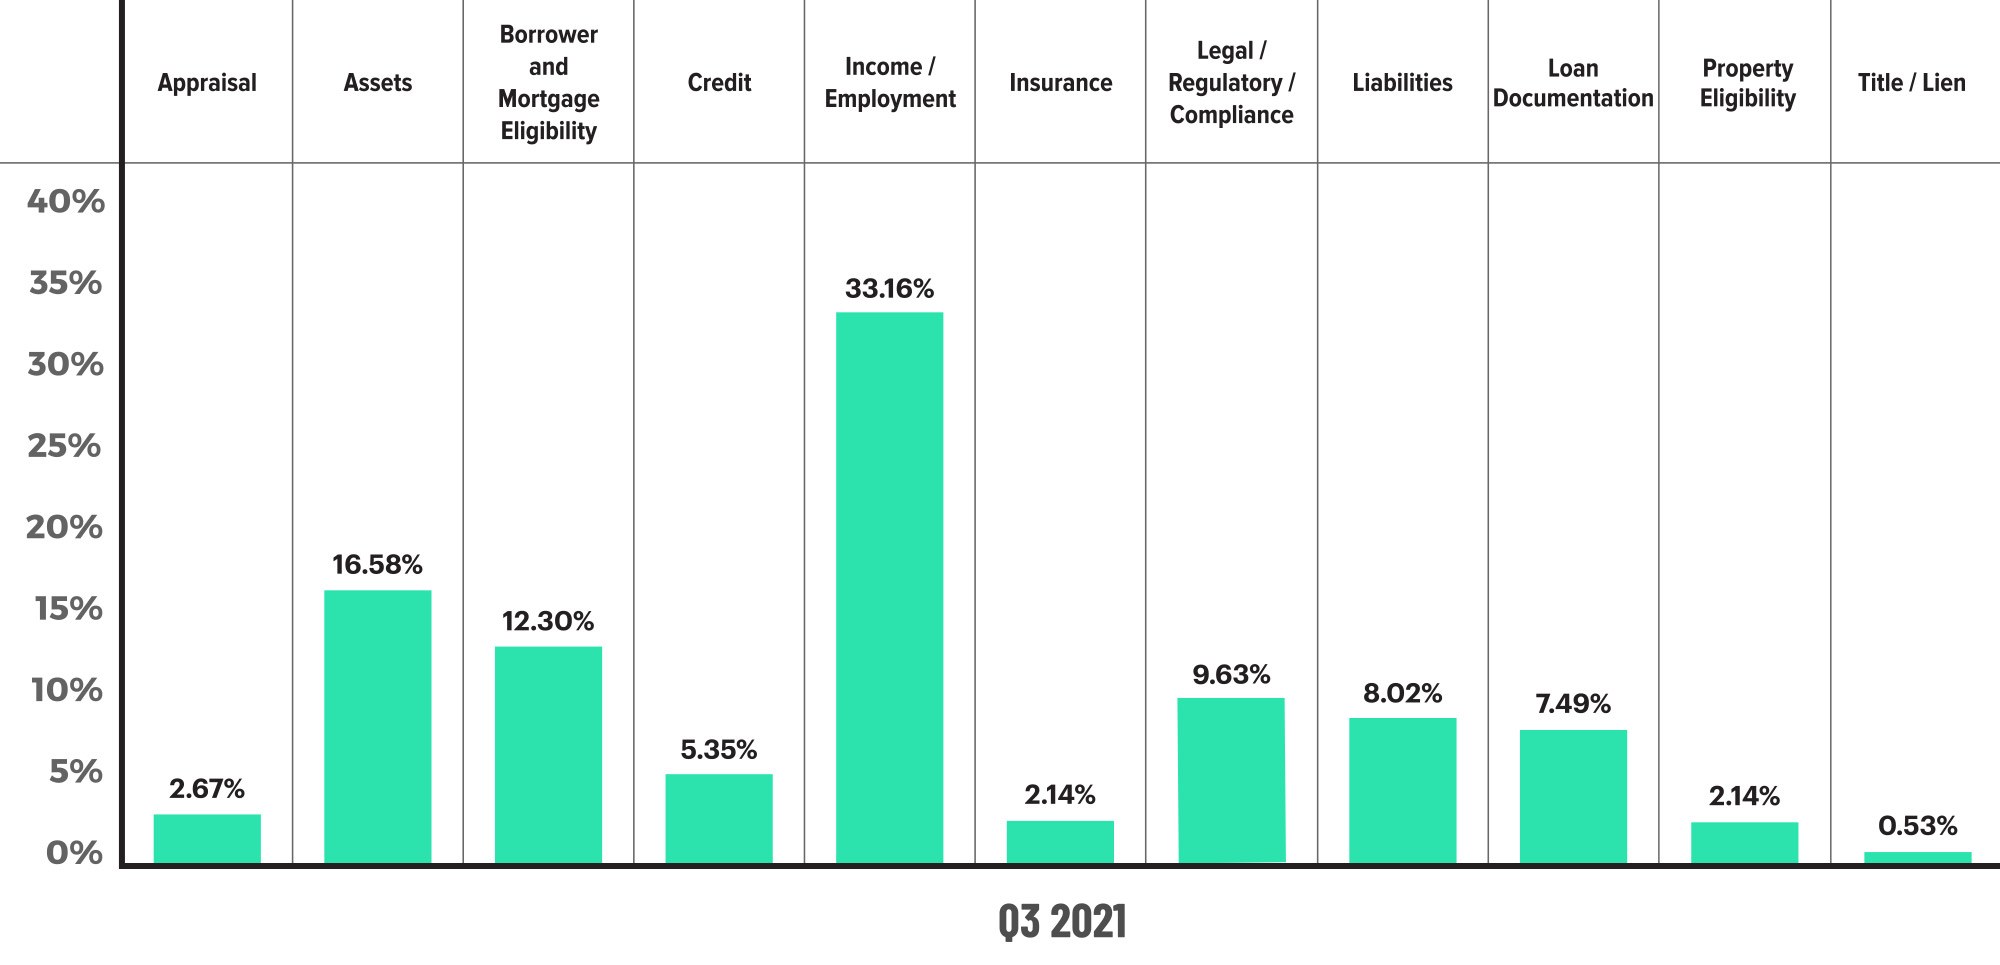
Figure 2 displays the dispersion of critical defects across Fannie Mae categories for Q3 2021.
Critical Defects by Fannie Mae Category: Q2 2021 vs. Q3 2021
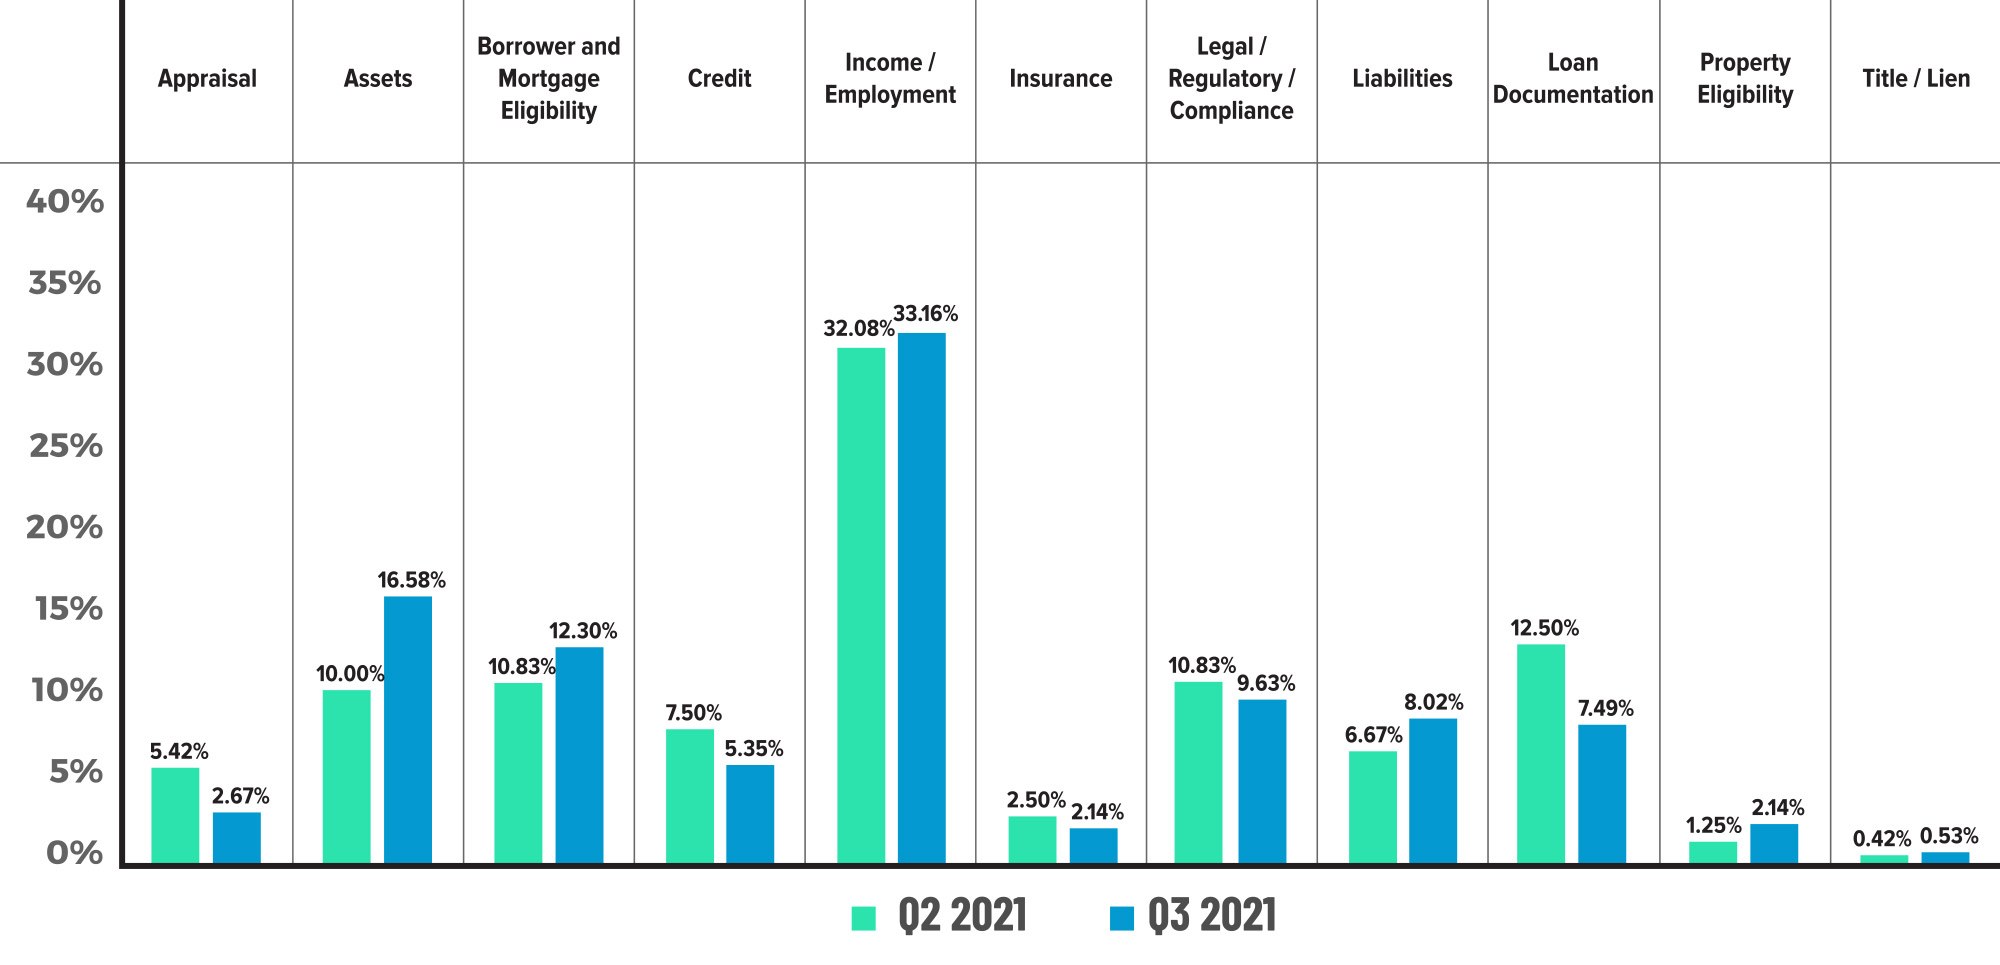
Figure 3 displays the critical defect rate by Fannie Mae category comparing Q1 2021 to Q2 2021.
QC Industry Trends by Loan Purpose
The mix of refinance and purchase loans was largely unchanged in Q3 2021. Refinances made up 43.01% of all reviews, which is similar to the prior quarter’s level of 43.19%. Purchase lending made up the remaining 56.99% (56.81% last quarter). As a reminder, the prior quarter (Q2 2021) is when we crossed the Rubicon, and purchases overtook refinances in share of all reviews. We expect this trend to continue for the foreseeable future.
As purchase loans become more dominant in the overall market, it’s important to look at performance. For critical defects in Q3 2021, the defect share was 58.22% for purchases and 41.78% for refinances. A good measure of performance is to look at defect share in relation to the review share, and any number above 0% means the share of defects was larger than the share of the reviews. For purchases, the performance number is +1.23% (58.22% defect share – 56.99% review share). In the prior quarter (Q2 2021), the performance number was -2.88% (53.93% defect share – 56.81% review share). Therefore, performance on purchase loans degraded slightly in the latest quarter.
In Q3 2021, the refinance market cooled while the refinance defect performance improved. Refinances made up 41.78% of the defects and 43.01% of the reviews – a performance number of -1.23%. By comparison, Q2 2021’s performance number was +2.88% (46.07% of defects – 43.19% share). These improvements are cause for cautious optimism, but lenders should not lose sight of refinance performance as this volume weans. As the majority of rate/term refinance incentive disappears, it is reasonable to assume that cash-out refinances will make up the preponderance of refinances going forward. These loans carry a much different level of defect risk than rate/terms.
Historically speaking, refinance defect share tends to lag review share, indicating better defect performance on refinances as compared to purchases. By and large, there are fewer moving parts and less parties involved in a refinance, and the underwriting is more straightforward. Appraisal requirements are also different, and rate/term refinances, streamlines and VA IRRRLs make for relatively easy work. The data on critical defects by loan purpose, therefore, appear to be reverting to the mean.
Critical Defects by Loan Purpose: Q3 2021

Figure 4 displays the loans reviewed and critical defects by loan purpose for Q3 2021.
QC Industry Trends by Loan Product Type
Without refinance tailwinds in Q2 2021, the share of conventional loans fell modestly. Of all reviews, conventional loans had a share of 67.88%, which was down from the prior quarter’s 70.53%. The beneficiaries of that change to the mix of product type were FHA (20.89%, up from 19.44% last quarter) and VA (8.62%, up from 7.10% last quarter). USDA held steady at 2.62%, whereas last quarter the USDA share was 2.94%. Conventional lending continues to dominate, but we can expect FHA to continue to pick up share as purchase lending overtakes refinance lending. Absent a “refinance boom”, the data shows that conventional lending tends to be in the 60% share range, and that is within sight over the next several quarters.
On the performance side, the data shows a material leap forward for conventional loans. In Q3 2021, conventional loans made up 53.79% of the defects (against a share of 67.88%). Last quarter, conventional loans comprised 72.25% of all defects, higher than the corresponding review share of 70.53%. FHA defects filled the gap, with defect share increasing to 31.03% this quarter from 21.99% last quarter. Thus, while defect performance on conventional and FHA loans has been volatile as the refinance cycle comes to end, the trend appears to be more a reversion to historical norms than a signal of potential problems in either product type.
Critical Defects by Loan Product Type: Q3 2021
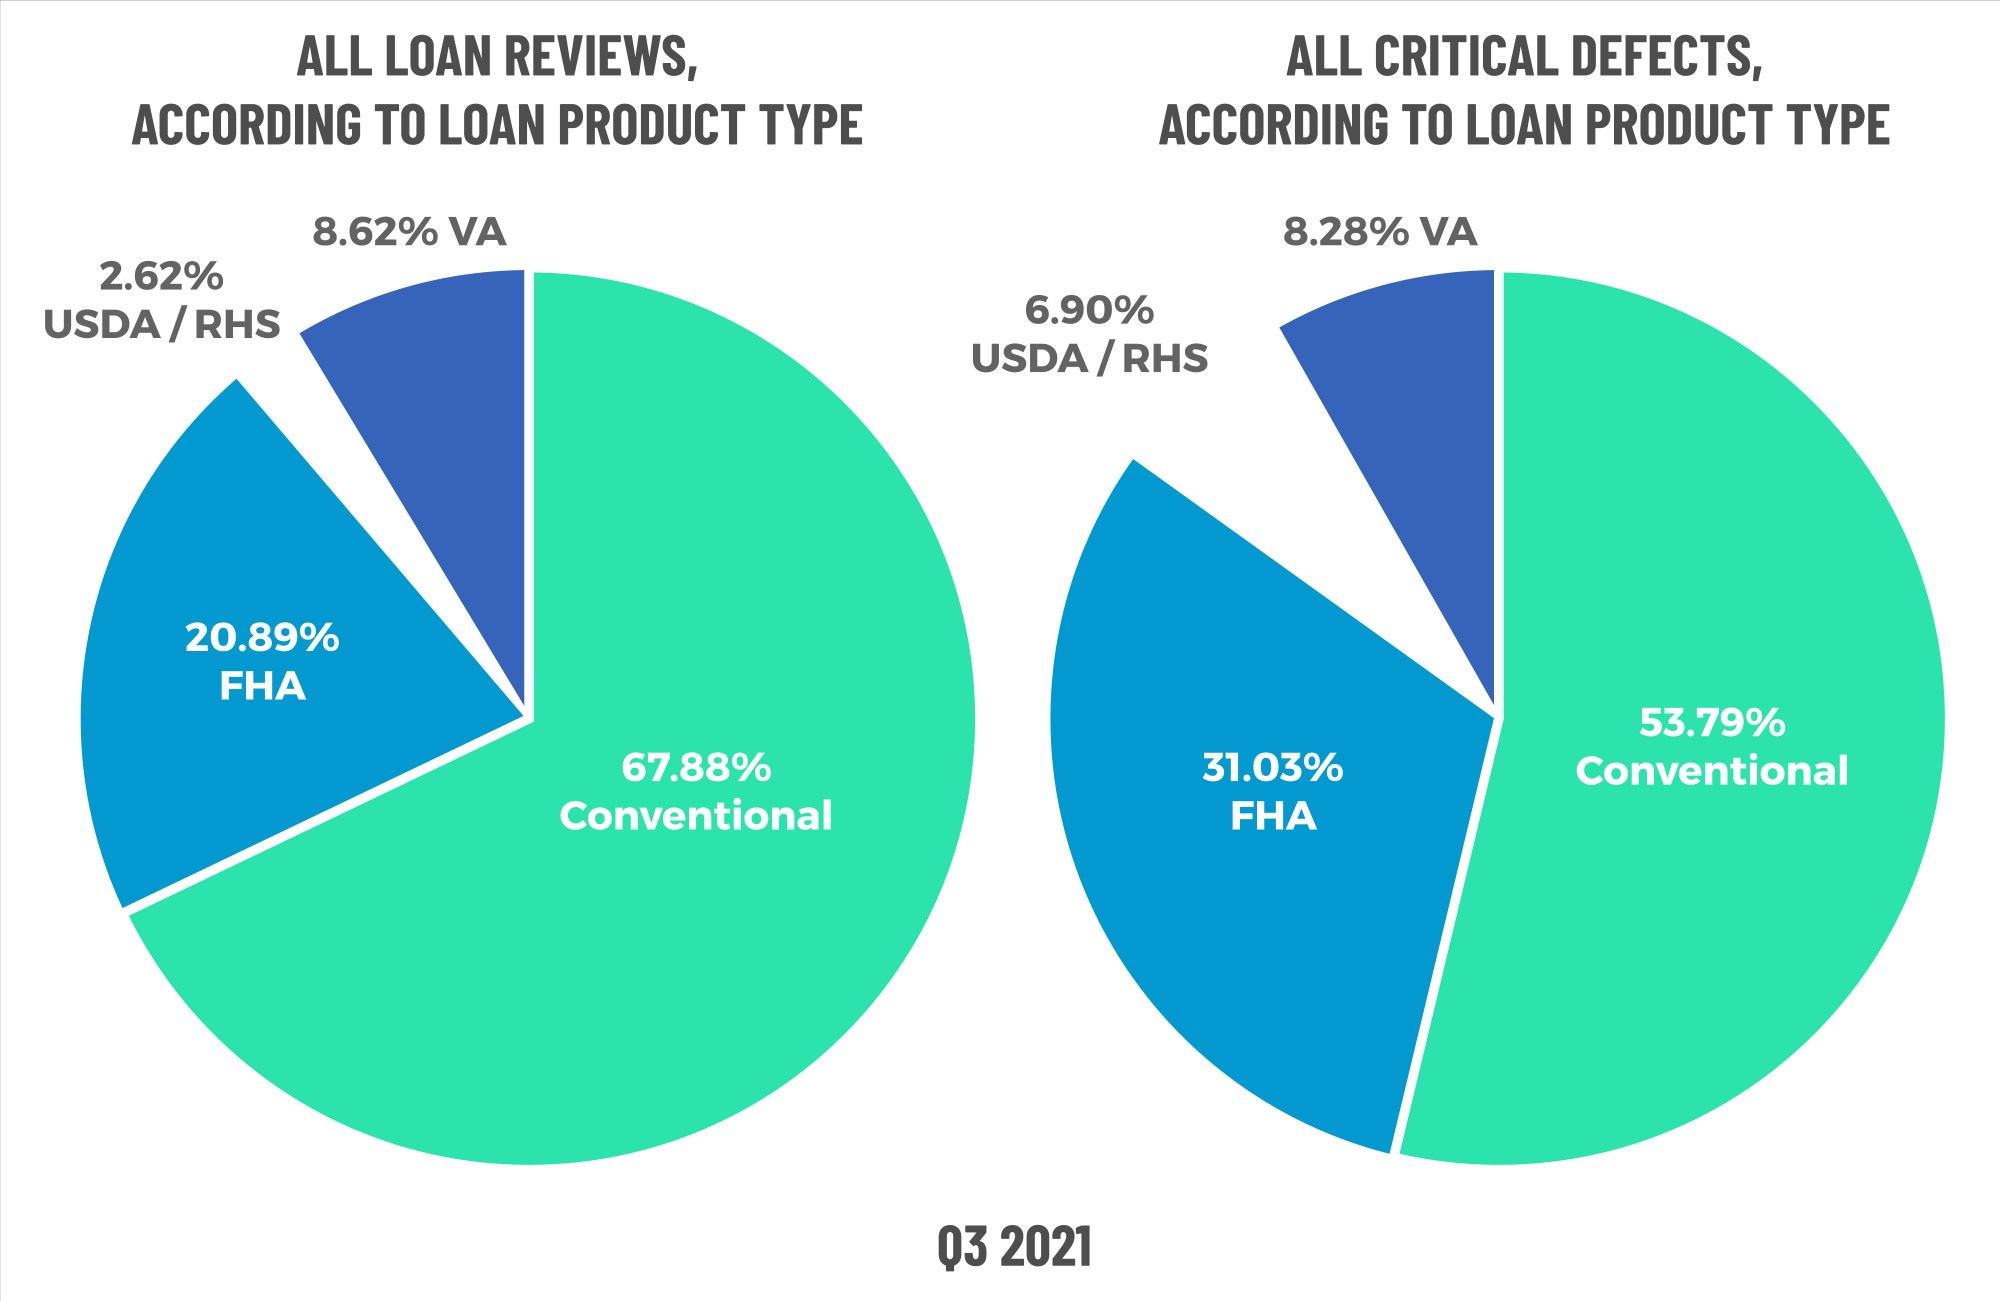
Figure 5 displays the loans reviewed and critical defects by loan type for Q3 2021.
Early Payment Defaults & Forebearance Plans
As 90+ day delinquencies improve to all-time lows and new loans entering into forbearance plans tail off, we will no longer be reporting on Early Payment Defaults (“EPDs”). We believe the vast majority of any repurchase risk is in the lender’s rearview mirror, and the key statistics to monitor going forward are post-forbearance exits and delinquencies.
To that end, we are paying close attention to Black Knight’s Mortgage Monitor. As of Q3 20213, new forbearance starts fell from prior periods, further supporting the argument that the worst of the EPD volume is behind us. Forbearance expirations peaked in October 2021 and remain elevated through early 2022. Black Knight estimates 500,000 active forbearances will expire in Q4 2021. As we move into 2022, it is estimated that just under 100,000 loans per month will be exiting forbearance. The industry is already shifting to compliance with the revised servicing rules enacted by the CFPB to address expiring forbearances. The ultimate resolution of those loans could impact not only delinquencies but also lending volumes. There are some interesting statistics in the data concerning resolution. Of the 84% of borrowers that have exited forbearance, 51% have reperformed, and 23% have paid-in-full. That still leaves a substantial number of borrowers (505,000 according to Black Knight) in loss mitigation. With the number of near-term forbearances expiring, we can expect that number to grow.
3 https://www.blackknightinc.com/wp-content/uploads/2021/11/BKI_MM_Sept2021_Report.pdf
Economic Discussion
As has been widely felt by consumers and reported by the media, inflation is no longer being defined as “transitory”. Inflation remains the primary risk and concern for our industry going forward.
The Federal Reserve uses two primary tools to cool inflation when it believes the economy has the potential to overheat, and both are viewed as negative to the business of originating residential mortgages. The most obvious tool is to raise the Fed Funds rate, which has the effect of driving up interest rates overall — including mortgage interest rates. The second tool is to slow down or stop buying bonds in the open market. The Fed has been a prolific buyer of mortgage bonds since the pandemic began and, early on, was purchasing $120 billion per month of Treasury and mortgage bonds. Purchasing these bonds adds significant demand to the secondary market, which drives interest rates lower (“Bonds 101” primer: increases to demand push prices up, and yields move inversely to price). The Fed has slowly tapered its buying of bonds, purchasing only $10 billion or so mortgage bonds in February 2022, and is expected to cease purchases altogether in March.
Inflation impacts everything, including housing affordability. We see some potential warning signs as strong property appreciation intersects with increasing interest rates. To give you a sense of that, let us use the average mortgage size of $453,000 (as of year-end 2021). As we reported earlier in this report, the average interest rate on a 30-year fixed rate mortgage in Q3 2021 was 2.87%. As of March 2022, that average rate is 4.67%. The P&I payment, if the loan was originated in Q3 2021, is $1,878. If that same loan was originated in February 2022, the P&I payment would be $2,341. That means that the monthly payment would be $463 higher for the same loan, an increase of 25%.
Most observers view housing appreciation as a positive sign, and indeed, when analyzing mortgage quality, it is hard to argue that increasing home values is a negative. Though, when overlayed with rising interest rates and an expectation for those rates to rise further, a picture begins to emerge that eventually something has to give. Could we see localized pockets of negative equity? Could we see an increase in defaults? That seems within the realm of possibility, and risk managers, banks and lenders alike should be cognizant of this risk in the coming months, even years.
Conclusion
Any quarter than concludes with an improvement in the critical defect rate should be viewed positively, and the third quarter of 2021 is no different. The lending environment continues to be dynamic with lots of near-term unknowns. Given the economic and geopolitical environments, it is more likely that we will see continued volatility (increases/ decreases in either direction) in the critical defect than we will see multi-quarter trending in either direction. All eyes going forward will be on inflation, interest rates, and how the ongoing military conflict in Ukraine will affect the global economy.
About the ACES Mortgage QC Industry Trends Report
The ACES Mortgage QC Industry Trends Report represents a nationwide post-closing quality control analysis using data and findings derived from mortgage lenders utilizing the ACES Analytics benchmarking software.
This report provides an in-depth analysis of residential mortgage critical defects as reported during post-closing quality control audits. Data presented comprises net critical defects and is categorized in accordance with the Fannie Mae loan defect taxonomy.
About ACES
ACES Quality Management is the leading provider of enterprise quality management and control software for the financial services industry. The nation’s most prominent lenders, servicers and financial institutions rely on ACES Quality Management & Control® Software to improve audit throughput and quality while controlling costs, including:
- 3 of the top 5 and more than 50% of the top 50 independent mortgage lenders;
- 7 of the top 10 loan servicers;
- 11 of the top 30 banks; and
- 1 of the top 3 credit unions in the USA.
Unlike other quality control platforms, only ACES delivers Flexible Audit Technology, which gives independent mortgage lenders and financial institutions the ability to easily manage and customize ACES to meet their business needs without having to rely on IT or other outside resources. Using a customer-centric approach, ACES clients get responsive support and access to our experts to maximize their investment.
For more information, visit www.acesquality.com or call 1-800-858-1598.
Media Contact: Lindsey Neal | DepthPR for ACES | (404) 549-9282 | lindsey@depthpr.com
View all reports