ACES’ Mortgage QC Industry Trends Report represents an analysis of nationwide quality control findings based on data derived from the ACES Quality Management & Control Software.
Executive Summary
QC Industry Trends – Overview
QC Industry Trends – by Category
QC Industry Trends – by Loan Purpose
QC Industry Trends – by Loan Product Type
Economic Discussion
Conclusion
About this Report
Executive Summary
This report represents an analysis of post-closing quality control data derived from loan files analyzed by the ACES Quality Management and Control® benchmarking system during the third quarter of 2022 (Q3 2022) and incorporates data from prior quarters and/or calendar years, where applicable.
Findings for the Q3 2022 Trends Report were based on quality control data from approximately 50,000 unique records. Volumes are essential to this analysis, and the included records reflect trends in overall origination volumes. However, data from additional lenders is added to this analysis once the lender’s QC review seasoning within the ACES software reaches the 12-month bar. Therefore, the overall volume in the QC Trends Report does not precisely mirror the overall market. All reviews and defect data evaluated for this report were based on post-close loan audits selected by lenders for full file reviews.
Defects are categorized using the Fannie Mae loan defect taxonomy. Data analysis for any given quarter does not begin until 90 days after the end of the quarter to allow lenders to complete the post-closing quality control cycle, resulting in a delay between the end of the quarter and our publication of the data.
NOTE: A critical defect is defined as a defect that would result in the loan being uninsurable or ineligible for sale. The critical defect rate reflects the percentage of loans reviewed for which at least one critical defect was identified during the post-closing quality control review. All reported defects are net defects.
Summary of Findings
Defect rates continued to rise in Q3 2022, reaching a report high of 2.47%. As noted earlier in this report, the sharp decline in origination volume (and, therefore, review volume) plays a role in this sharp increase. However, that does not tell the whole story, as three out of the four major underwriting categories also increased in the quarter. In fact, six out of the 10 categories covered in this quarter’s report saw moderate to significant increases in defects. As expected, purchase loan share continued to increase this quarter, with observed defect increases in the conventional and FHA loan categories.
Report highlights include the following findings:
- The overall critical defect rate increased 20.5% over Q2 2022, ending the quarter at 2.47% — a report high.
- Of the four major underwriting categories (Assets, Credit, Income/Employment and Liabilities), three saw moderate to significant increases in Q2 2022. Income/Employment remained the leading category of defects reported, despite continuing its multi-quarter trend of decline.
- A sub-category analysis of the Assets and Income/Employment categories uncovered troubling defect trends related to eligibility.
- Appraisal defects declined once again, now reflecting a multi-quarter trend.
- Purchase share dominated in Q3 2022, as expected given market conditions, while review share for FHA, USDA and VA loans increased.
- In a reversal of last quarter’s findings, FHA defect share saw a moderate increase in Q3 2022, along with a slight defect increase in conventional loans. USDA and VA loan defects improved significantly last quarter.
QC Industry Trends – Overview
Critical defects for Q3 2022 increased to an all-time high of 2.47%, rising 20.5% from the prior quarter. Last quarter’s report highlighted the significance of crossing the 2% threshold, and those concerns hold for this quarter, despite the impact of this quarter’s smaller overall review share on the defect rate. The last time the overall defect rate reached 2% or more in consecutive quarters was in the “COVID quarters” of Q3 2020 – Q2 2021*, and we attributed those increases to the historic volumes, rapidly changing compliance environment and challenging economic conditions – all of which were triggered by the pandemic.
While the economic challenges persist in Q3 2022, the same cannot be said for the volume or regulatory environment. In this case, the dramatic decline in origination volume had the most impact on the overall critical defect rate. Interest rates remained steady at around 5% throughout the first two months of the quarter before rising more than 100 basis points in September and reaching 6.7% by month’s end1. It also bears mentioning that the average interest rate was 2.87% for the same quarter in the prior year (Q3 2021). For consumers already rattled by the previous quarter’s 100 basis point increase, Q3’s interest rates only further solidified their decision to hold off on purchasing a home, thus driving volumes down even further. Purchase originations declined 19% quarter-over-quarter in Q3 2022 and 47% year-over-year — the most significant annual drop observed in more than 20 years2.
The effect of declining origination volume on the defect rate is twofold. First, there is the pure mathematical factor. As volume drops, the pool of loans from which lenders select for review becomes smaller. Fewer loans originated means fewer loans available for review, and with a smaller sample size, outliers (e.g., defects) become far more pronounced when viewed in relation to the whole. Secondarily, a tighter origination market amps up competition for business, often leading lenders to ride the line regarding borrower qualification to capture as much business as possible. Operating that close to the edge leaves little room for error, thus making defects far more likely to occur.
One bright spot continues to be property appreciation, at least in terms of its impact on the overall critical defect rate. Appraisal defects are down again in Q3 2023, marking three straight quarters of decline and are now comparable to levels observed in Q3 2021. The main concern here has been the impact of rising interest rates on home value appreciation and, by extension, appraisal-related defects. While single-family home prices increased by 13.8% in Q3, the growth rate was lower than the prior quarter’s 19.1% increase3. Thus, home value growth does seem to be slowing, but that adjustment has not impacted appraisals to the point that they would drive up defect rates, which is a positive sign. However, we will continue to monitor this area closely, as property appreciation has been the safety net preventing the current downturn from becoming a repeat of the 2008/2009 market.
* The Q2 2022 Mortgage QC Trends Report stated that Q2 2022’s 2.05% defect rate marked the third time the defect rate exceeded 2%. This is incorrect. We apologize for the error.
1 http://www.freddiemac.com/pmms/
3 https://www.fanniemae.com/newsroom/fannie-mae-news/ home-price-growth-decelerated-third-quarter
Critical Defect Rate by Quarter: Q4 2021 — Q3 2022

Figure 1 displays the percentage of loans with critical defects by quarter, for Q4 2021 through Q3 2022.
QC Industry Trends by Defect Category
For 12 straight quarters, Income/Employment has been the leading category of defects, though it continues to see improvement. While comprising 24.66% of all defects found in Q3 2022, its share declined 8.4% from Q2 2022’s share of 26.92%. On the surface, this would appear to be positive news. However, an analysis of the sub-categories within this area found some troubling results. Within the overall Income/Employment category, defects related to eligibility more than doubled between Q2 and Q3 2022, rising 102.27% from 11.9% in Q2 to 24.07% in Q3. Documentation errors also grew quarter-over-quarter, increasing 52.47% from 45.24% in Q2 to 55.56% in Q3.
As one of the “big four” underwriting-related categories, this is cause for concern despite the overall decrease in this defect category. Examining the other three categories comprising this group – Assets, Credit and Liabilities – found increases in all three areas. This quarter marks the second straight increase in the Credit category, which was up 15.69% over the prior quarter and ranks as the second-highest defect category for this quarter. A sub-category analysis here also found a significant increase in eligibility errors, comprising nearly two-thirds of all credit-related defects and increasing 40.66% over Q2.
While not considered one of the four core underwriting categories, Borrower and Mortgage Eligibility defects also increased for the second straight quarter, rising 18.73% in Q3 over Q2. The overwhelming increase in eligibility-related defects across multiple categories speaks to a highly competitive mortgage market in which lenders may become more aggressive in qualifying borrowers. However, lenders must be careful not to hew too closely to the edge, as funded loans that are ineligible for sale due to defects can have an equally detrimental effect on profitability as a lack of new business.
Conversely, defects in the Loan Documentation category, which dominated the previous quarter’s findings, have reversed course in Q3, declining 33.2% from 20.51.% in Q2 to 13.7% in Q3. This seems to be more within the range of quarters past, indicating that the previous quarter’s spike could largely be attributed to the turmoil surrounding the rapidly rising rate environment and staffing volatility.
As noted earlier, appraisal defects continue to trend downward, declining 28.83% in Q3 and representing the second-fewest defects of any category in this quarter’s report. With the pace of home value appreciation slowing in response to the rate environment, however, this area will continue to bear scrutiny, as appraisals tend to serve as a bellwether for larger trouble in the overall housing market.
One note on this quarter’s rise in the Legal/Regulatory/Compliance category – a substantial increase in this area would typically be a cause for concern. However, a significant driver of defects in this category appears to be a systemic issue with a single data contributor to this report. Therefore, we feel reasonably confident that this increase is not an indicator of more extensive, industry-wide concerns.
Critical Defects by Fannie Mae Category: Q3 2022
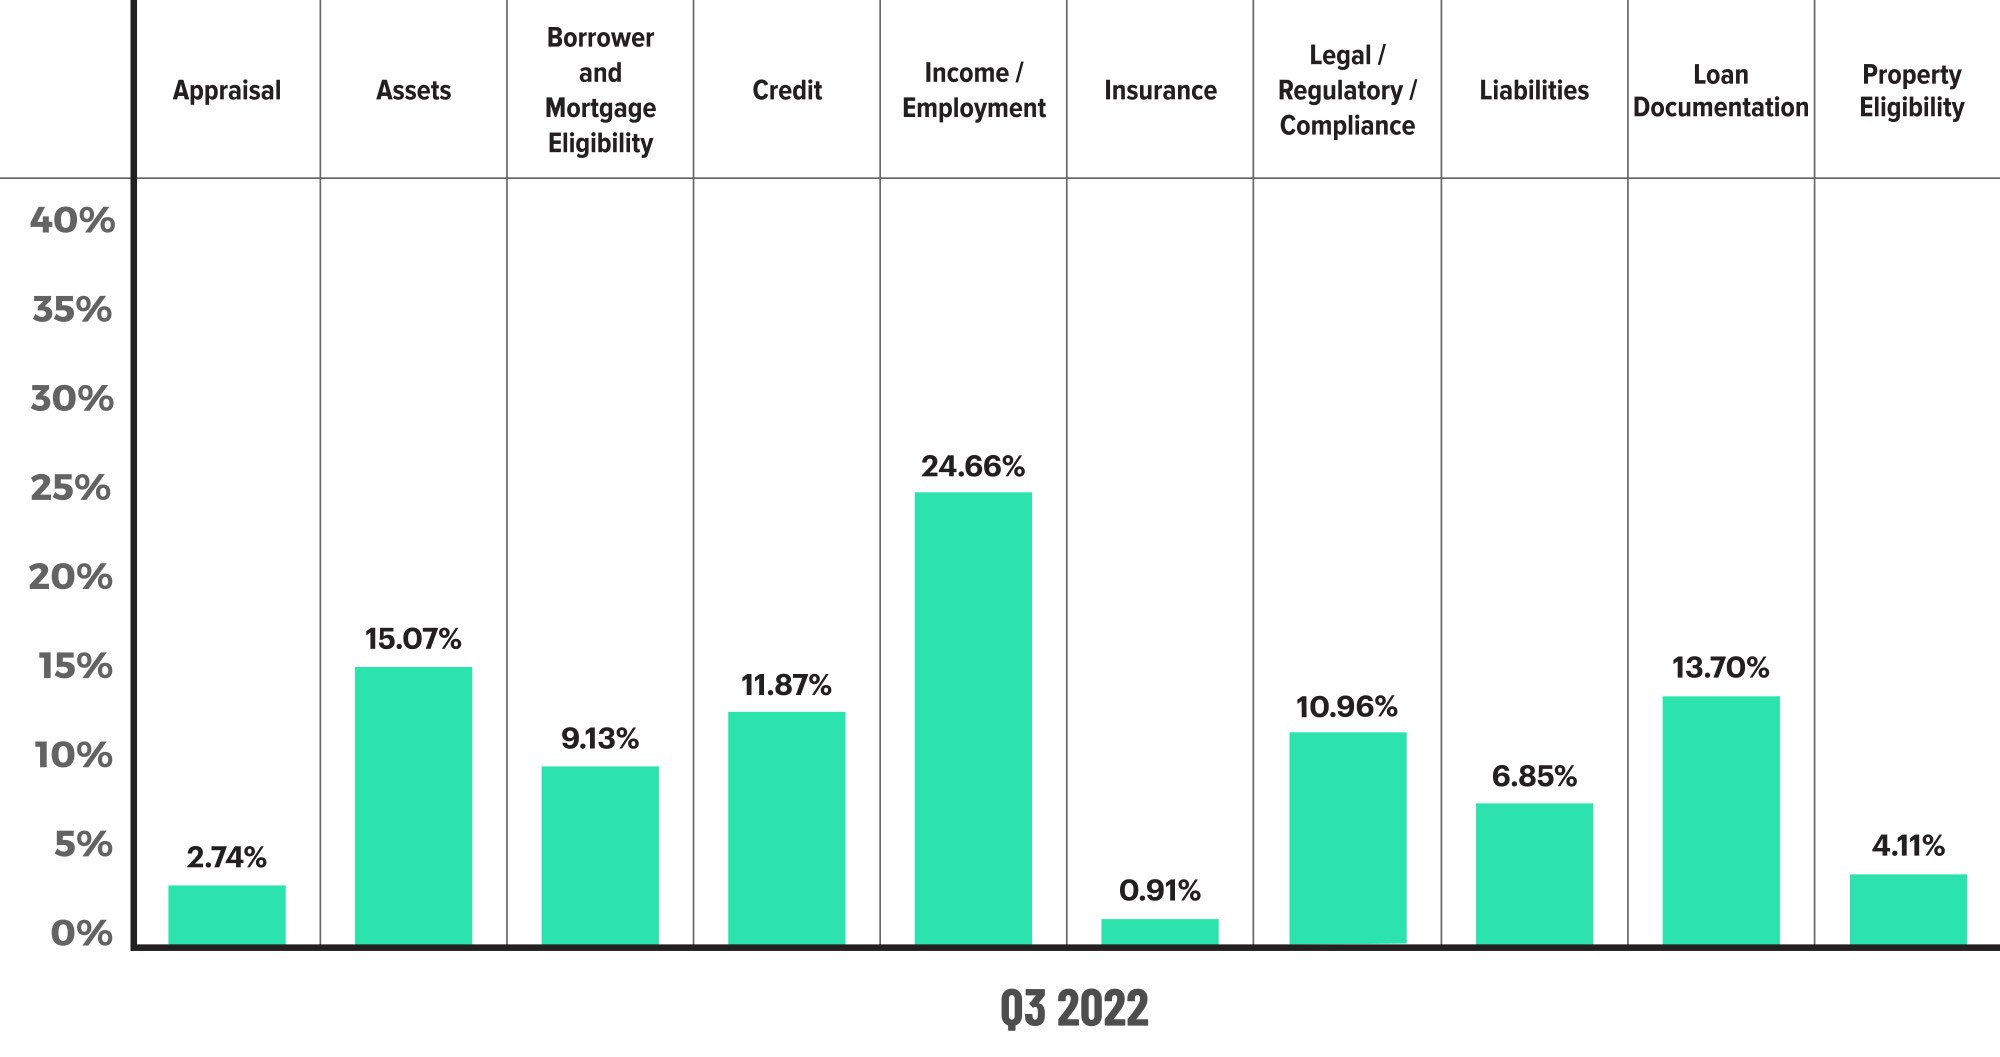
Figure 2 displays the dispersion of critical defects across Fannie Mae categories for Q3 2022.
Critical Defects by Fannie Mae Category: Q2 2022 vs. Q3 2022
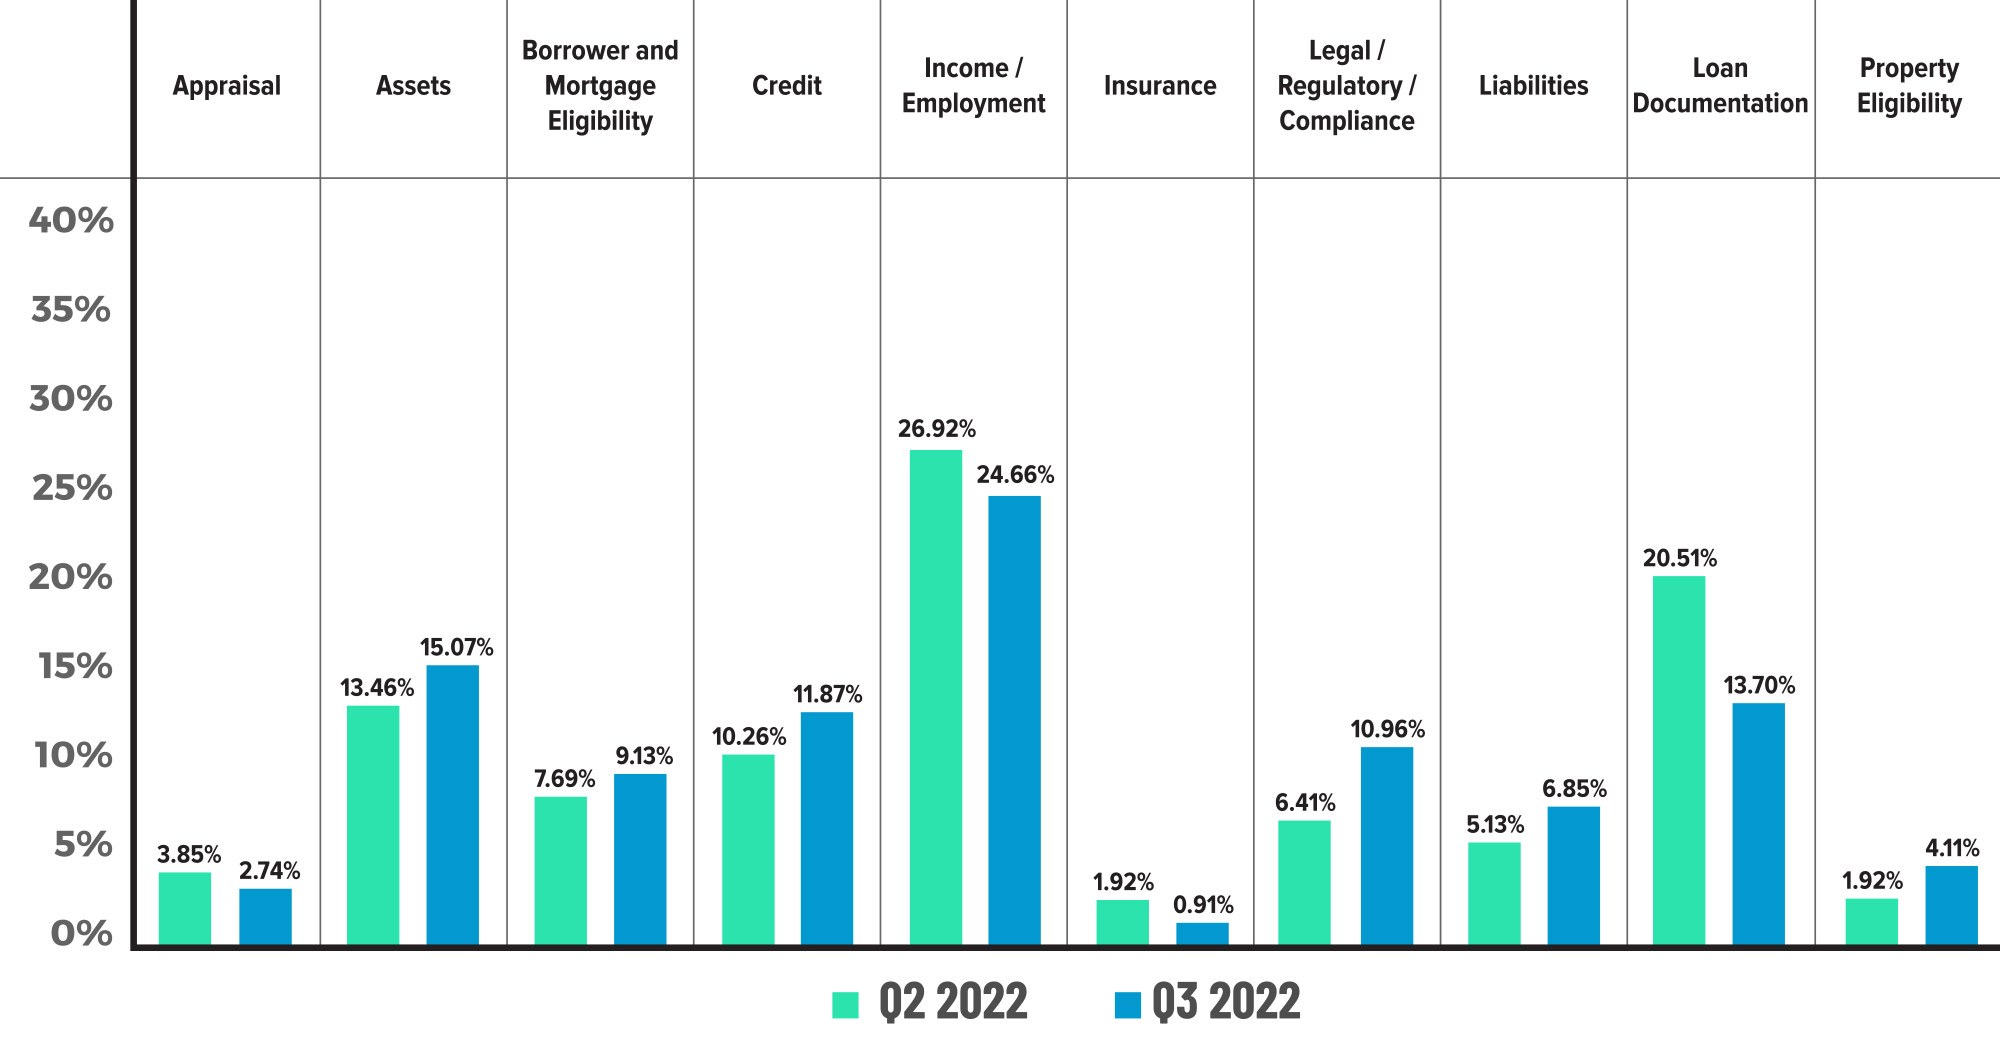
Figure 3 displays the critical defect rate by Fannie Mae category, comparing Q2 2022 to Q3 2022.
Critical Defects by Fannie Mae Sub-Category: Q3 2022
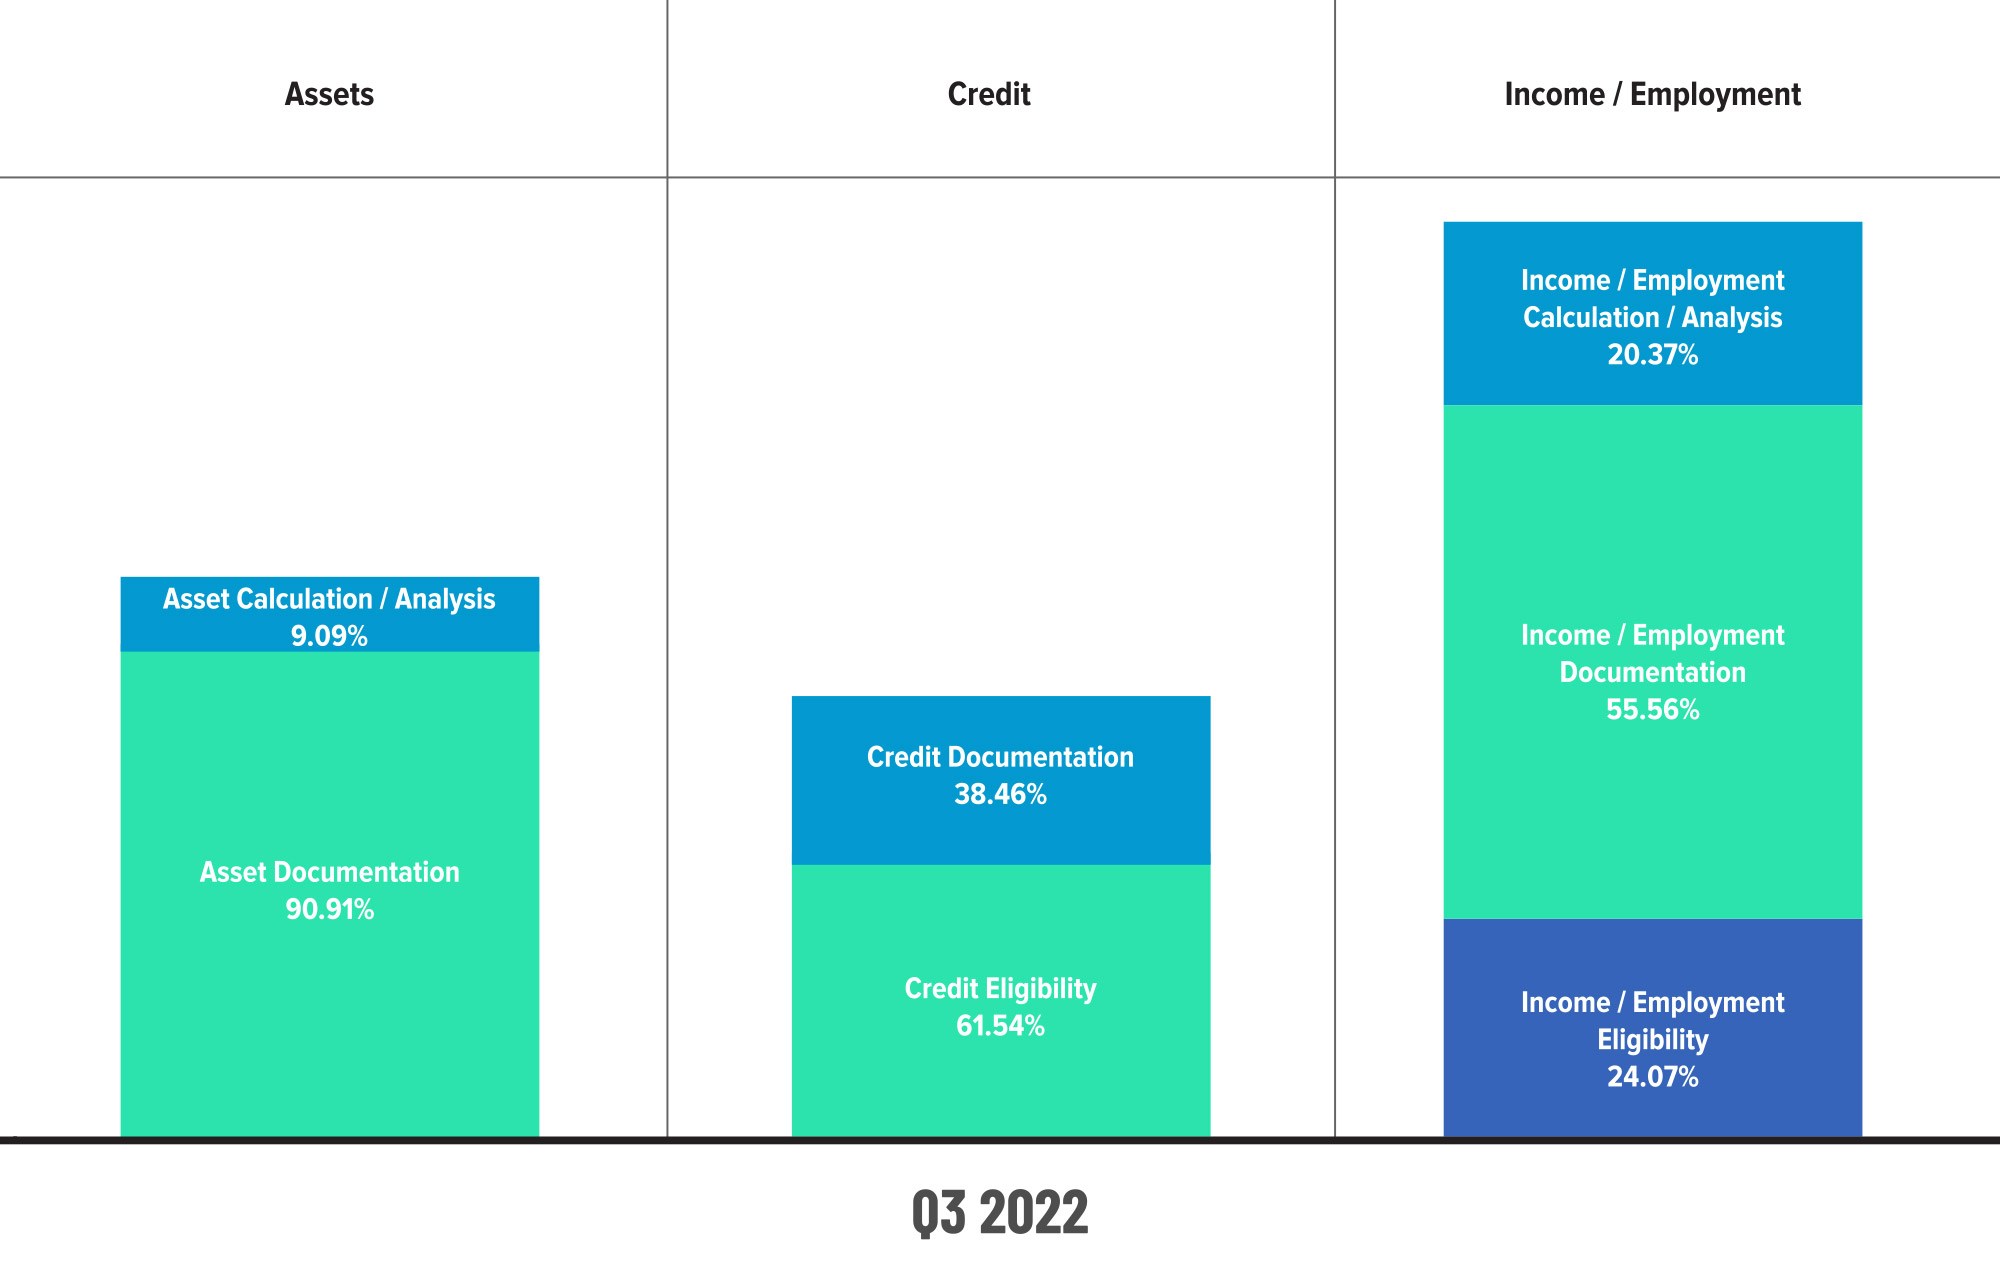
Figure 4 displays sub-category information for Q3 2022 within the Assets, Credit and Income / Employment categories.
Critical Defects by Fannie Mae Sub-Category: Q2 2022 vs. Q3 2022
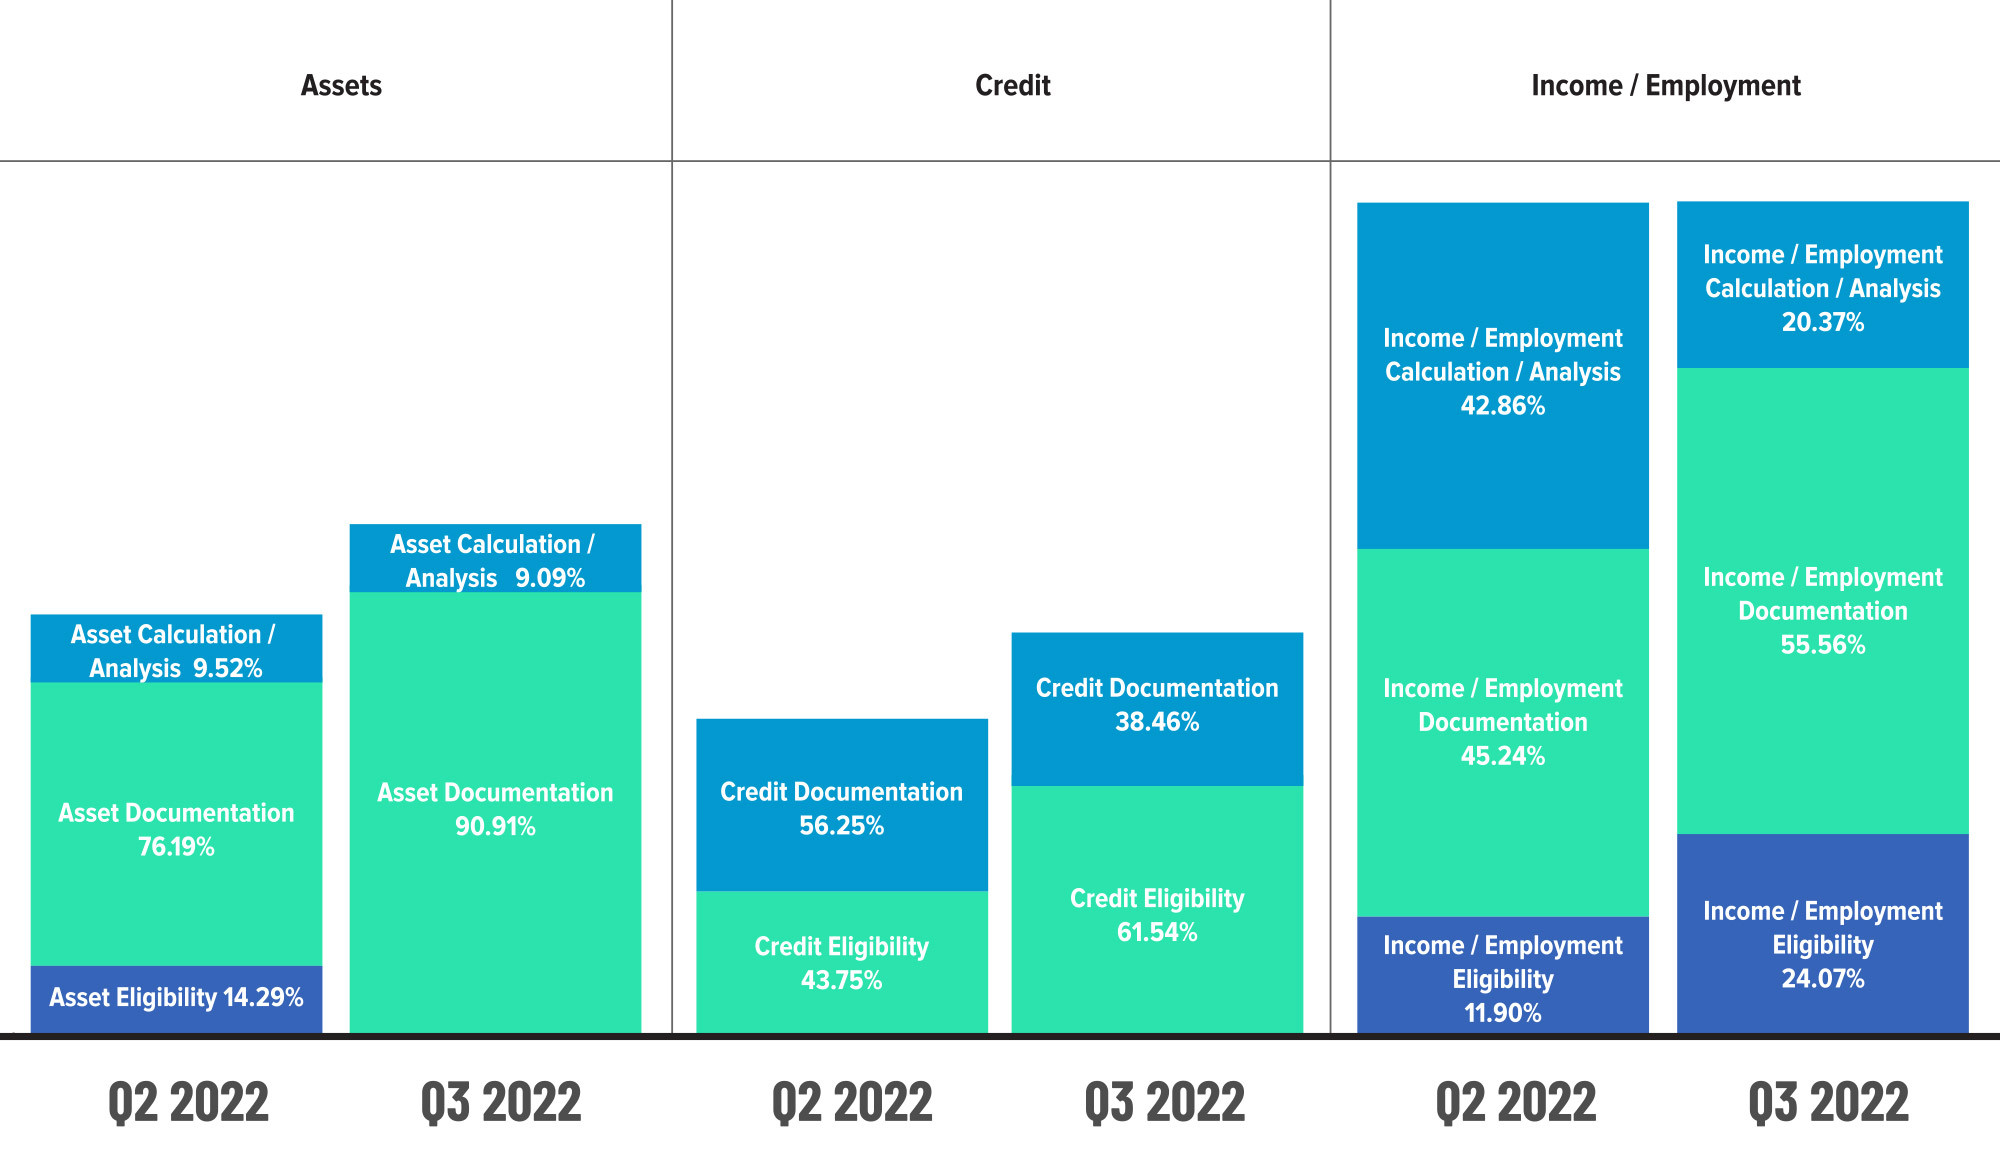
Figure 5 displays sub-category information within the Assets, Credit and Income/Employment categories, comparing Q2 2022 to Q3 2022.
QC Industry Trends by Loan Purpose
If Q2 2022 marked the end of the refinance boom, Q3 solidified the transition into a purchase market, with purchase reviews up 12.48% for a total review share of 81.84%. Consequently, refinance review share dropped by a third (33.33%), comprising 18.16% of all reviews.
Regarding defect parity, the story last quarter was the disparity between purchase reviews and defect share, with the former outweighing the latter due to significant defects in the USDA and VA loan categories. While disparity also exists in this quarter’s findings, the pendulum has swung in the opposite direction, with purchase review share exceeding defect share. However, the contrary proved true for refinances, as defect share surpassed review share for this quarter.
At the risk of sounding like a broken record, the rising rate environment likely played a role in the lack of defect parity in refinance reviews. Unlike during the refinance boom, borrowers opting for a refi in the current market were likely doing so for reasons other than simply locking in a lower rate. Thus, these transactions may have been more complex, increasing the possibility of errors. Given that the rate environment is not likely to materially change any time soon, lenders would be wise to increase their scrutiny of refinance transactions in the coming quarters.
Critical Defects by Loan Purpose: Q3 2022
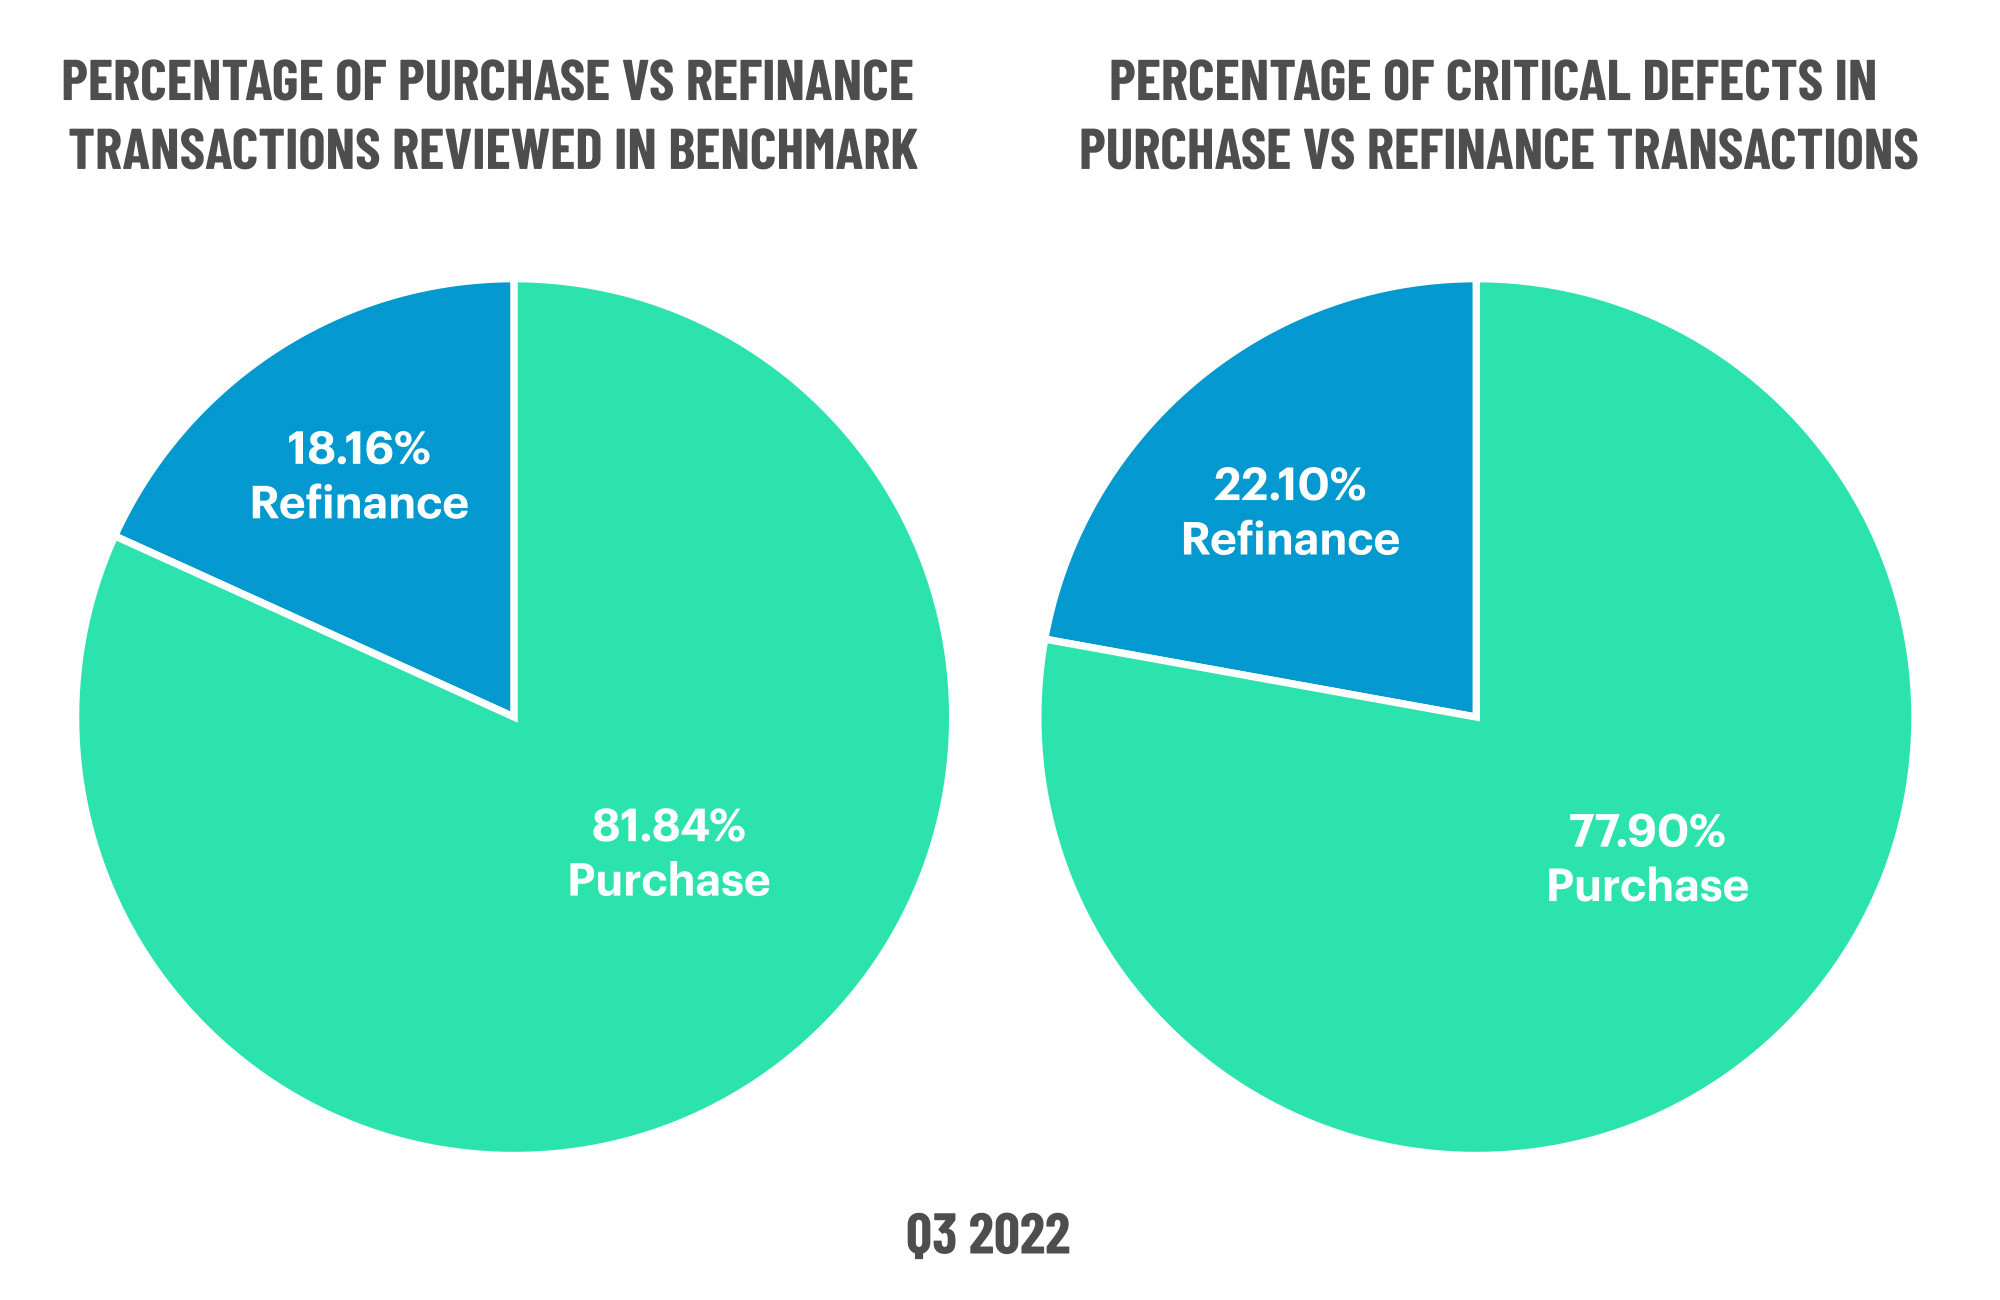
Figure 6 displays the loans reviewed and critical defects by loan purpose for Q3 2022.
QC Industry Trends by Loan Product Type
Gains in conventional loan share last quarter reversed course in Q3, declining 4.83% from the previous quarter. Historically, conventional loan share has averaged between 65% and 70%. At 62.64%, Q3’s share falls below those historical norms, while the share of FHA, USDA and VA loans all increased.
Several reasons could explain this shift in review trends. As was widely reported at the start of the COVID-19 pandemic, homebuyers shifted their focus from large, urban centers to more suburban and rural areas, as work-from-home orders eliminated the need for employees to be within commuting distance to their jobs and people sought more affordable housing that could also provide additional space. As such, loan programs aimed at making homeownership more affordable (e.g., FHA, USDA and VA) would consequently become more popular. As volumes dwindled in Q3, those lenders that developed a particular expertise in these types of loans may have leaned more heavily into those products to bolster their new business pipeline.
In addition, Q3 saw a continued increase in the availability of down payment assistance (DPA) programs. Between Q4 2021 and Q3 2022, 117 new DPA programs were made available to assist homebuyers in meeting increasing down payment requirements4. Industry data estimates that the median down payment in Q3 2022 nearly doubled from pre-pandemic levels5. As many (though not all) of these programs are designed to work in conjunction with FHA, USDA and VA loans, the rise in DPA programs would naturally fuel an increase in these loan products.
The good news is USDA and VA defect share reversed course from Q3, declining 17.49% and 32.42%, respectively. However, the same cannot be said for conventional or FHA defect share, both of which rose in Q3. While conventional defect share only increased 5.66%, FHA defect share grew nearly three times that, rising 15.09% over Q2. Given the growth in all but three defect categories noted earlier in this report, it is unsurprising to see an increase in defect share. FHA loans are notoriously tricky to originate. If FHA loan specialists were included in any industry layoffs that have continued to occur, that would have a material impact on defects for this particular category. The rise in conventional defects is modest, all things considered, but lenders should still keep an eye on this to ensure this trend does not continue.
5 https://www.redfin.com/news/homebuyer-down-payments-doubled-during-pandemic/
Critical Defects by Loan Product Type: Q3 2022

Figure 7 displays the loans reviewed and critical defects by loan type for Q3 2022.
Economic Discussion
In past reports, larger geopolitical events, like the war in Ukraine, and “the COVID effect” have provided context around defect findings. For this quarter, the main story is the rate environment and the downstream impacts of that on origination volumes, operations and lending trends overall. Back-to-back quarters of 100+ basis-point jumps in interest rates sent shockwaves through the mortgage market, and few, if any, lenders could avoid the effects, though some took a more significant hit than others.
To put the drop into context, Q1 2021 marked the single highest quarter for mortgage originations since Q3 2005, with single-family mortgage originations totaling 3.77 million units equaling $1.16 trillion in volume6. For Q3 2022, these same figures were 1.97 million units totaling $636.5 billion7. That is a 48% decline in units and a 45% drop in volume in a span of 18 months. While lenders could see the writing on the wall as units and volume began to decline starting in Q2 2021, the second and third quarters of 2022 are when that decline accelerated at a rate that was near impossible for lenders to keep pace.
As noted in last quarter’s report, the Federal Reserve’s efforts to combat inflation through increases in the Federal Funds Rate are among several factors influencing the mortgage interest rate environment. With all economic indicators pointing to persistent inflation, the Federal Reserve is unlikely to reverse course any time soon. Thus, the Fed’s activities will continue to impact mortgage interest rates for the foreseeable future. However, the hope is that borrowers will come to realize that the salad days of sub-2% interest rates are firmly in the past, and volumes will normalize. For those lenders still in the fight, focusing on loan quality to preserve every potential point of profitability will be the key to survival.
Conclusion
What a difference a quarter makes. In Q2, we counted ourselves lucky that the critical defect rate was not as high as it might have been, given the multitude of factors working against mortgage lenders. Q3 demonstrated just how much room there was for market conditions to worsen. In times like these, resiliency is critical, and for the lenders that survived the Great Recession, the current market is simply another test of their fortitude and ability to survive. As the saying goes, “Tough times don’t last. Tough people do.” If there was any mantra that the mortgage industry should rally behind now, this one seems especially apt. Those that have crafted a robust loan manufacturing process, built bench strength in their sales force and kept quality at the forefront of their operations should be well-placed to push through the current downturn and emerge successfully on the other side.
About the ACES Mortgage QC Industry Trends Report
The ACES Mortgage QC Industry Trends Report represents a nationwide post-closing quality control analysis using data and findings derived from mortgage lenders utilizing the ACES Analytics benchmarking software.
This report provides an in-depth analysis of residential mortgage critical defects as reported during post-closing quality control audits. Data presented comprises net critical defects and is categorized in accordance with the Fannie Mae loan defect taxonomy.
About ACES
ACES Quality Management is the leading provider of enterprise quality management and control software for the financial services industry. The nation’s most prominent lenders, servicers and financial institutions rely on ACES Quality Management & Control® Software to improve audit throughput and quality while controlling costs, including:
- 60% of the top 50 independent mortgage lenders;
- 8 of the top 10 loan servicers;
- 11 of the top 30 banks; and
- 2 of the top 3 credit unions in the United States.
Unlike other quality control platforms, only ACES delivers Flexible Audit Technology, which gives independent mortgage lenders and financial institutions the ability to easily manage and customize ACES to meet their business needs without having to rely on IT or other outside resources. Using a customer-centric approach, ACES clients get responsive support and access to our experts to maximize their investment.
For more information, visit www.acesquality.com or call 1-800-858-1598.
Media Contact: Lindsey Neal | DepthPR for ACES | (404) 549-9282 | lindsey@depthpr.com
View all reports