ACES’ Mortgage QC Industry Trends Report represents an analysis of nationwide quality control findings based on data derived from the ACES Quality Management & Control Software.
Executive Summary
QC Industry Trends – Overview
QC Industry Trends – by Category
QC Industry Trends – by Loan Purpose
QC Industry Trends – by Loan Product Type
Economic Discussion
Conclusion
About this Report
Executive Summary
This report represents an analysis of post-closing quality control (QC) data derived from loan files analyzed by the ACES Quality Management and Control® benchmarking system during the third quarter of 2023 (Q3 2023). The report incorporates data from prior quarters, where applicable.
Findings for the Q3 2023 Trends Report were based on quality control data from tens of thousands of unique records. Volumes are essential to this analysis, and the included records reflect trends in overall origination volumes. However, data from additional lenders is added to this analysis once the lender’s QC review seasoning within the ACES software reaches the 12-month bar. Therefore, the overall volume in the QC Trends Report does not precisely mirror the overall market. All reviews and defect data evaluated for this report were based on post-close loan audits selected by lenders for full file reviews.
Defects are categorized using the Fannie Mae loan defect taxonomy. Data analysis for any given quarter does not begin until 90 days after the end of the quarter to allow lenders to complete the post-closing quality control cycle, resulting in a delay between the end of the quarter and our publication of the data.
NOTE: A critical defect is defined as a defect that would result in the loan being uninsurable or ineligible for sale. The critical defect rate reflects the percentage of loans reviewed for which at least one critical defect was identified during the post-closing quality control review. All reported defects are net defects.
Summary of Findings
The overall critical defect rate continued its downward trajectory in Q3 2023, declining to 1.67%. Defects improved in three out of the four major underwriting categories. While purchase/refinance review and defect share held relatively steady this quarter, defect share increased slightly for FHA, VA and USDA loans.
Highlights include the following findings:
- The overall critical defect rate decreased by 2.91% to 1.67%, representing four consecutive quarters of decline.
- Defects in the Liabilities category increased for the third straight quarter, whereas Credit and Income/Employment defects decreased significantly.
- Despite its improvement over last quarter, Income/Employment continues to lead all defect categories, followed by Loan Documentation and Borrower and Mortgage Eligibility.
- Appraisal defects edged up slightly in Q3 after declining in Q2.
- Once again, purchase and refinance transactions achieved relative defect parity, thus firmly solidifying the market’s status as being purchase-driven.
- FHA and VA review share increased in Q3, while USDA and conventional reviews declined. However, defect share increased across all loan types except conventional.
QC Industry Trends – Overview
With an entire year’s worth of defect data trending downward, it is more than safe to say that lenders have gotten a better handle on loan quality after the alarming spike observed in Q3 2022. Though the hope is always that this is a result of proactive remediation efforts, we would be remiss in not acknowledging the corresponding decline in origination volume. One would expect that having fewer loans coming in would provide lenders the latitude to focus more on quality, thus driving down defects, but as we saw in several quarters in 2022, this scenario is not always a given.
Rate-wise, the average 30-year fixed interest rate entered the quarter at 6.81% and reached 7.31% by quarter’s end1. After the modest spike during the previous quarter, lenders experienced a 3% quarter-over-quarter decline in origination volume, a trend that has persisted across nine of the last 10 quarters2.
1 https://fred.stlouisfed.org/series/MORTGAGE30US
2 https://www.attomdata.com/news/market-trends/mortgage-origination/attom-q3-2023-u-s-residential-property-mortgage-origination-report/
Critical Defect Rate by Quarter: Q4 2022 — Q3 2023
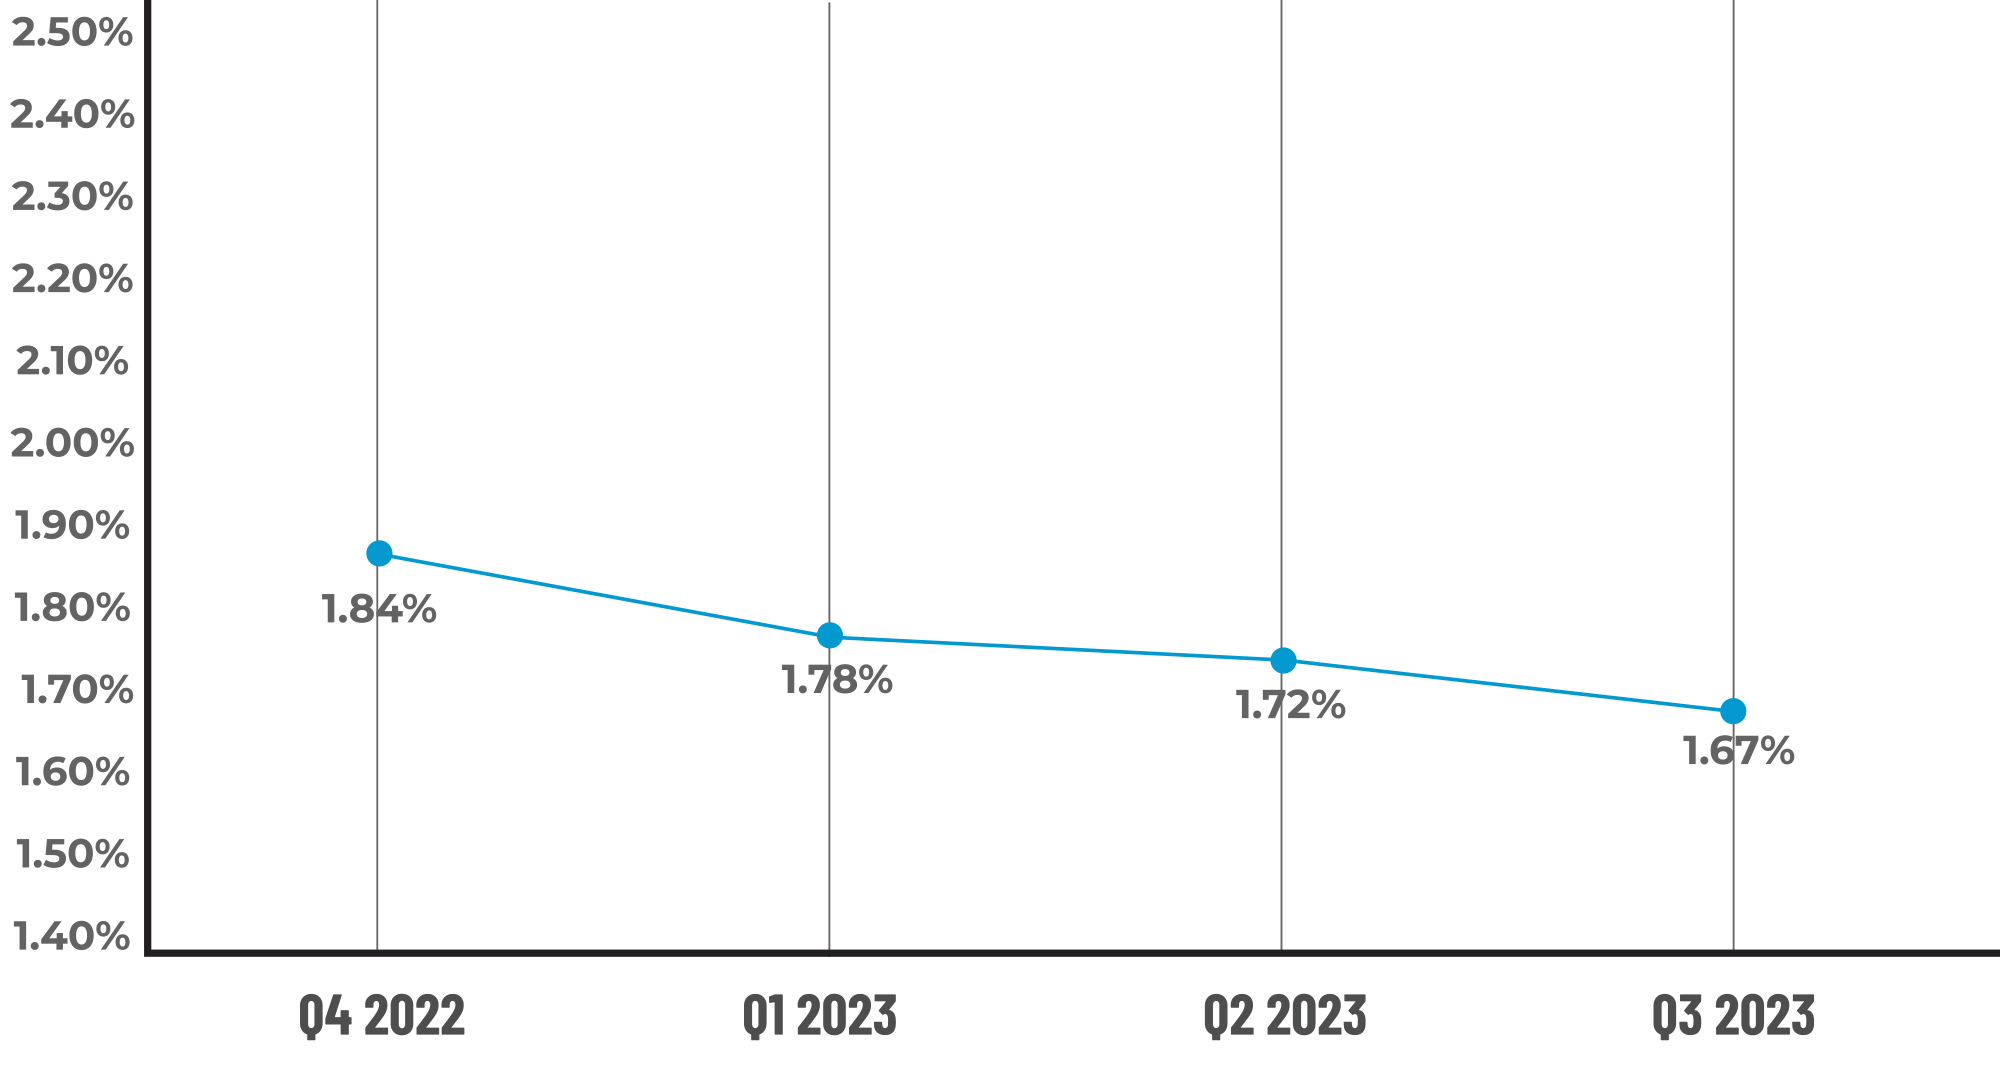
Figure 1 displays the percentage of loans with critical defects by quarter, for Q4 2022 through Q3 2023.
QC Trends by Defect Category
In Q3 2023, there are positive developments to report in the Income/Employment category. Although it remains the largest defect category, the overall share of defects declined from 31.25% to 23.40%. More importantly, the issues within the category were where one would expect them to be, which is in the income calculation subcategory. In prior quarters, issues relating to Income Documentation were far too high and signified gaps in underwriting processes that led to insufficient or expired documentation. This quarter, Income Documentation issues fell to just 27% (from 47% the previous quarter) of the overall category, with the Income Calculation making up 55%. Amidst the backdrop of fighting for every loan, one would expect the Calculation subcategory to make up the majority of defects in the Income/Employment category – with many harder-to-qualify borrowers going through the process (self-employed, gig economy income, rental income, tax return qualification, etc.).
In the remaining vital categories (Assets, Credit, and Liabilities), defect performance improved quarter-over-quarter in the Assets category (15.6% this quarter vs. 15.97% last quarter) and Credit category (6.38% vs. 11.81%). The only critical underwriting category that saw an increase in defect share was the Liabilities category, which rose to an 11.35% share from 8.33% in the prior quarter. Overall improvement in these categories is always a welcome sight as it provides a more positive view of borrower health and lender adherence to underwriting guidelines. These categories are also key focus areas for the GSEs and investors as they perform their own due diligence when purchasing or guaranteeing loans.
Two areas that saw a substantial rise in defect share in Q3 2023 were Loan Documentation and Borrower and Mortgage Eligibility. Loan Documentation share tends to have wider swings quarter-over-quarter, but this quarter, the swing was more pronounced, as the share increased from 12.50% to 19.15%. The share puts the Loan Documentation category within striking distance of Income/Employment as the leading category. The share of defects for Borrower and Mortgage Eligibility also increased from 9.72% in Q2 to 16.31% this quarter.
Given the unusual nature of these increases, this quarter’s report includes a deeper dive into the subcategories of these two areas. The data shows that final/closing documentation deficiencies drove the increase in the Loan Documentation category, followed closely behind by upfront document collection in the Application Processing subcategory. These types of defects are often attributed to sloppiness in the manufacturing process. However, they are still classified as “critical’ defects,” and their importance is nothing to minimize.
Regarding the subcategories driving the defect share in the Borrower and Mortgage Eligibility category, General Eligibility accounted for 52% of the defects. This subcategory is for cash-out requirements not being met, property listed for sale on a refinance, excessive DTI ratio and deficiencies in general requirements for various other loan types. As more and more loans that are harder to qualify enter a lender’s pipeline, it is imperative that underwriting account for nuances associated with a borrower’s specific situation and chosen loan type.
Critical Defects by Fannie Mae Category: Q3 2023
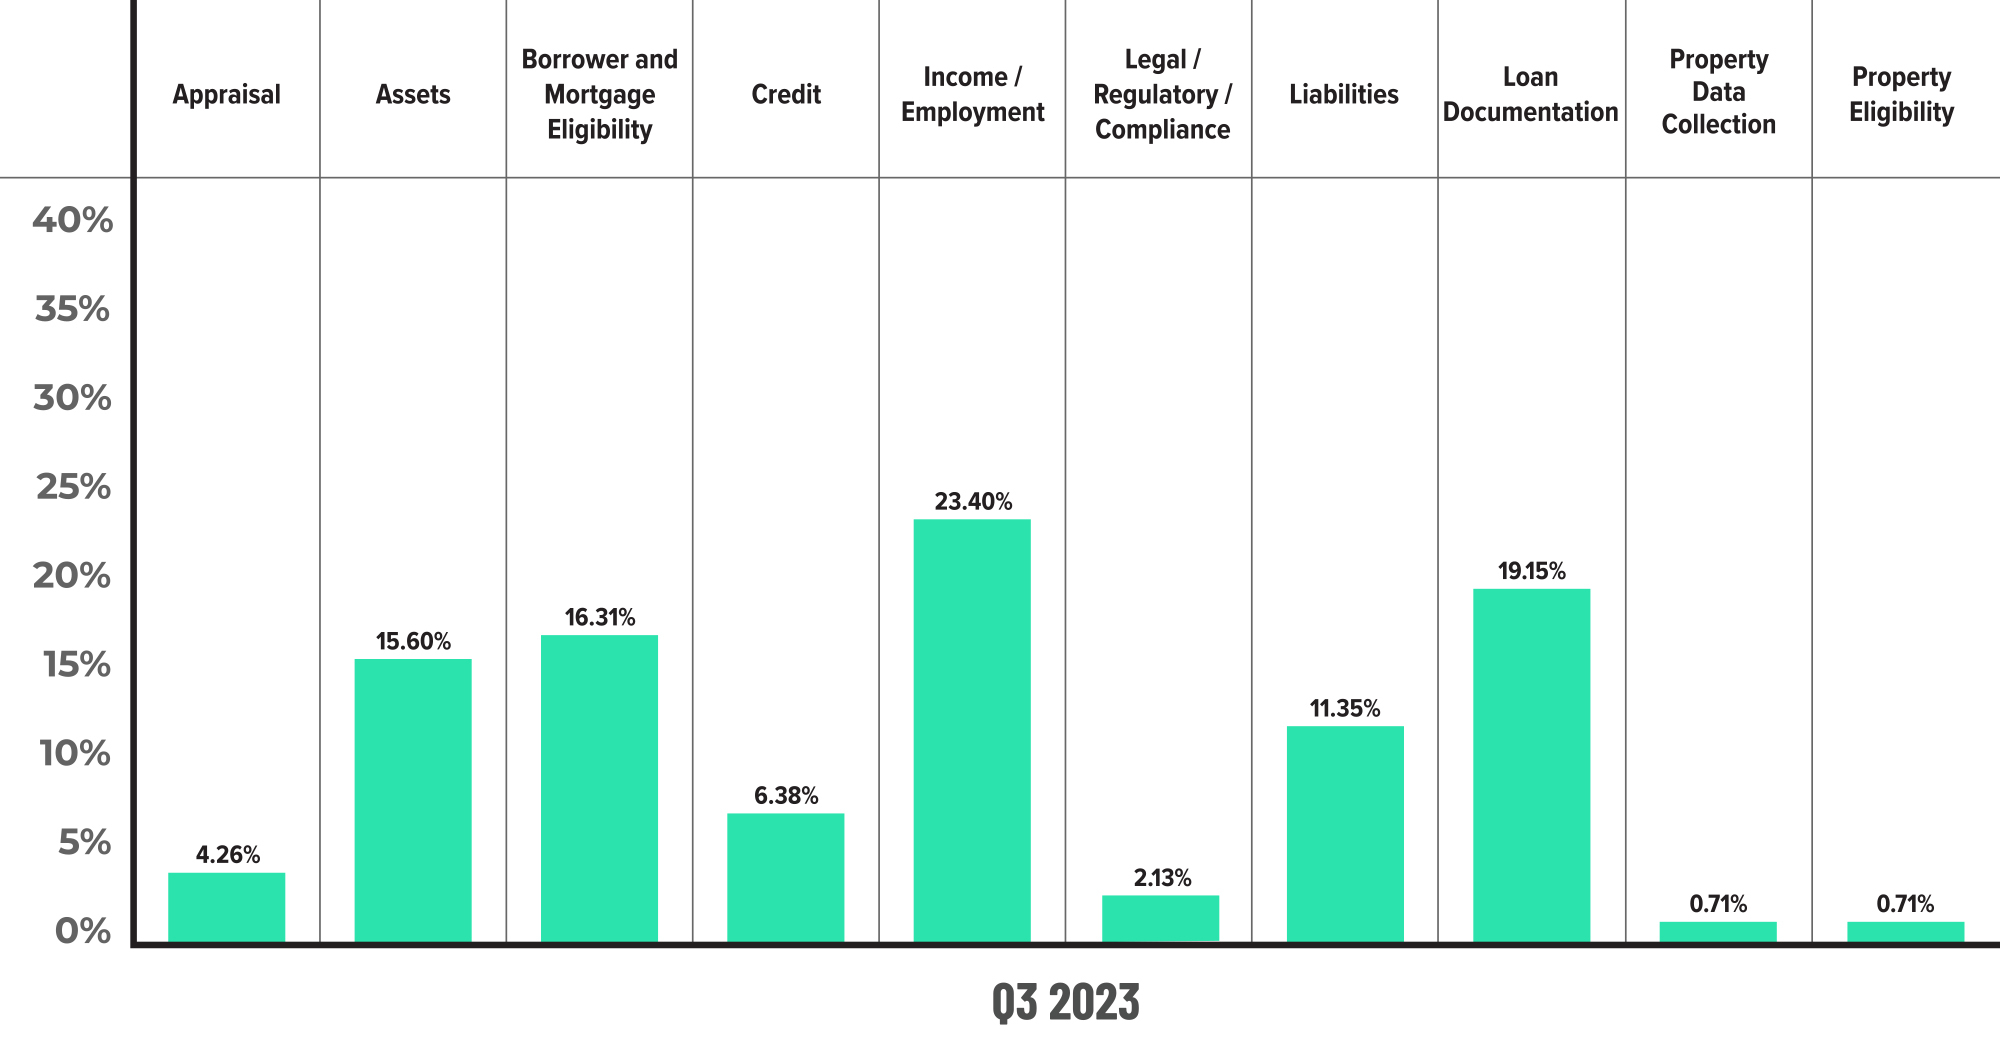
Figure 2 displays the dispersion of critical defects across Fannie Mae categories for Q3 2023. Please note that totals shown may not add up to 100%, as categories with negligible defects have been omitted.
Critical Defects by Fannie Mae Category: Q2 2023 vs. Q3 2023
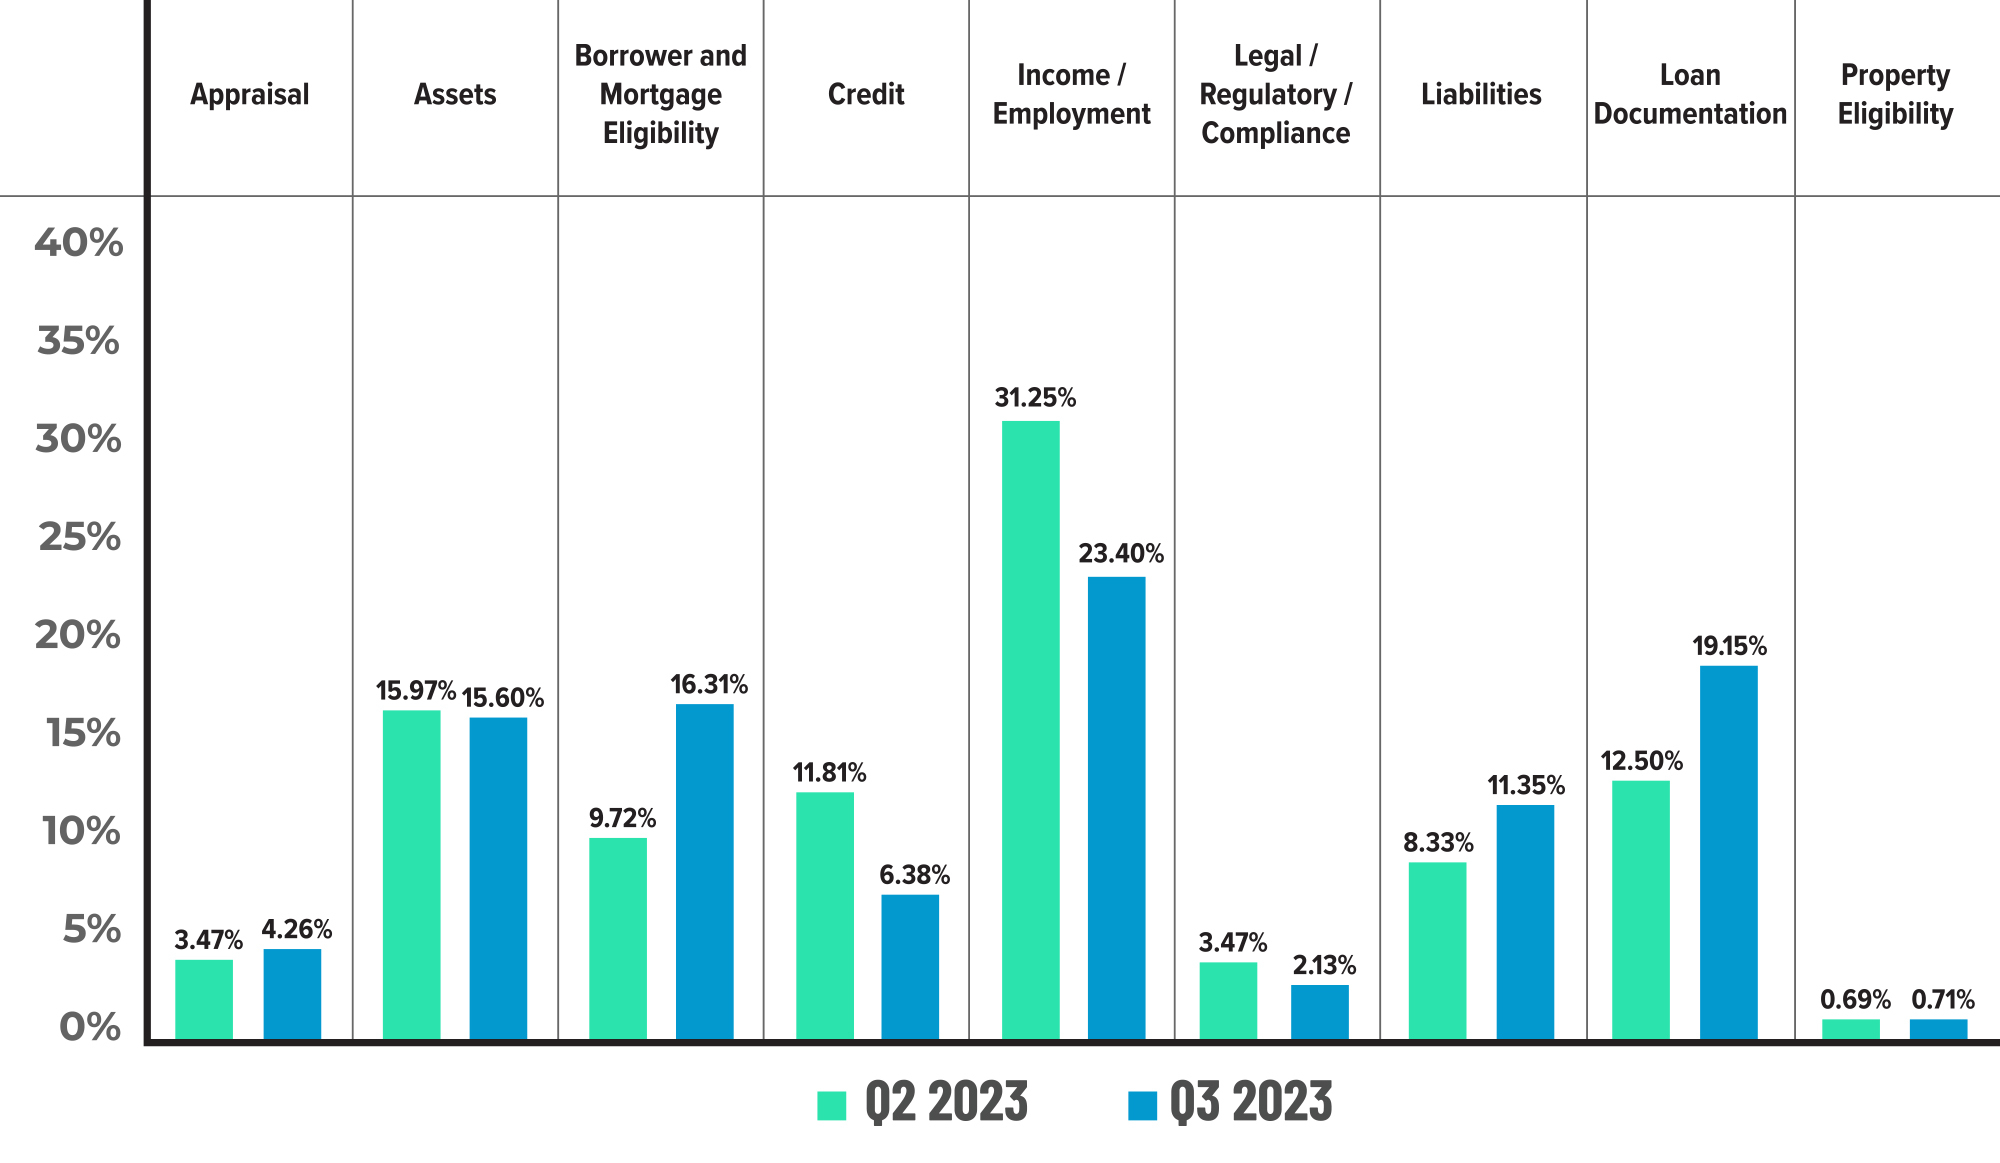
Figure 3 displays the critical defect rate by Fannie Mae category, comparing Q2 2022 to Q3 2023.
Critical Defects by Fannie Mae Underwriting Subcategory: Q3 2023
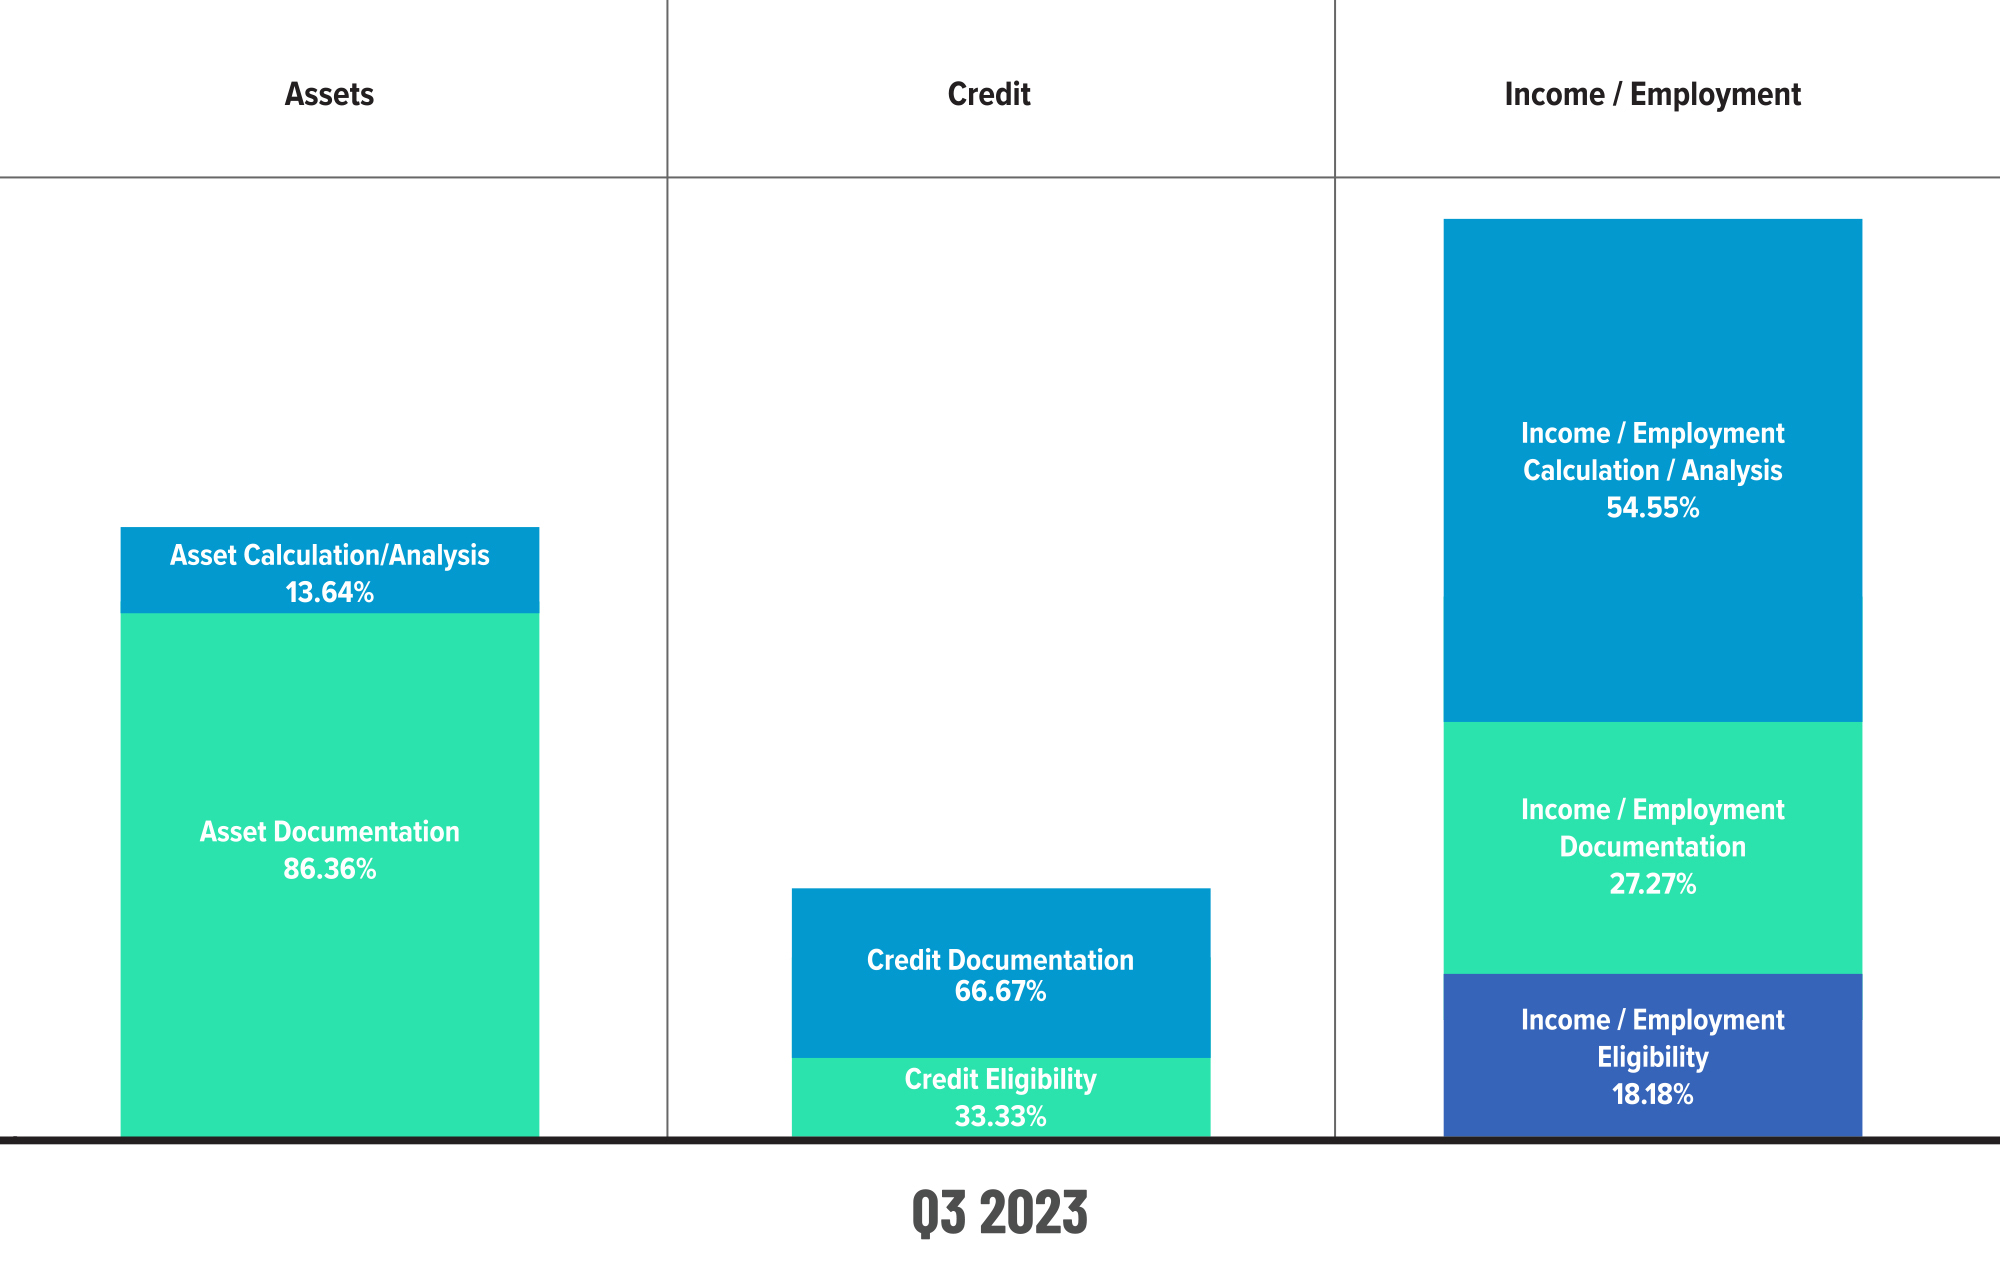
Figure 4 displays subcategory information for Q3 2023 within the Assets, Credit and Income / Employment categories.
Critical Defects by Fannie Mae Underwriting Subcategory: Q2 2023 vs. Q3 2023
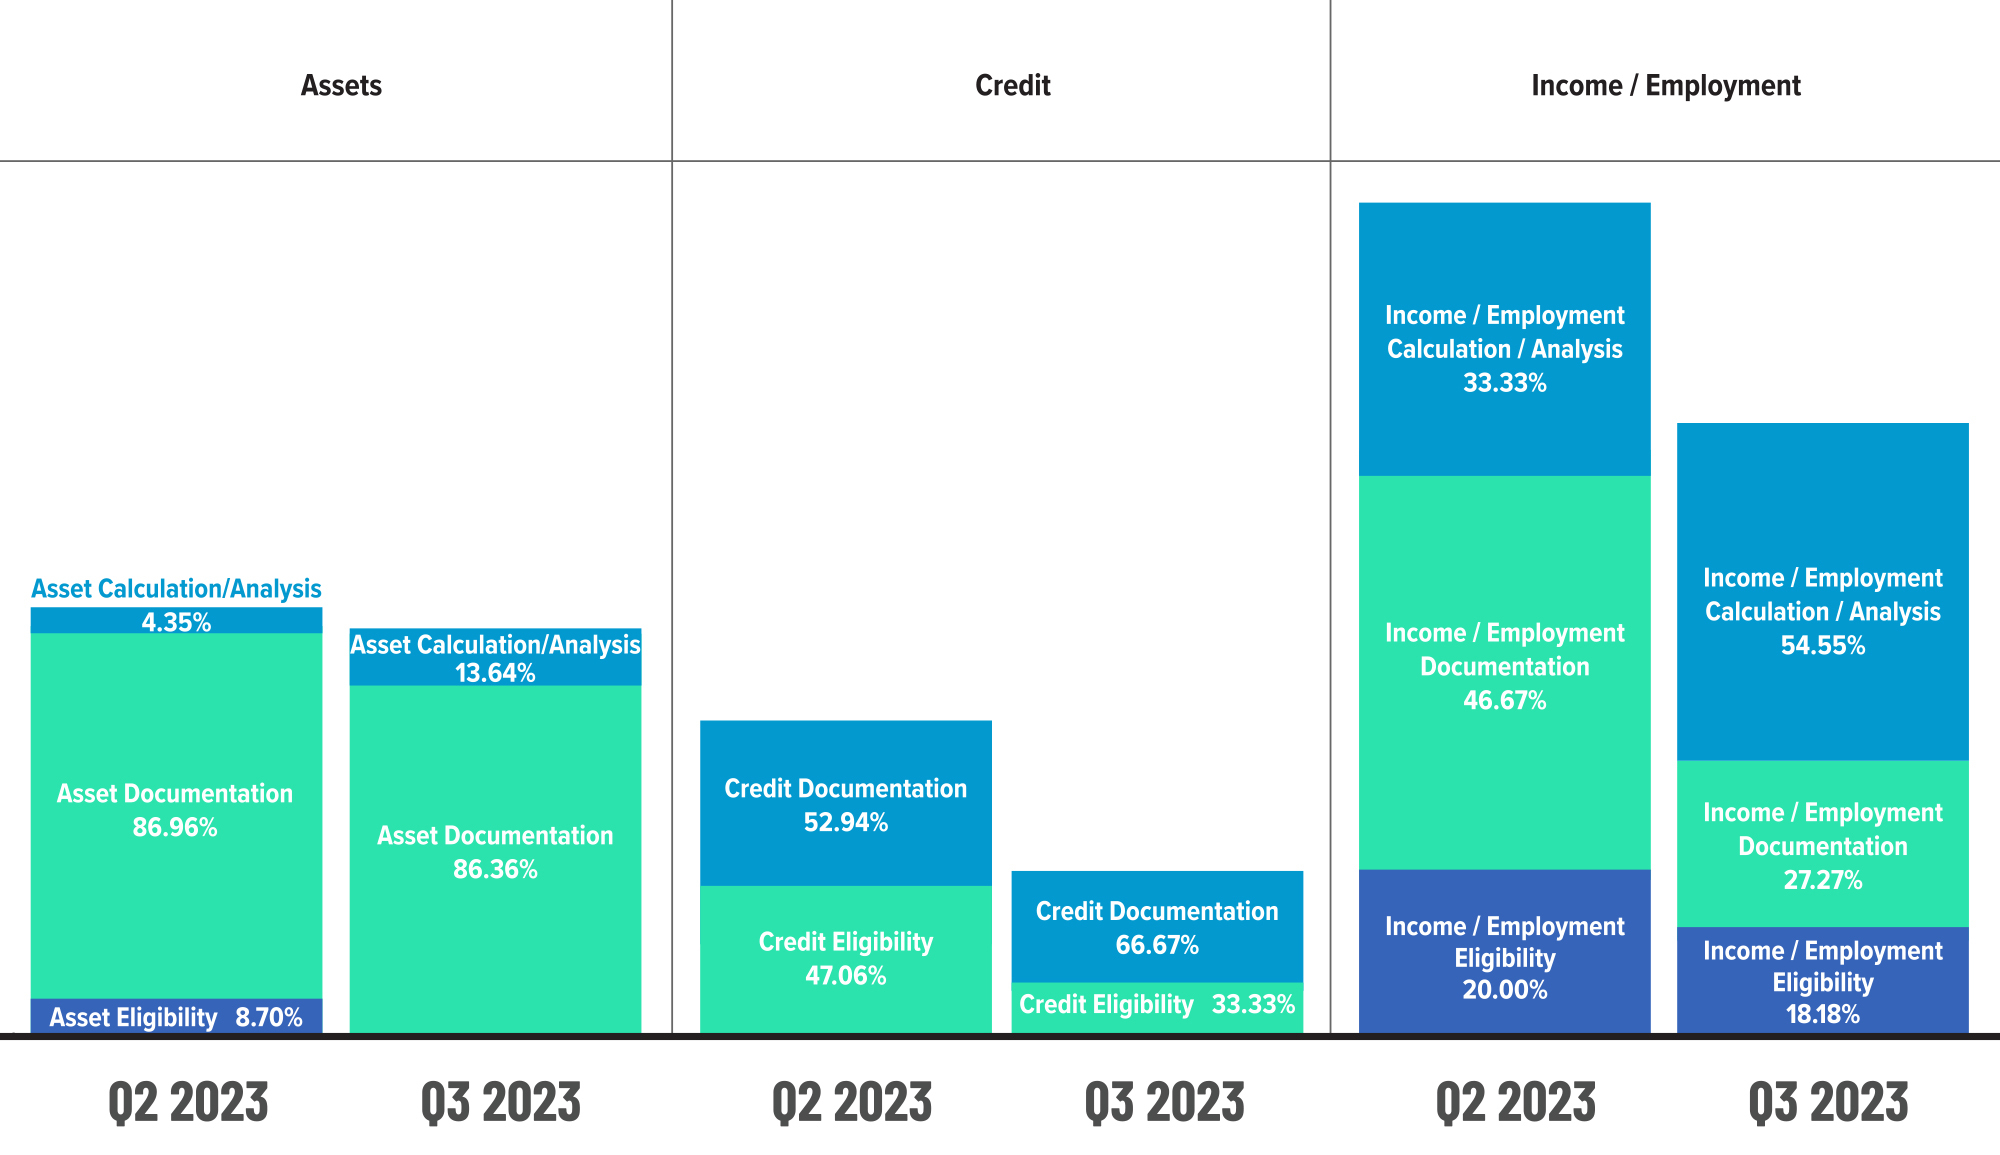
Figure 5 displays subcategory information within the Assets, Credit and Income/Employment categories, comparing Q2 2023 to Q3 2023.
Critical Defects by Fannie Mae Subcategory: Q2 2023 vs. Q3 2023
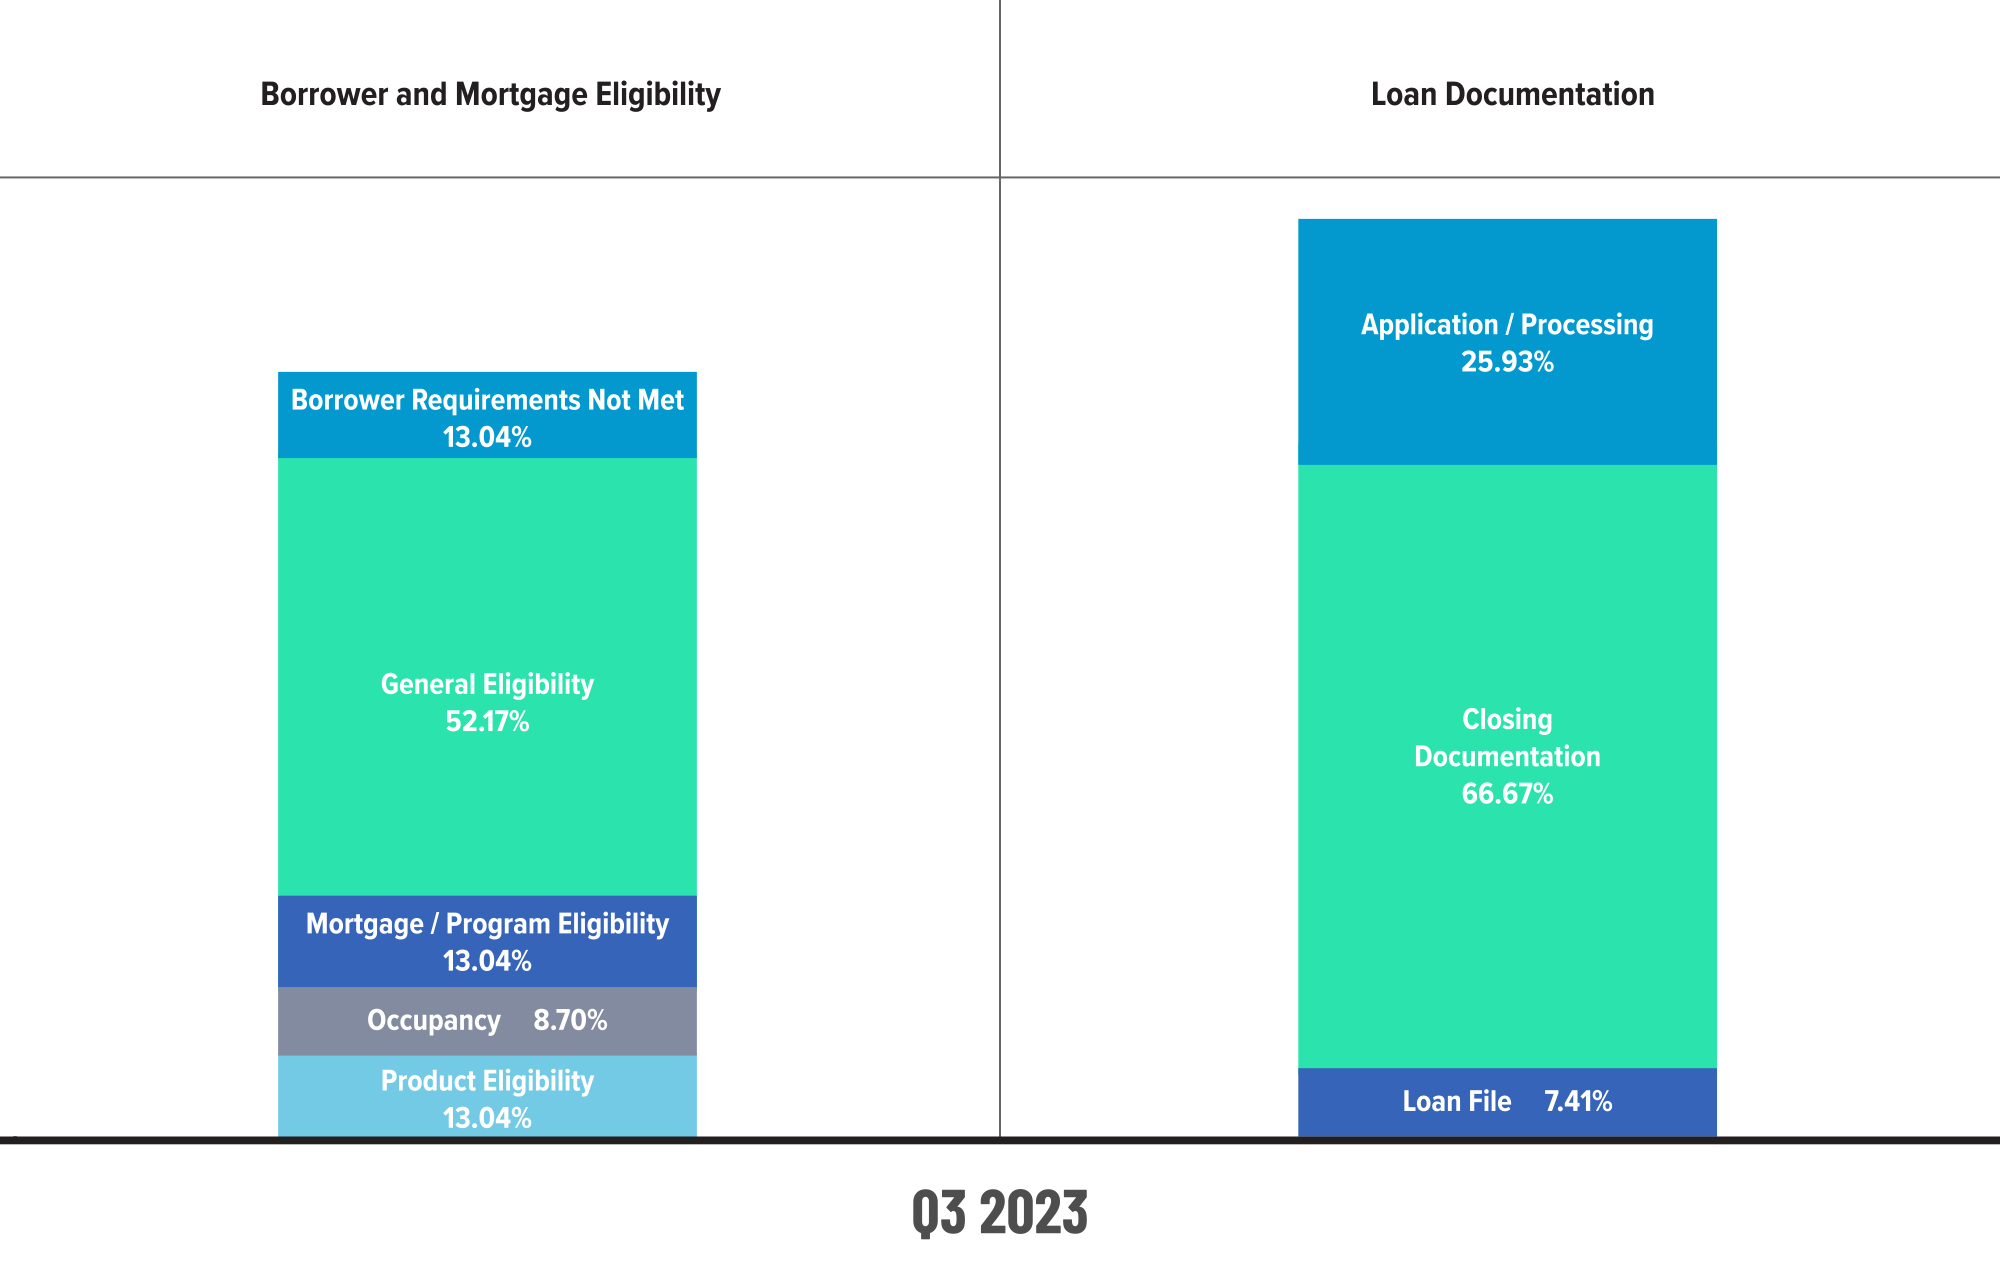
Figure 6 displays subcategory information for Q3 2023 within the Borrower and Mortgage Eligibility and Loan Documentation categories.
QC Trends by Loan Purpose
While Groundhog Day (the holiday) only occurs once a year on February 2, this quarter’s findings regarding loan purpose are reminiscent of the 1993 rom-com starring Bill Murray, as history has repeated itself in Q3. Given the current rate environment, it’s unsurprising that refinance review share declined by 9.71% from Q2 to just 13.2% of all loans reviewed. Subsequently, refinance defect share also decreased by 7.45% to 14.78% overall.
On the other hand, purchase review share increased by only 1.66% to 86.8%, which was likely the cause of the 1.42% increase in purchase defects observed during the quarter. Given the small margin between review and defect share, it is still fair to say that both transaction types achieved relative defect parity for the fourth quarter in a row.
Defects by Loan Purpose: Q3 2023
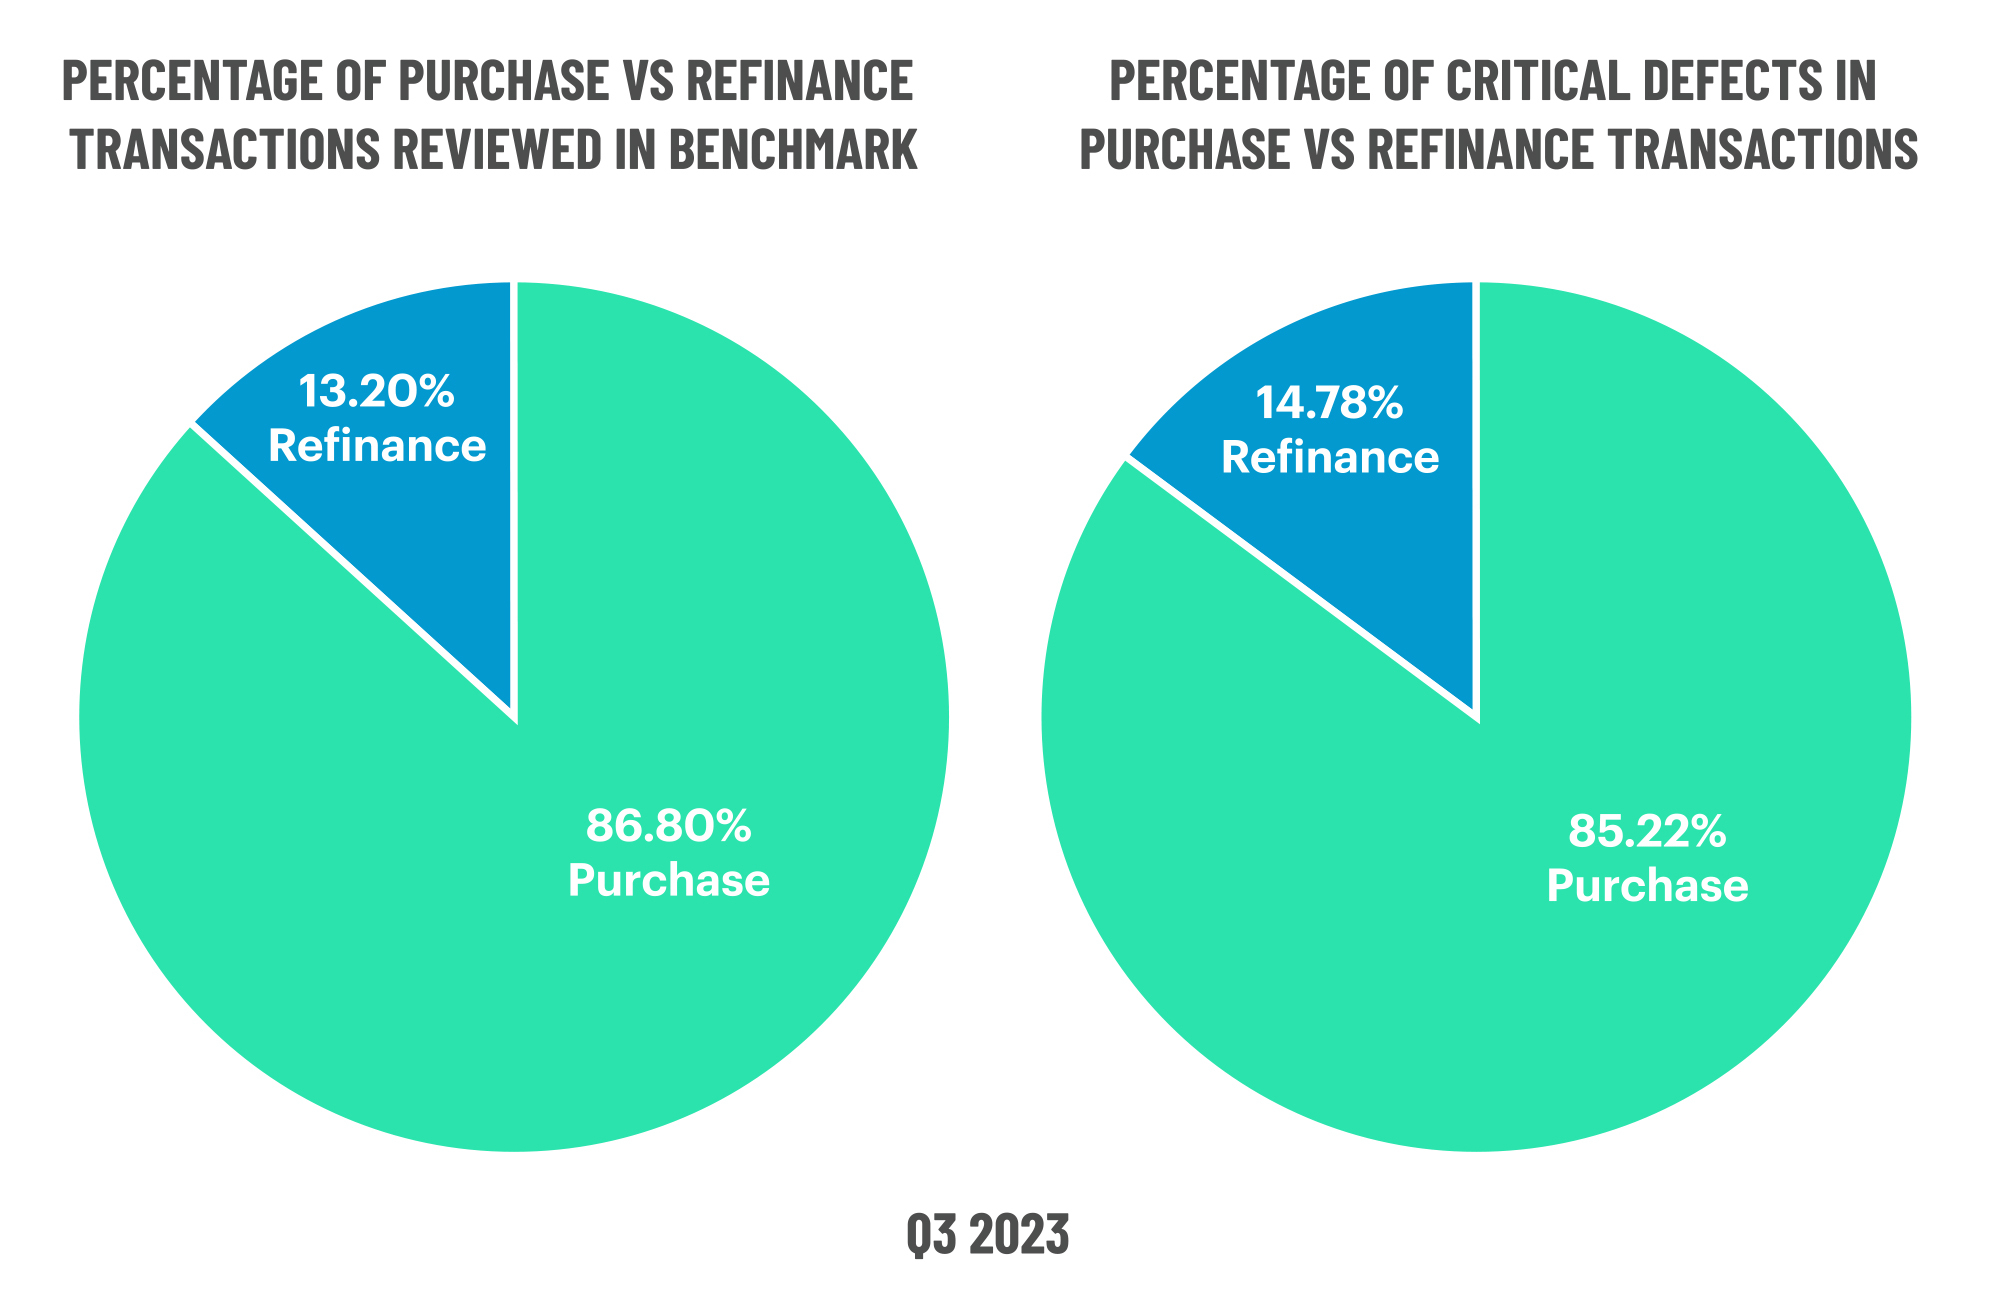
Figure 7 displays the loans reviewed and critical defects by loan purpose for Q3 2023.
QC Trends by Loan Product Type
Once again, lenders focused their review efforts on FHA and VA loan production in Q3, with review share increasing by 10.29% and 13.94%, respectively. When review share increases, one naturally expects defect share to follow suit, which is the case in Q3. However, defect share increases for both loan types were modest – 3.47% for FHA and 3.57% for VA – which is a good sign that lenders are making every effort to improve loan quality for two of the more challenging and, thus, error-prone loan types.
With the increase in reviews for FHA and VA, lenders opted to decrease their reviews for conventional and USDA loans in Q3, which declined by 5.81% and 13.11%, respectively. While conventional defect share also declined by 3.41%, the same does not hold true for USDA loans. Defect share in the USDA loan category increased by 3.57% this quarter, reversing a multi-quarter trend of decline.
Defects by Loan Product Type: Q3 2023
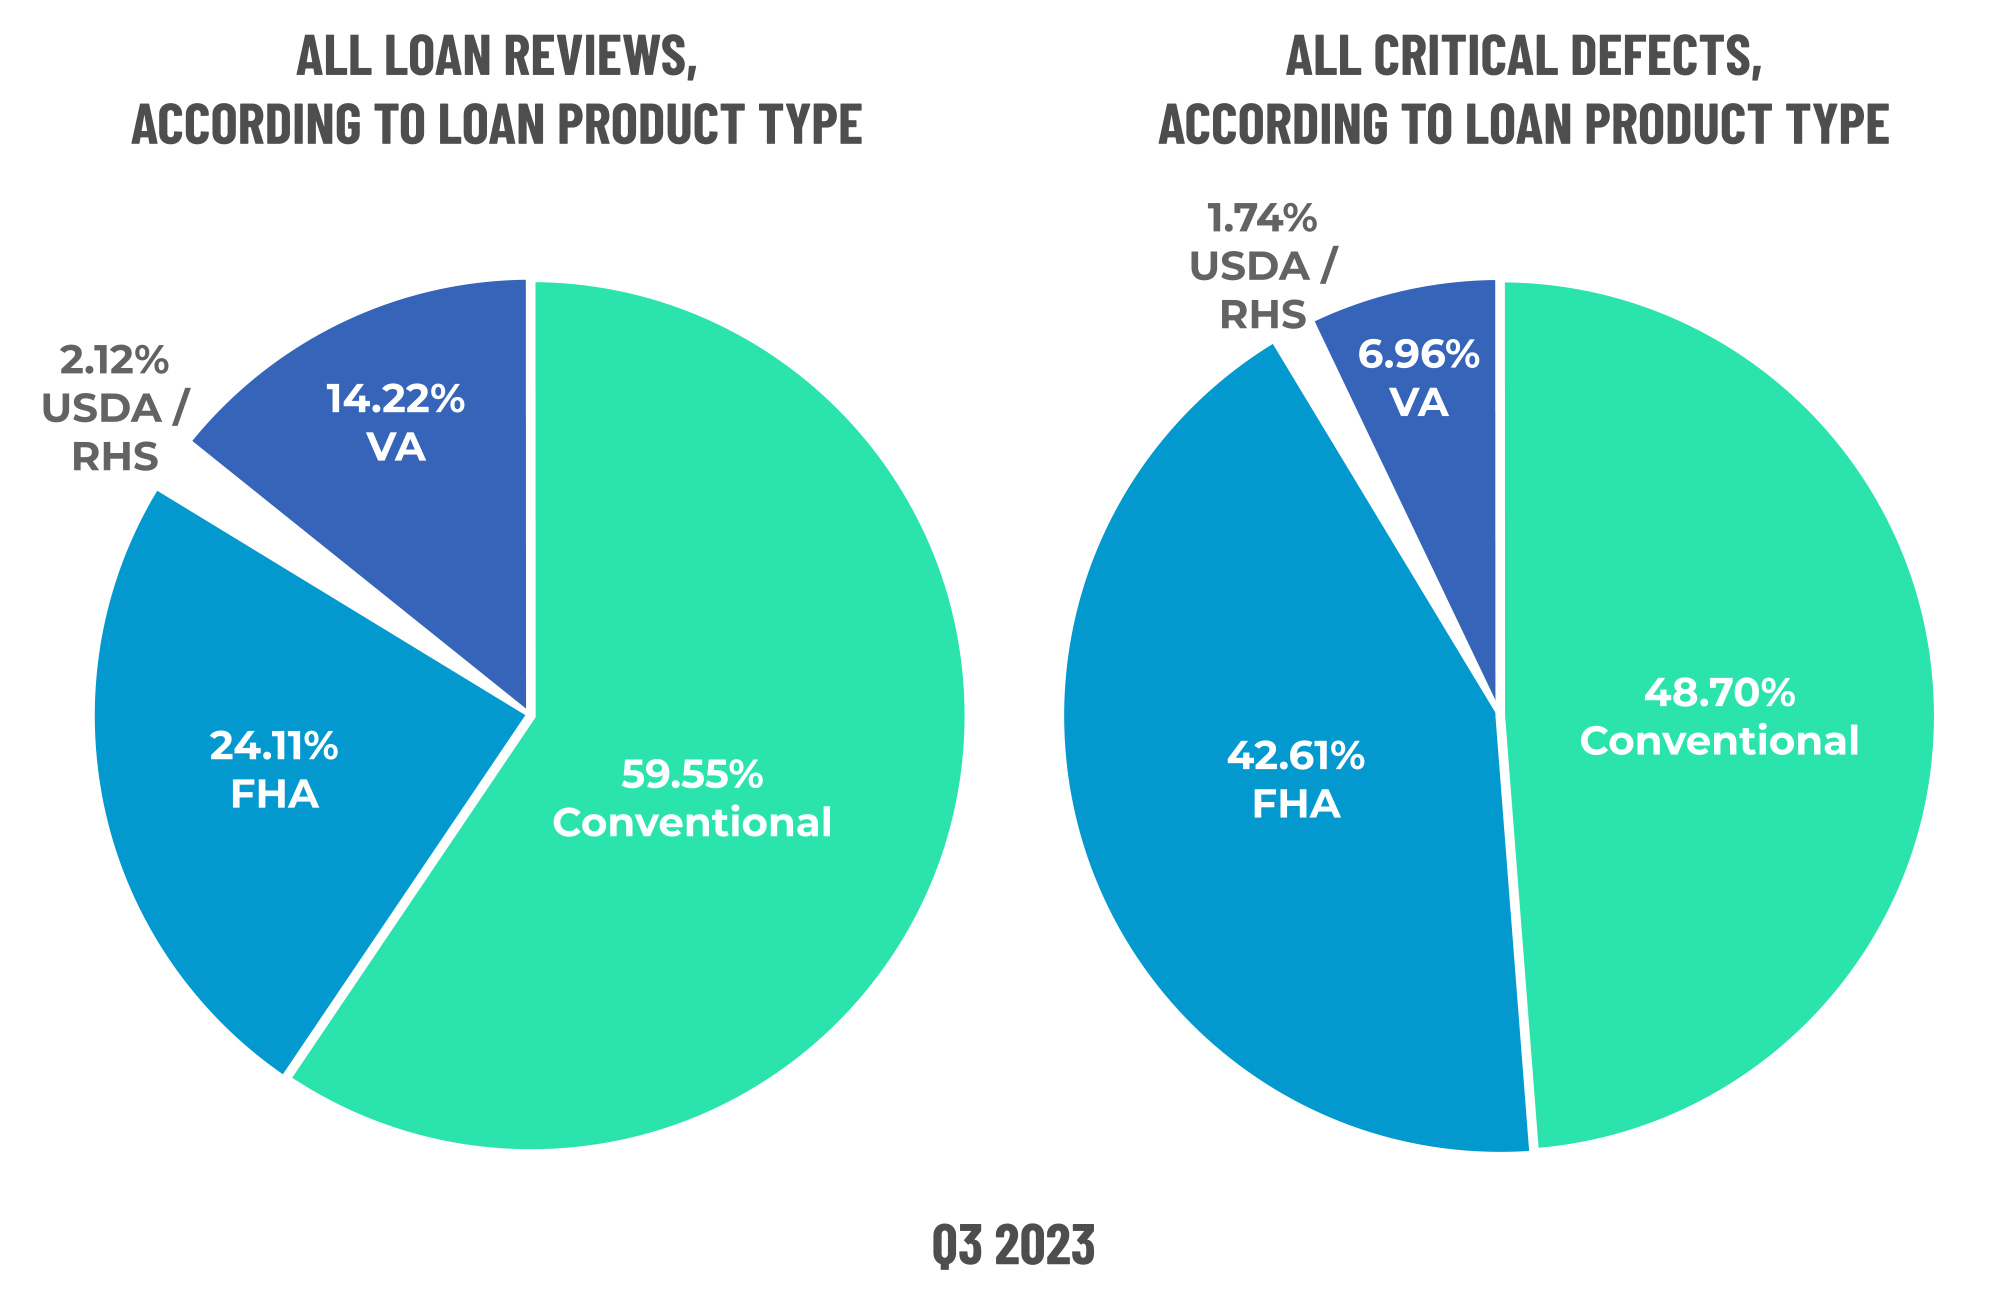
Figure 8 displays the loans reviewed and critical defects by loan type for Q3 2023.
Economic Discussion
In the mortgage market, interest rates tend to be the center of gravity for everything else. While the 7% quarter-over-quarter rise was not a welcome development for lenders, perhaps more shocking was that the industry has experienced a 21% year-over-year increase. Prior to the increases this quarter, the average rate has not been above 7% since November 2022. Similarly, lending volumes have decreased 26% from Q3 2022, thus emphasizing just how far the industry has fallen.
It’s worth noting the Federal Reserve’s Open Market Committee (FOMC) increased the benchmark rate to a level of 5.25%-5.5% in July. That was the last increase in this most recent cycle, and the benchmark rate remains the same today. Interest rates for many lending products, including mortgages, have begun to move up or down based on the ever-changing opinions and speculation of when the FOMC will begin to lower rates. In speculating what the FOMC will do and when, market watchers are paying particular attention to the rate of inflation. After hitting a post-pandemic high of 8.5% in 2022, inflation cooled in 2023 to a 3.4% annualized rate. This level is near the FOMC’s stated 3% goal, but thus far, the fear of reigniting inflation has superseded the FOMC’s desire to begin lowering rates.
A strong housing market is providing a tailwind to purchase lending, as evidenced by the review share for purchases in this report. Elsewhere, volumes appear to be strong in home equity lending, and lenders are finding volume where they can. As of this publication, the average 30-year interest rate is below 7%, and the industry appears to have settled into a new normal unless/until the FOMC moves to lower interest rates. Given the positive signs in the critical defect rate, lenders remain focused on quality, avoiding repurchase, and fighting for profitability. There is some sentiment that the worst is behind us.
Conclusion
We were delighted that the critical defect continued to decline in this quarter. The fact that market participants have a keen eye on loan quality is a very positive sign overall. In this environment, repurchase costs can be devastating. In the coming quarters, lenders will have to adapt to fairly significant changes in quality control requirements driven by Fannie Mae. These changes continue to put a spotlight on loan quality. Our hope is that loan quality continues to be strong.
About the ACES Mortgage QC Industry Trends Report
The ACES Mortgage QC Industry Trends Report represents a nationwide post-closing quality control analysis using data and findings derived from mortgage lenders utilizing the ACES Analytics benchmarking software.
This report provides an in-depth analysis of residential mortgage critical defects as reported during post-closing quality control audits. Data presented comprises net critical defects and is categorized in accordance with the Fannie Mae loan defect taxonomy.
About ACES
ACES Quality Management is the leading provider of enterprise quality management and control software for the financial services industry. The nation’s most prominent lenders, servicers and financial institutions rely on ACES Quality Management & Control® Software to improve audit throughput and quality while controlling costs, including:
- 4 of the top 5 and more than 60% of the top 50 independent mortgage lenders;
- 8 of the top 10 loan servicers;
- 11 of the top 30 banks; and
- 3 of the top 5 credit unions in the USA.
Unlike other quality control platforms, only ACES delivers Flexible Audit Technology, which gives independent mortgage lenders and financial institutions the ability to easily manage and customize ACES to meet their business needs without having to rely on IT or other outside resources. Using a customer-centric approach, ACES clients get responsive support and access to our experts to maximize their investment.
For more information, visit www.acesquality.com or call 1-800-858-1598.
Media Contact: Lindsey Neal | DepthPR for ACES | (404) 549-9282 | lindsey@depthpr.com
View all reports