ARMCO’s Mortgage QC Industry Trends Report represents an analysis of nationwide quality control findings based on data derived from the ACES Analytics benchmarking software.
Executive Summary
QC Industry Trends – Overview
QC Industry Trends – by Category
QC Industry Trends – by Loan Purpose
QC Industry Trends – by Loan Type
Conclusion
About this Report
Executive Summary
This report represents an analysis of post-closing quality control data derived from loan files analyzed by the ACES Analytics benchmarking system during the fourth quarter of 2019 (Q4 2019) along with calendar year (CY) data for 2018 and 2019.
Findings for the Q4 2019 Trends Report were based on post-closing quality control data from over 90,000 unique loans. All reviews and defect data that were evaluated for this report were based on loan audits selected by lenders for full file reviews.
Defects are categorized using the Fannie Mae loan defect taxonomy. Data analysis for any given quarter does not begin until 90 days after the end of the quarter to allow lenders to complete the post-closing quality control cycle, resulting in a delay between the end of the quarter and publication of the data.
NOTE: A critical defect is defined as a defect that would result in the loan being uninsurable or ineligible for sale. The critical defect rate reflects the percentage of loans reviewed for which at least one critical defect was identified during the post-closing quality control review and all reported defects are net defects.
Summary of Findings
Mortgage loan manufacturing produced modestly lower critical defect rates in CY 2019 when compared to 2018, with the overall critical defect rate declining 0.11%. The final critical defect rate for 2019 was 1.70%, compared to 1.81% in 2018.
Report highlights include the following findings:
- On a quarter-over-quarter basis, critical defect rates improved in the first three quarters of 2019 before reversing the decline and climbing in Q4 2019.
- Q4 2019 ended with a defect rate of 1.73%, an increase of 11% from Q3 2019.The % of Government loans reviewed in Q3 fell as the interest rate environment drove more conventional refinances.
- The share of conventional loans increased from 56.40% in CY 2018 to 61.99%, representing a nearly 6% increase.
- Purchase share fell 7.5% in CY 2019 as compared to CY 2018.
- Regulatory compliance issues were down 51% year-over-year, to a multi-year low of 5.17% of all critical defects.
- Loan Package/Documentation defects were volatile in CY 2019 but did post a 12% improvement compared with CY 2018.
- Income, Assets, and Credit (key qualification/underwriting criteria) related defects made up 53% of all critical defects in CY 2019, with Income and Credit increasing from the prior year, and Asset defects decreasing.
- Market stability contributed to an overall better 2019 for lending quality. However, these improvements will be severely tested as data comes in for the coming quarters as we start to see COVID’s impact on mortgage lending.
QC Industry Trends – Overview
Based on the overall critical defect rate, mortgage lenders originated quality loans in 2019. Critical defect rates for CY 2019 were 1.70%, a 6.1% improvement from CY 2018’s 1.81%. The data shows that the year-over-year improvement was driven by a shift in both product mix (higher percentage of conventional loans) and loan purpose, where refinance share increased.
Moving from yearly to quarterly data trends, Q4 2019’s critical defect rate of 1.73% is 11% higher than Q3 2019’s rate of 1.56%. The year-over-year data for this quarter does show improvement, however, from the same period in 2018 with a 10% decrease from Q4 2018’s defect rate of 1.93%. Although the rate in a single quarter is an important data point to consider, trend lines are a far more meaningful indicator of loan quality, and Q4 2019’s rate is on average with the prior eight quarters. With the lending environment, particularly interest rates, improving into 2020, it is likely that this level is sustainable and could possibly fall lower in subsequent quarters.
2019’s critical defect rates represented a clear improvement over 2018. Factors driving this year- over-year improvement in loan quality include:
- Reduced interest rate volatility and a steady decline in interest rates throughout 20191;
- Strong lending profitability driven by declining interest rates and increased loan production2; and
- A sustained spike in refinances due to declining interest rates.
Critical Defect Rate by Year: CY 2018 vs CY 2019
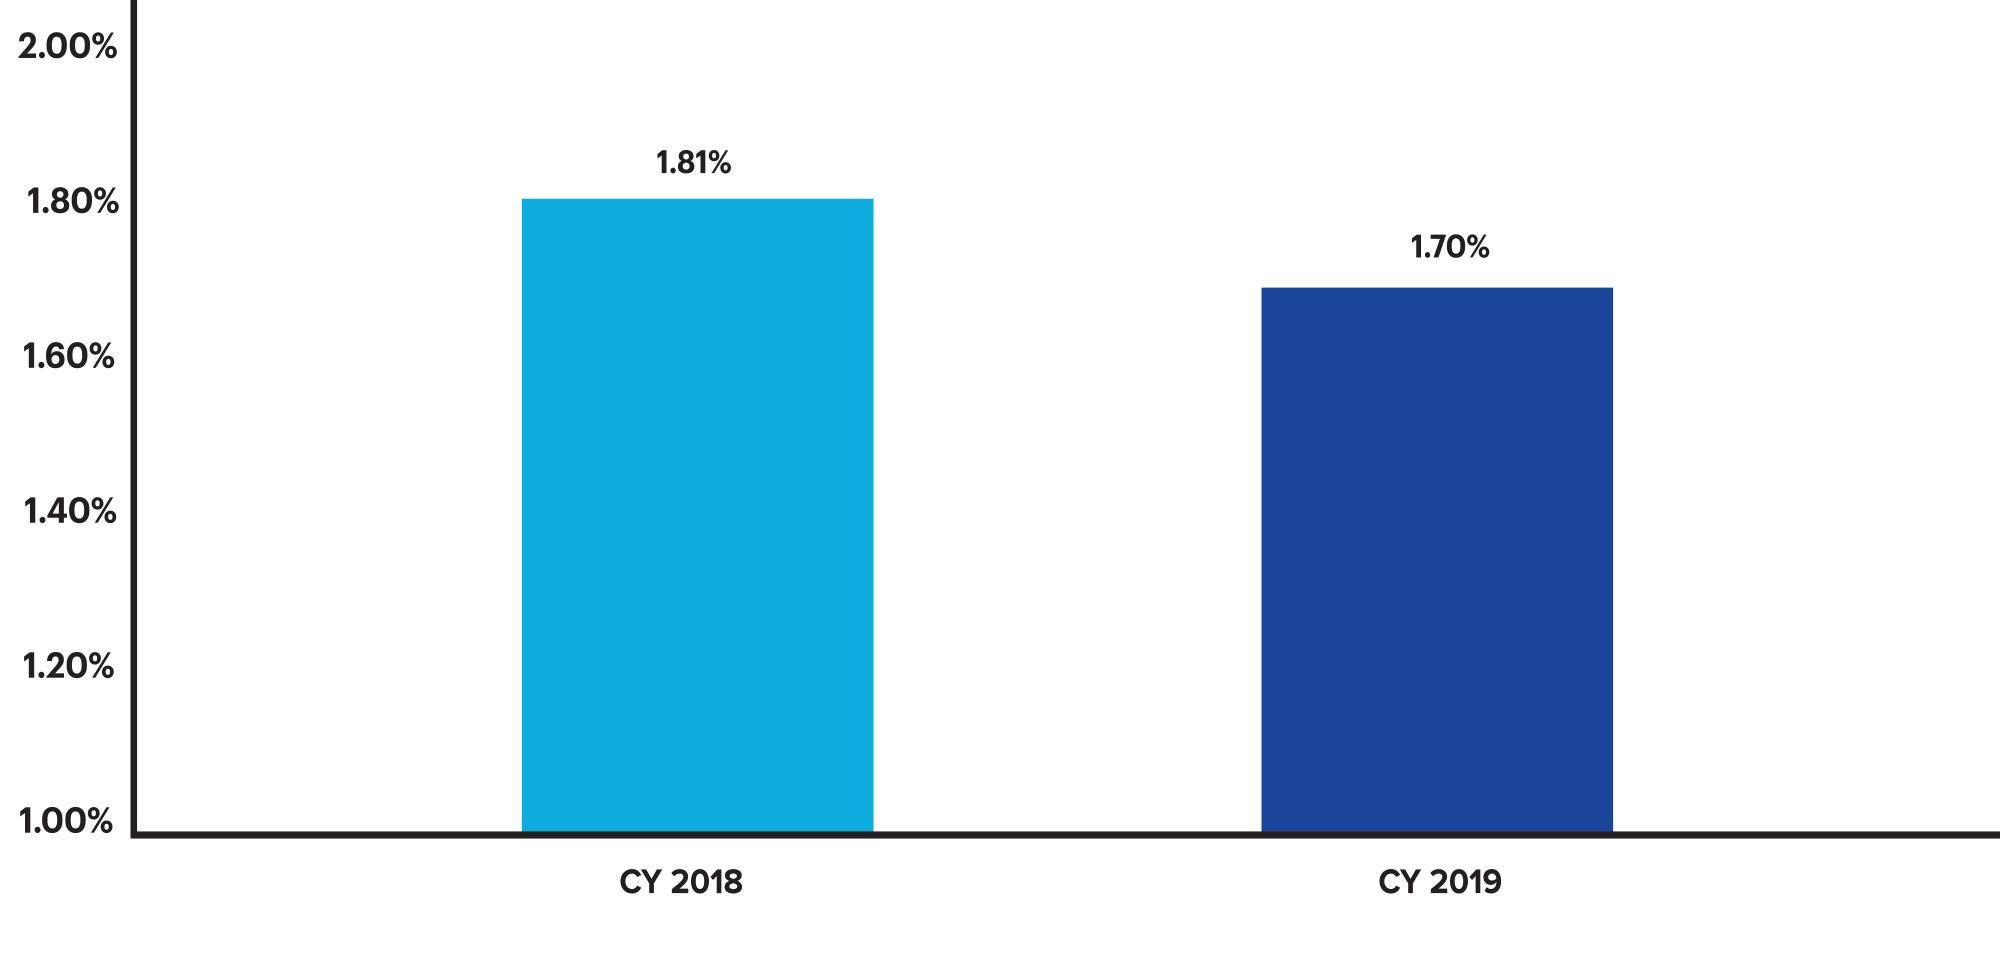
Figure 1 displays critical defect rates for CY 2018 vs. CY 2019.
Critical Defect Rate by Quarter: Q1 2019 - Q4 2019
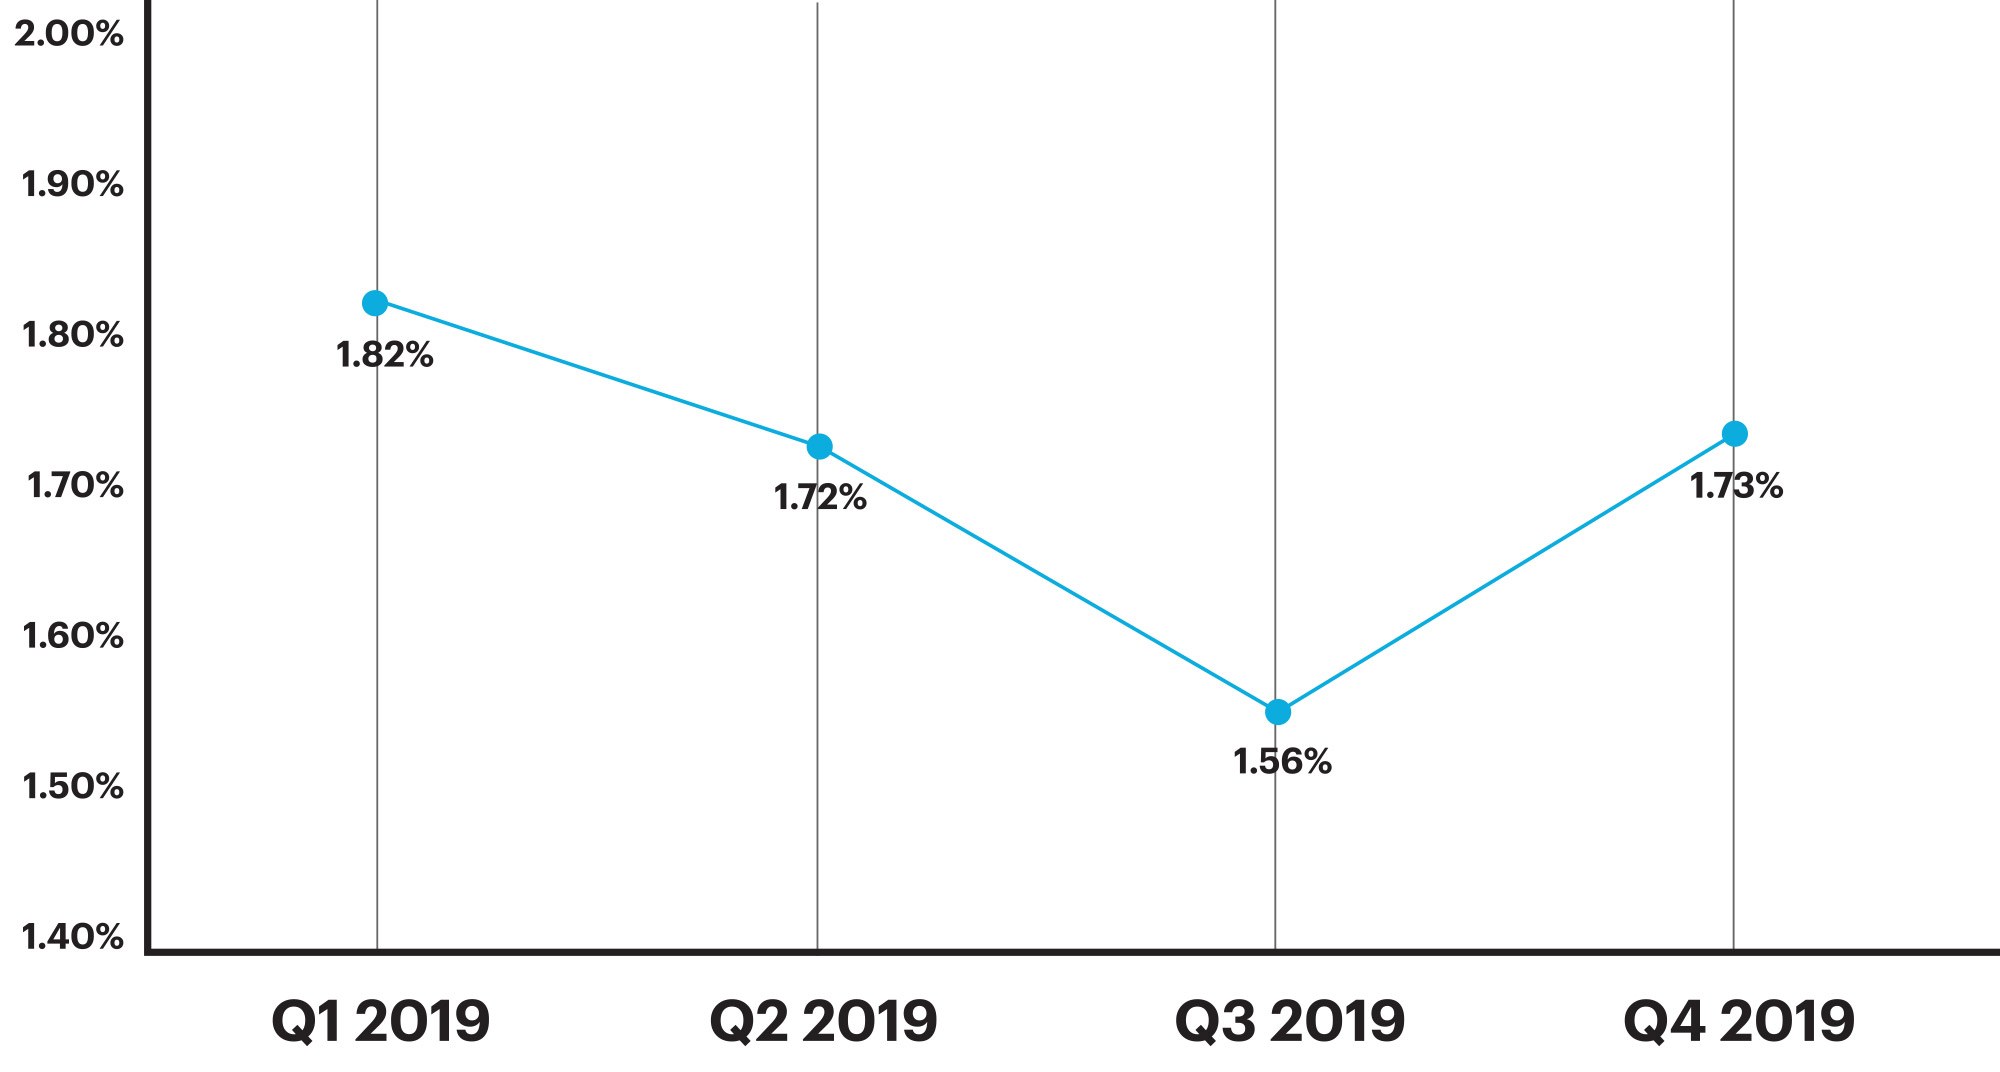
Figure 2 displays the percentage of loans with critical defects by quarter, Q1 2019 through Q4 2019.
QC Industry Trends by Defect Category
Critical defects are categorized broadly into 10 areas. Of those 10 areas, ARMCO monitors four particularly closely because of their importance to borrower health – they are less about the manufacturing process and very much tied to key underwriting and qualification areas. Those four defect categories are: Assets, Credit, Income and Liabilities. In times of disruption, such as big regulatory changes or large volatility in volume, it is worth investigation whether that disruption has affected the manufacturing process or led to problems with the qualification abilities of borrowers.
In Q4 2019, the defect rate increased due to corresponding increases in these four key qualification areas. The four areas combined made up 59% of the overall critical defects, an increase of 7% from the prior quarter. Looking more broadly at the year-over-year change, these four areas made up 57% of all defects for CY 2019 as compared to 53% from CY 2018.
Defects related to Credit experienced the highest increase, comprising 22.49% of all critical defects in Q4 2019, up 54% from Q3’s rate of 14.57%. Income related defects were 33% higher in Q4 than in Q3 2019 (27.22% vs. 20.53%). In the Credit category, the two largest defect sub-categories (specific areas related to the defect) were credit documentation and credit eligibility, with the latter making up 68.42% of all Credit defects. For the Income/Employment category, the largest subcategory was income documentation followed by income eligibility. The sub-categories could signal deterioration in borrower quality and bears watching in future quarters.
Defect rates in the two other areas improved, with the Assets category falling 55% in Q4 2019 (5.92%) from Q3 2019 (13.25%) and 21% from the prior year. The Liabilities category fell to 2.96% in Q4 2019 from 3.31% in Q3 2019 and was flat when compared to the prior year. However, the declines in critical defects in these categories were not enough to offset the increases in Credit and Income.
In total, six of the ten defect categories showed improvement from Q3 2019 to Q4 2019. Regulatory Compliance and Loan Package Documentation issues both fell over the full year 2019, with Compliance issues down 51% from 2018 and Documentation issues down 12% over that same period. ARMCO will closely monitor and expect some severe changes to the Income defect category as unemployment skyrocketed starting in March 2020 as a result of shut down orders in response to the COVID-19 pandemic.
Critical Defects by Fannie Mae Category: Q4 2019
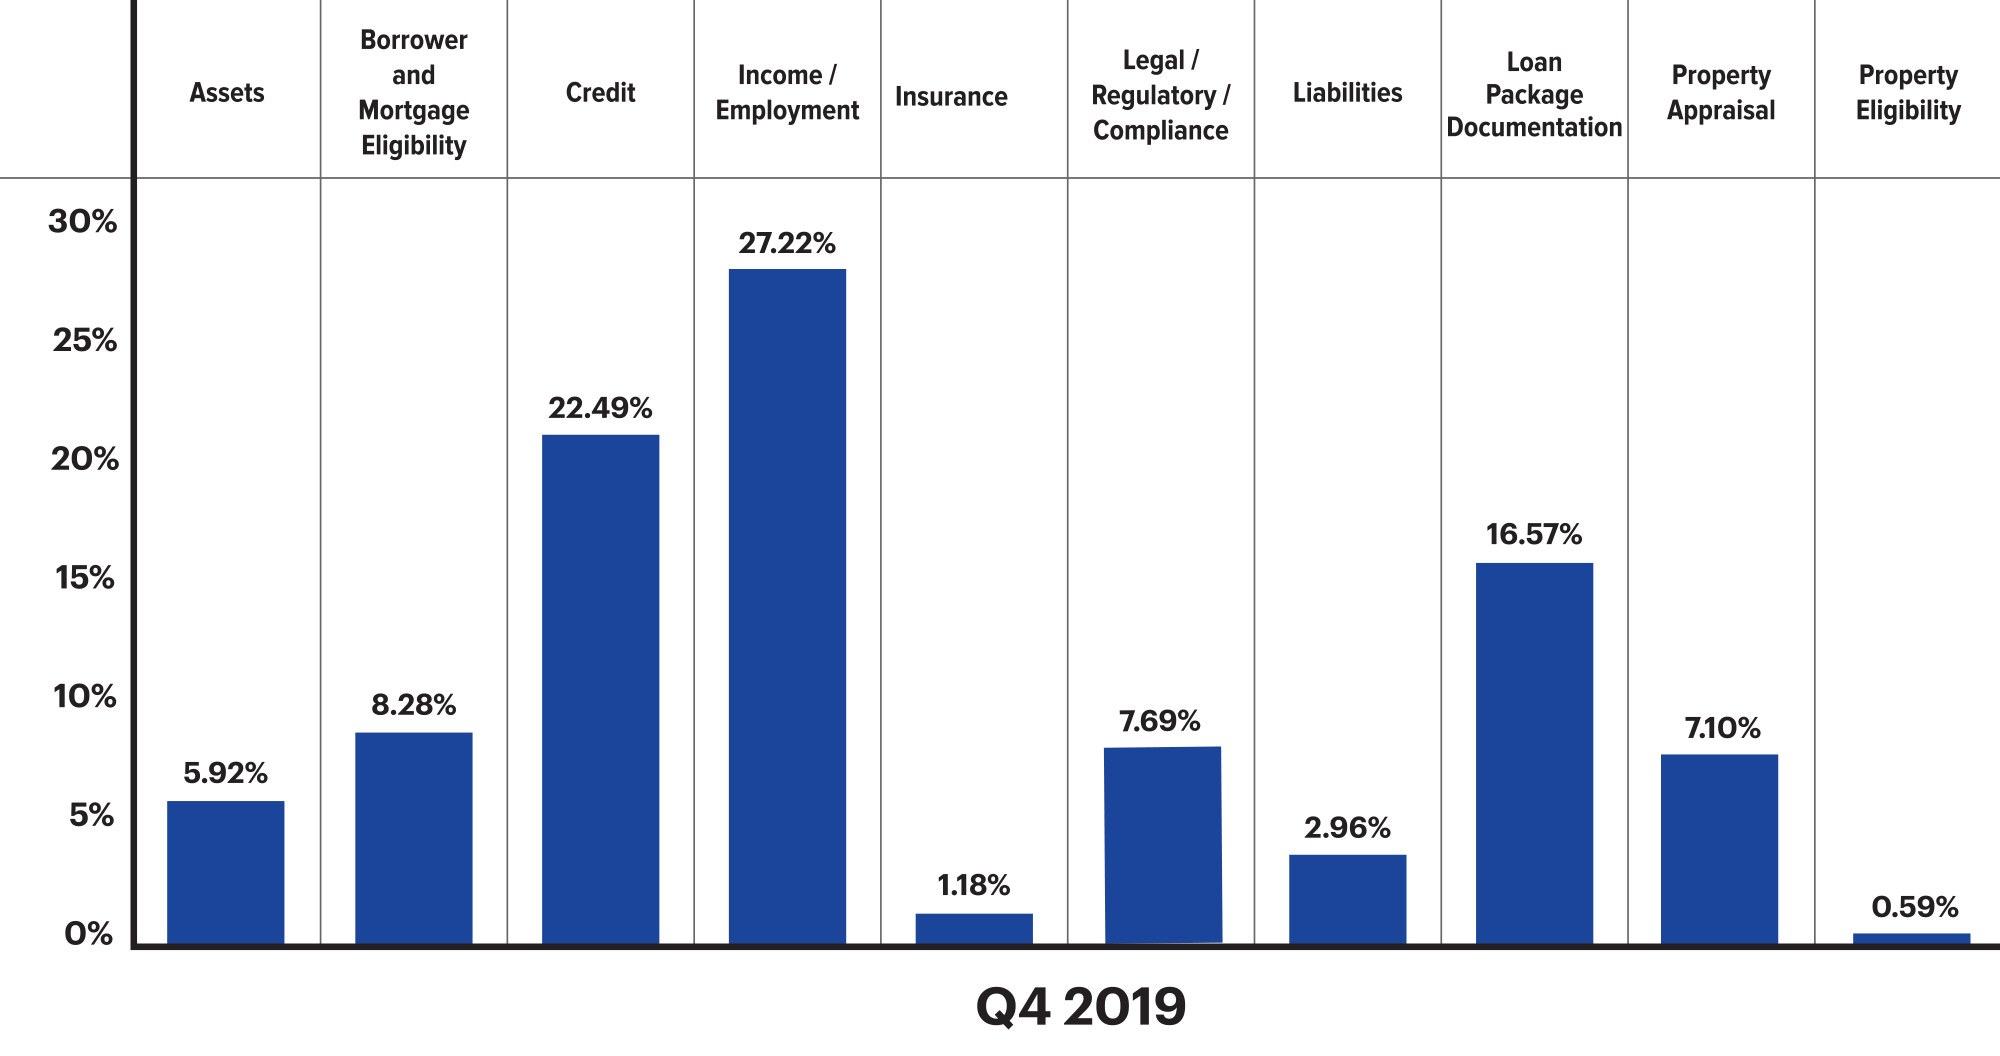
Figure 3 displays the Q4 net critical defects according to Fannie Mae category.
Critical Defects by Fannie Mae Category: Q3 2019 vs. Q4 2019
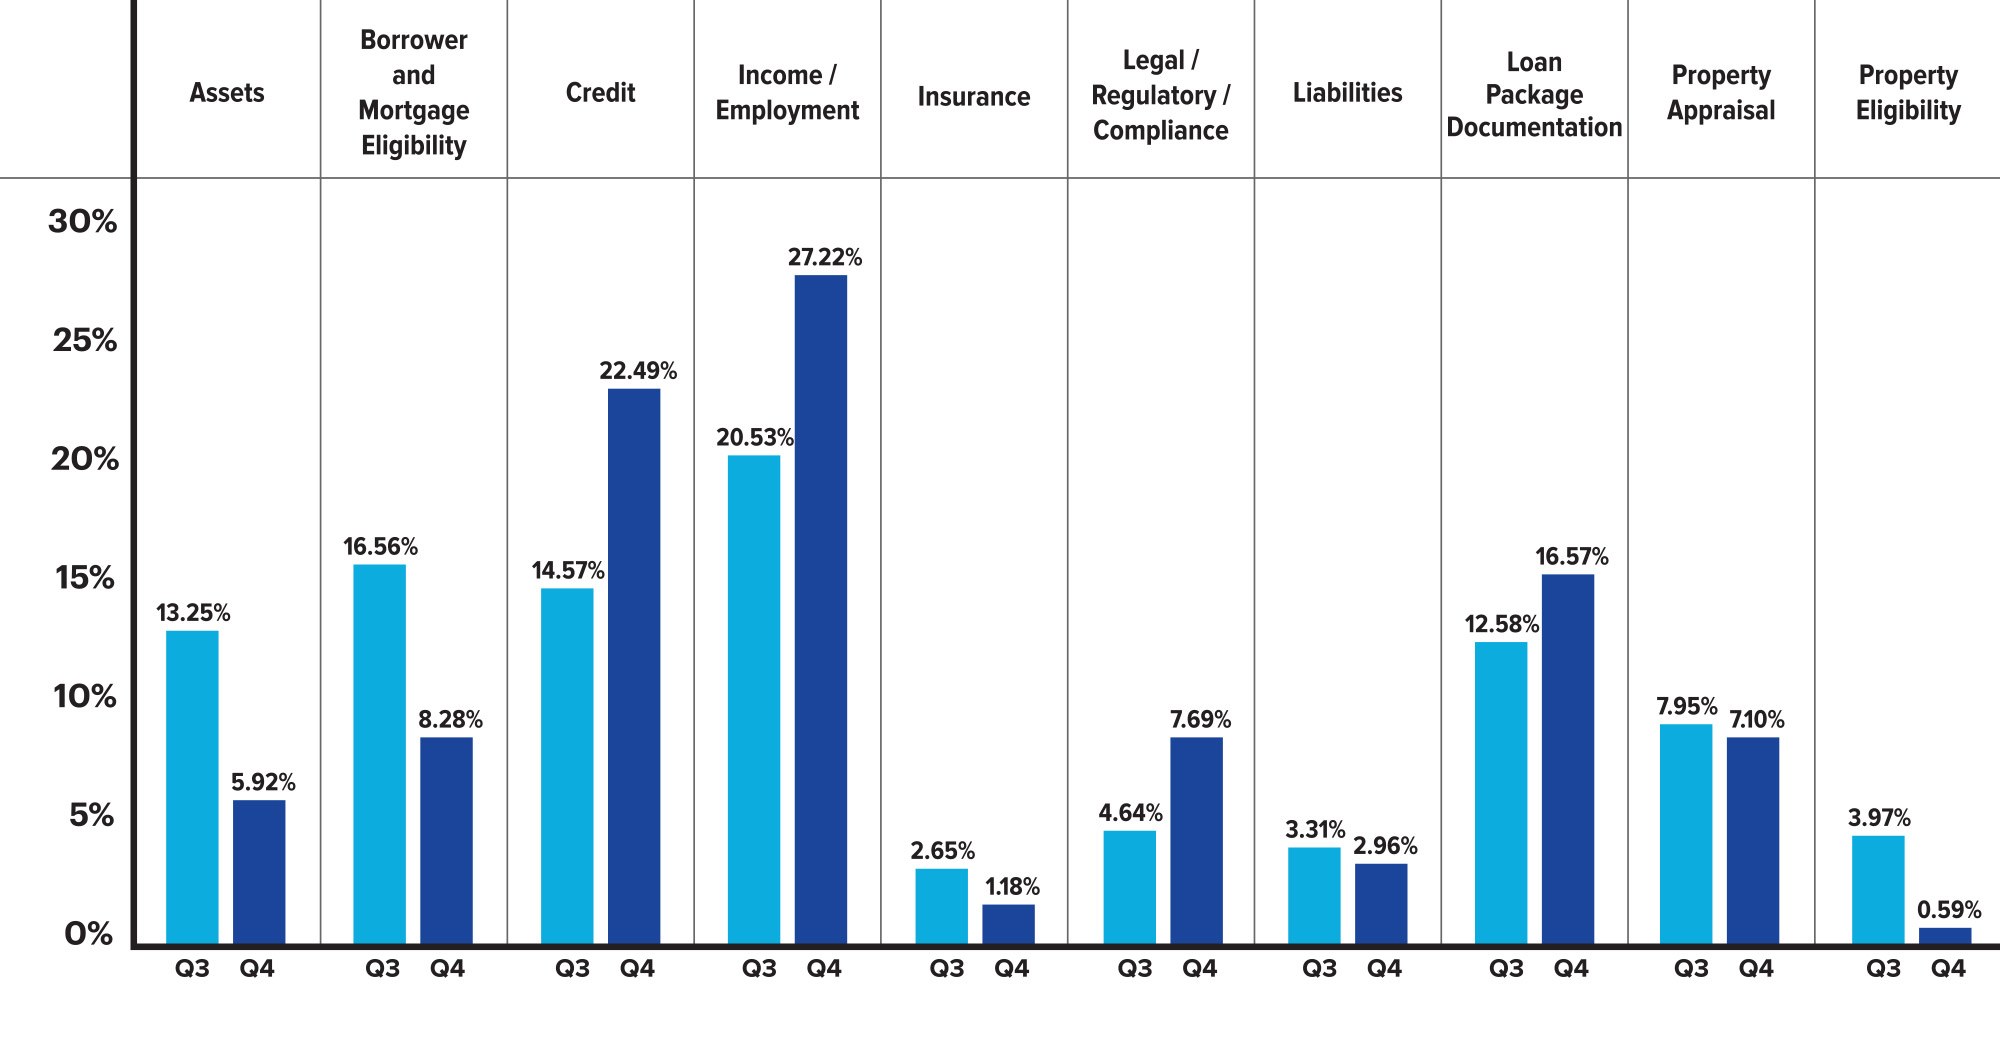
Figure 4 displays Q3 vs. Q4 2019 net critical defects according to Fannie Mae defect category.
Critical Defects by Fannie Mae Category: Q4 2019 vs. CY 2019
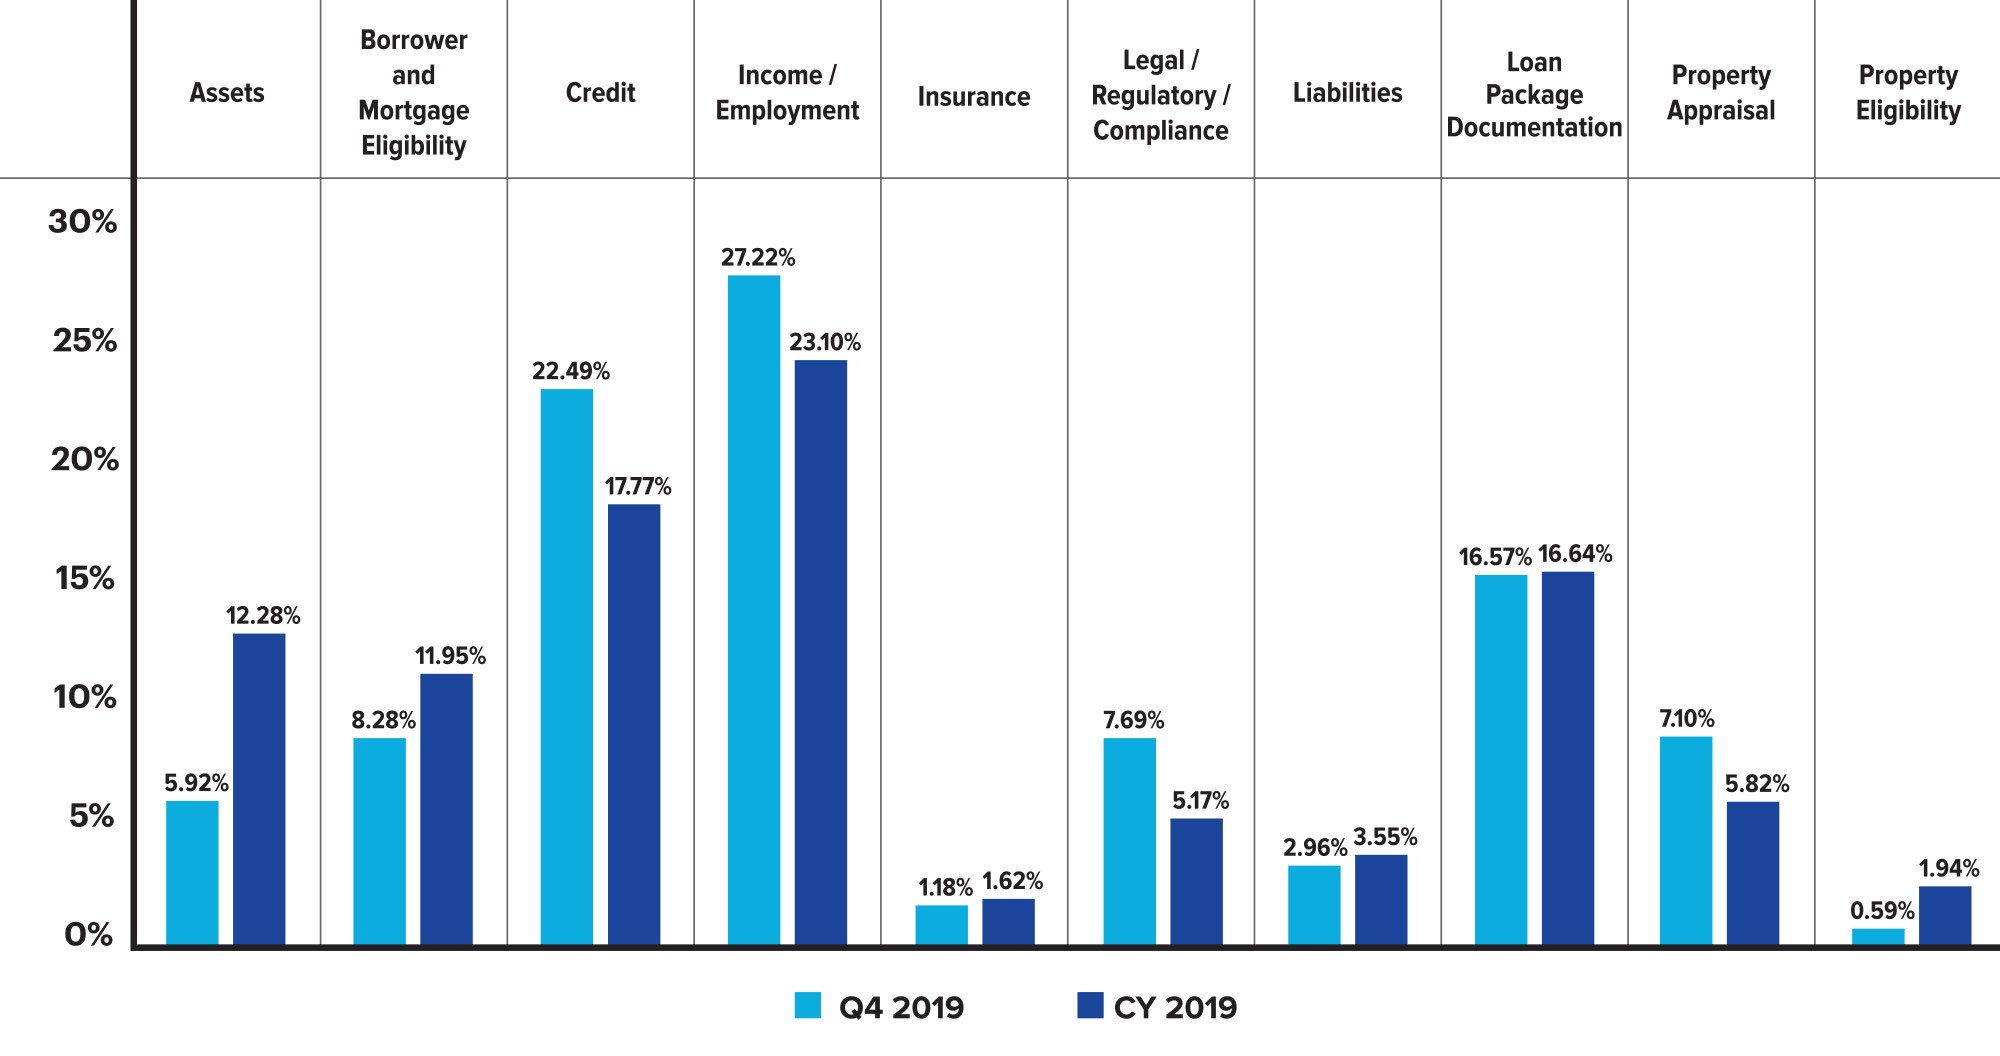
Figure 5 displays the Q4 2019 vs. CY 2019 net critical defects according to Fannie Mae category.
QC Industry Trends by Loan Purpose
With interest rates reaching record lows throughout CY 2019 and a dwindling supply of homes on the market, it is no surprise that the percentage of refinance transactions reviewed in CY 2019 exceeded that of CY 2018 by 7.48% (an increase from 27.91% to 35.39%). The Q4 2019 statistics show a continuing trend of increased refinance activity, with a corresponding decline in purchase transactions reviewed. 44.57% of loans reviewed in Q4 2019 were refinance transactions while the remaining 55.43% were purchases.
An increase in critical defects for refinance loans is inherent considering the growth in refinance activity. However, the gap between the percentage of defects according to loan purpose type and the percentage of loans reviewed for each transaction type was relatively small throughout CY 2019 (less than 1%). In contrast, Q4 2019 began to show signs of an imbalance and a deviation from CY 2018. Refinances made up 45% of transactions in Q4 2019 and 49% of critical defects. Those two percentages were equal for the full year, indicating a slight deterioration in refinance quality. Refinance performance deteriorated as compared to 2018, where 28% of transactions reviewed in CY 2018 were refinances but only made up 24% of all critical defects. This signifies that as refinance volume continues to grow and guidelines tighten, scrutiny on refinance transactions will increase in the QC world, particularly on cash out refinances.
As the industry continues into 2020, interest rates remain low, and Americans need cash more than ever due to the impacts of COVID-19. However, lenders are becoming increasingly cautious and must rely heavily on their QC teams to ensure the loans they are funding adhere to regulator, investor and insurer requirements, as well as internal quality standards.
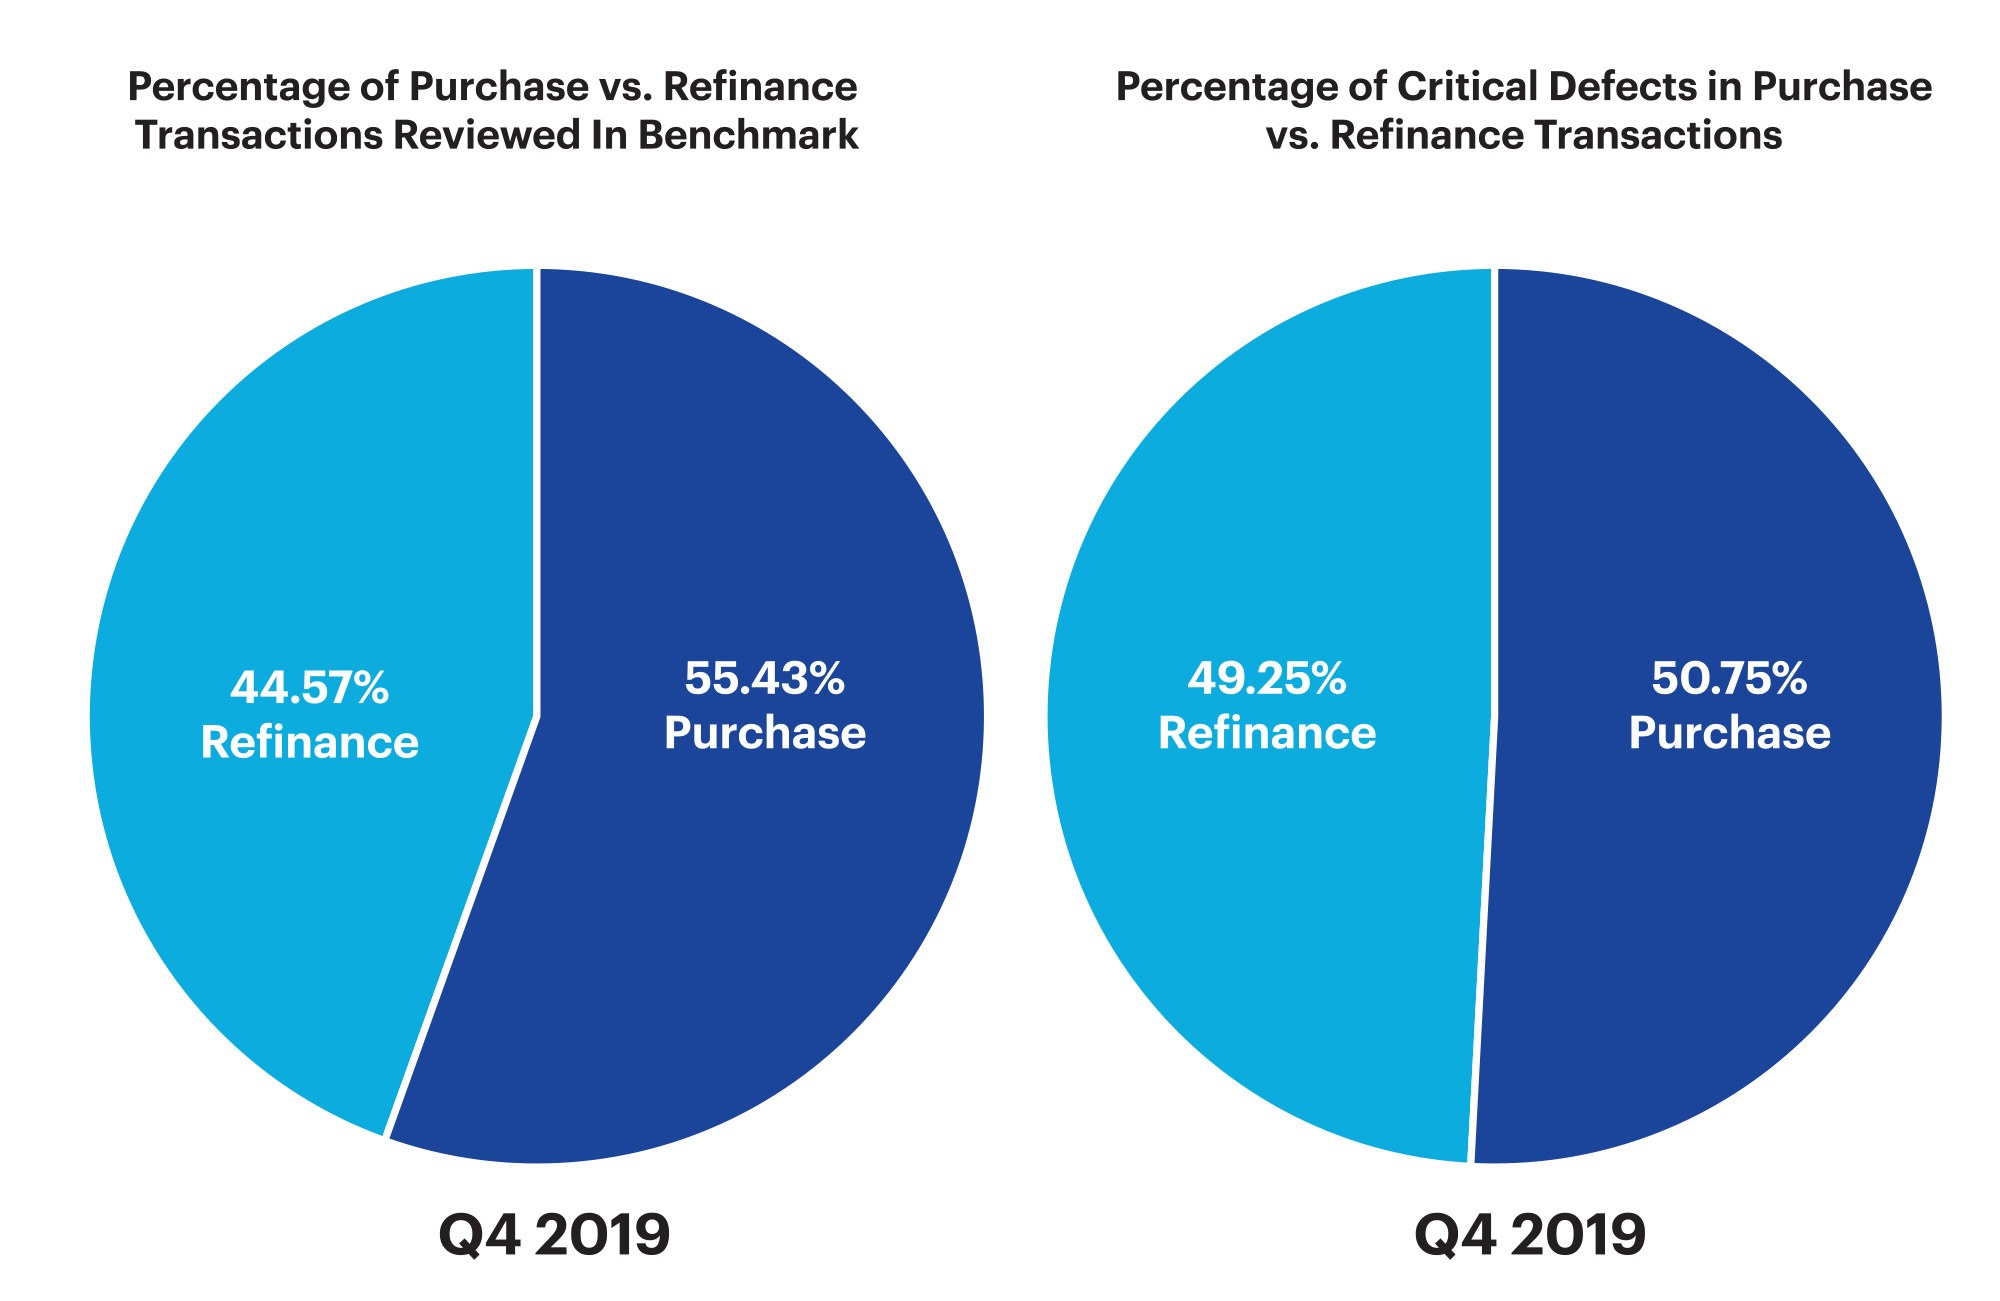
Figure 6 displays the share of transactions by loan purpose compared to the share of critical defects by loan purpose for Q4 2019.
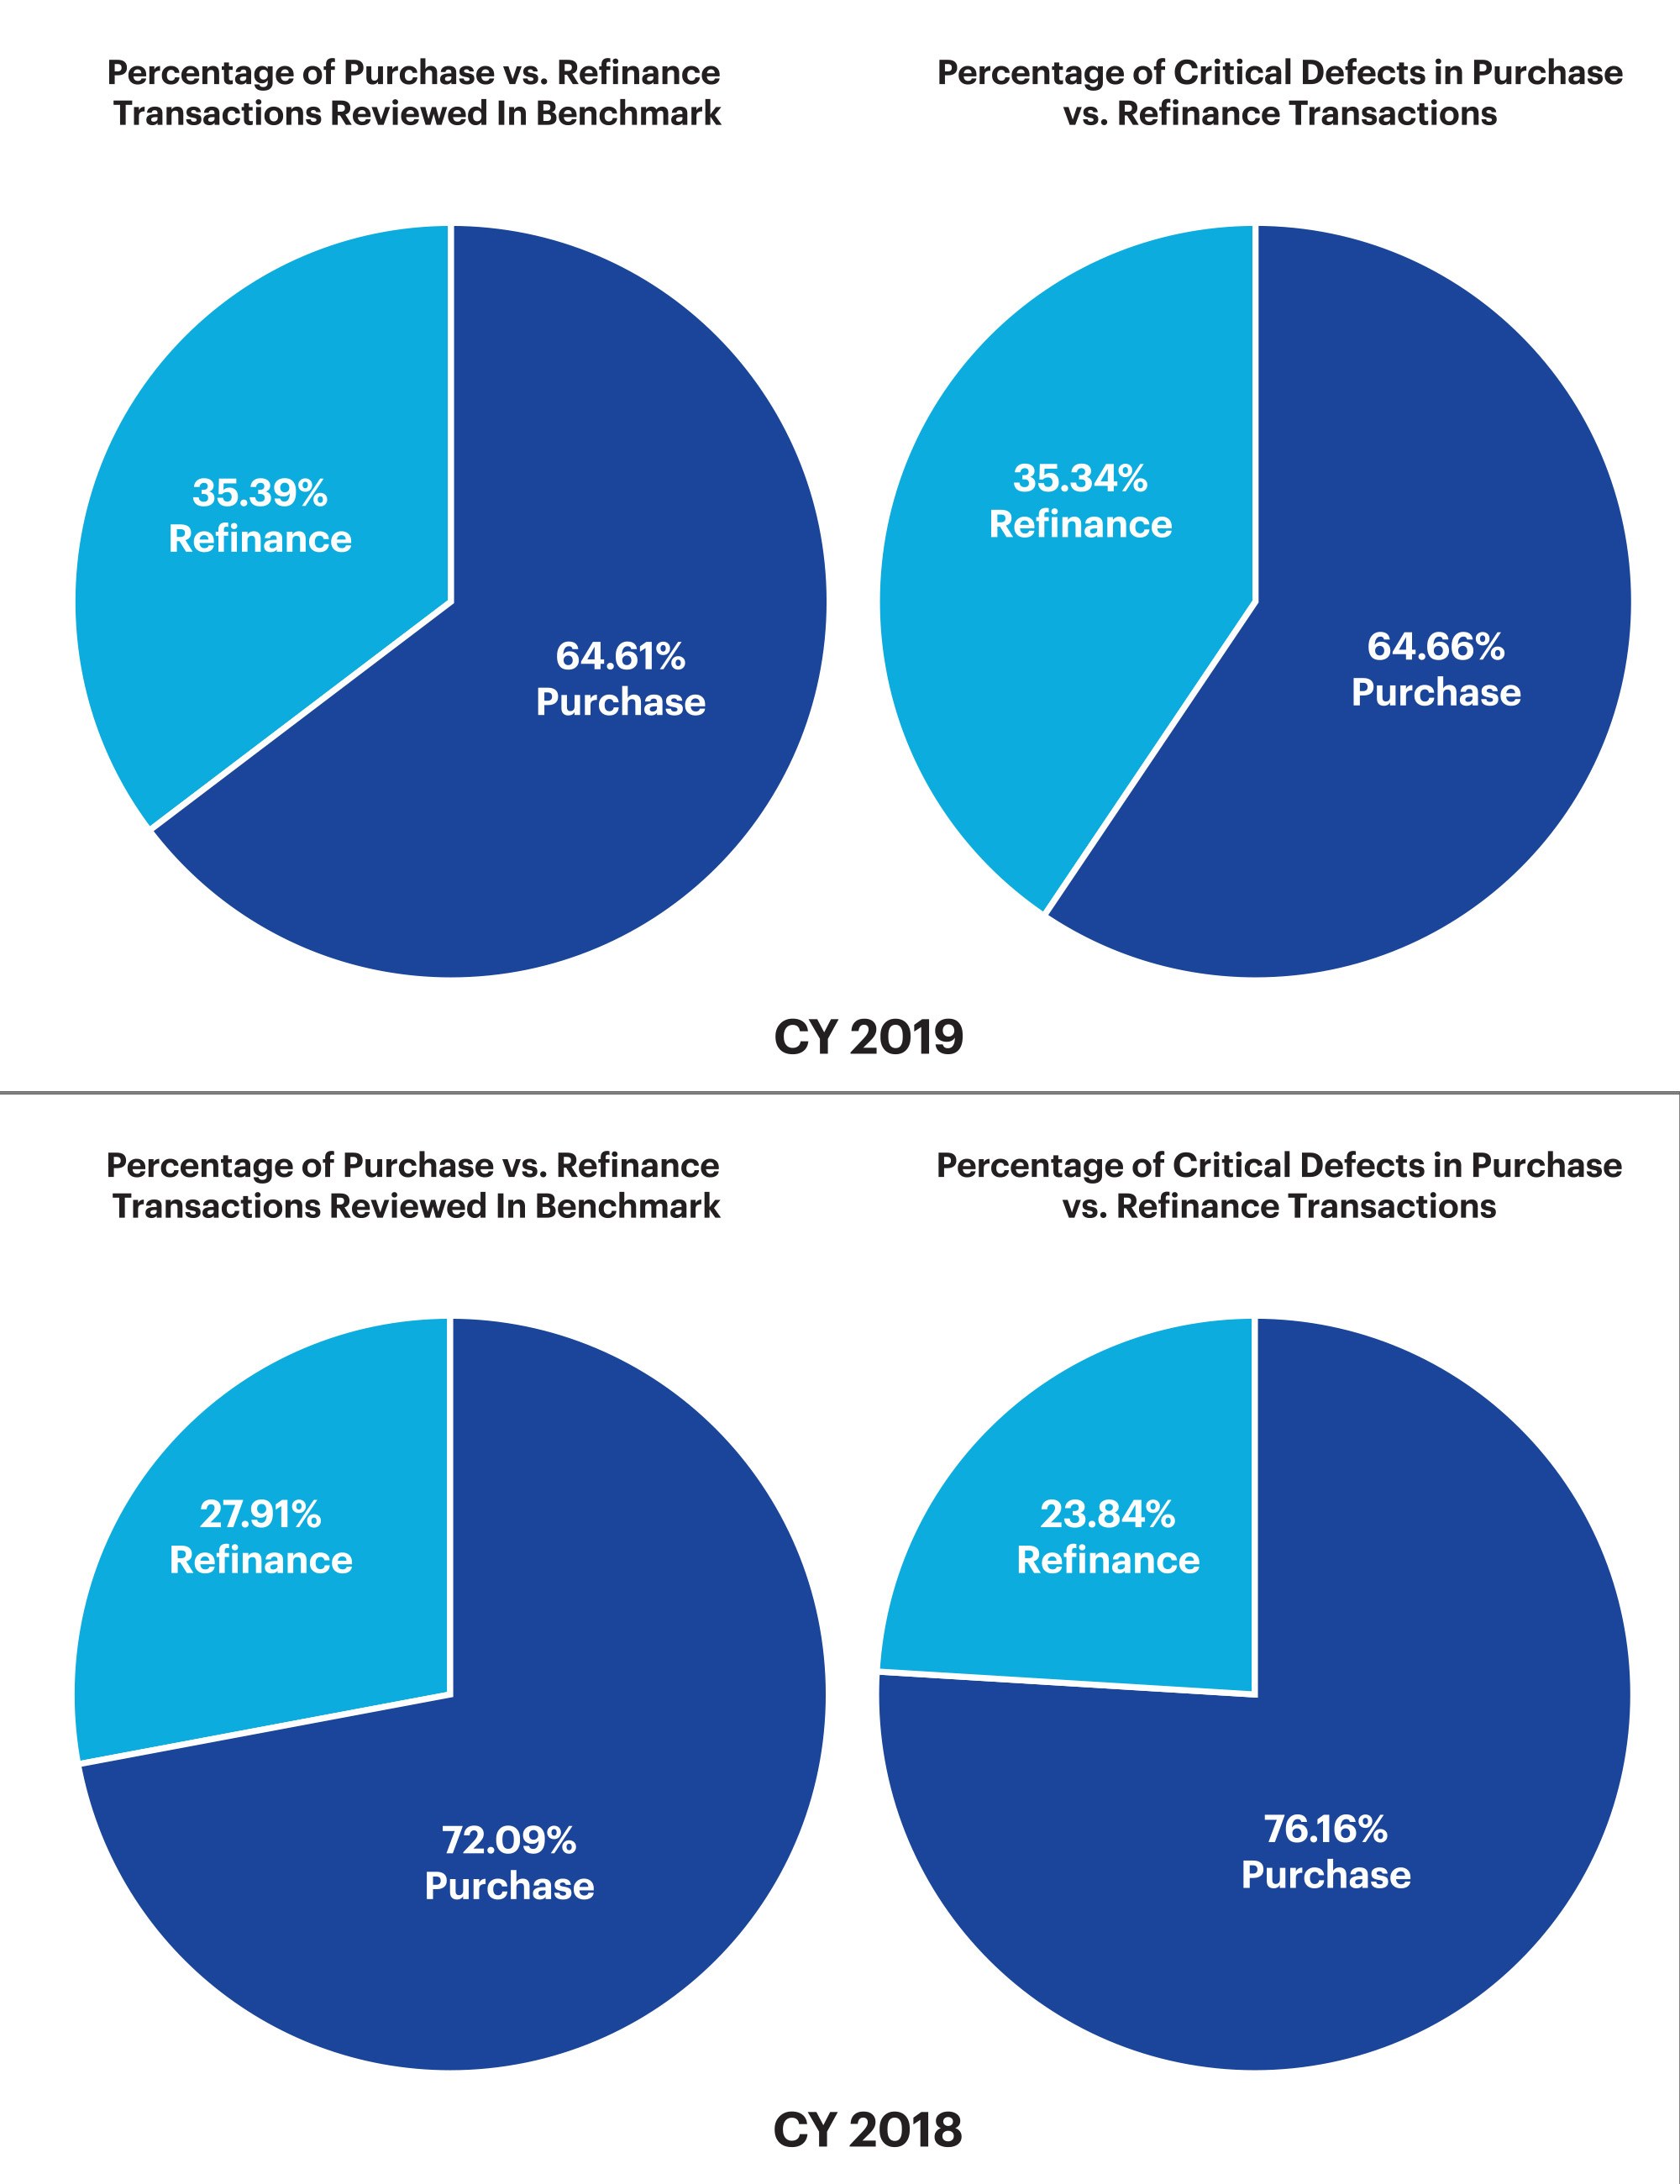
Figure 7 displays the share of transactions by loan purpose compared to the share of critical defects by loan purpose for CY 2019 vs. CY 2018.
QC Industry Trends by Loan Type
A significantly stronger refinance market in 2019 (as compared to 2018) drove the share of conventional loans to 61.99% for CY 2019. This is up 6% from the CY 2018 share of 56.40%. For Q4 2019, the share of 62.51% was very similar to the overall annual number. The increase in conventional loan share was offset by a 3.64% decline in FHA loans (from 31.07% in CY 2018 to 27.43% in CY 2019) and modest (1%) declines in both VA and USDA share.
Despite the share of conventional loans climbing 6% in CY 2019, the percent of defects attributed to those loans remained flat at 49% for the same period. CY 2018 defects on conventional loans were 49.28%, despite having a lower share of the loans reviewed. This is improvement is known as the ‘defect spread’, when overall share climbs and the defect spread does not.
The statistics also show a fairly significant degradation in FHA loan performance. The overall share for FHA loans in CY 2019 declined to 27.43%, but the defect share climbed to 42.37%. The defect spread of 15% was the highest of any quarter in 2019. For reference, the share of FHA loans in CY 2018 was 31.07%, and the defect share was 40.7% resulting in a defect spread of 9.63% and indicating an 5% improvement compared to CY 2019.

Figure 8 displays the loans reviewed and critical defects by loan type for Q4 2019.

Figure 9 displays the loans reviewed and critical defects by loan type for CY 2019 and 2018.
Conclusion
The quality statistics for CY 2019 generally show better performance when compared to 2018, and the industry can expect performance to continue to improve through Q1 2020. The world changed profoundly in March 2020, and it remains to be seen what this massive disruption to the economy and mortgages in particular means to mortgage lending. Aggressive Federal Reserve action drove rates down to historically low levels, and volume exploded in March and April. The question remains, “Will the impact of low mortgage interest rates offset the effects that dramatic unemployment increases, and government forbearance plans have on the industry?”
The FHA has been at the forefront of change, having been the first to give a servicing advance lifeline out to its counterparties. It also foresees demand for cash-out refinances and the risks those loans present. HUD took action in Q3 2019 by lowering the maximum LTV for cash-out refinances from 85% to 80%, citing its intention to reduce risk and preserve homeowner equity as it began to see cash-out refinance transactions representing an increasingly large portion of its overall business. That was not the only risk factor HUD addressed in 2019; it also updated the TOTAL Mortgage Scorecard in March of 2019 to produce a manual underwrite feedback decision when high or multiple risk factors are present (e.g. low FICO scores combined with high Debt to Income ratios).
Increases in refinance volume and stricter guidelines will result in more scrutiny on refinance transactions in the QC world, particularly on cash out refinances. As we continue into 2020, while interest rates are still low and Americans need cash more than ever due to the impacts of COVID-19, lenders are becoming increasingly cautious and must rely heavily on their QC teams to ensure the loans they are funding adhere to regulator, investor, insurer, as well as internal quality standards.
The COVID-19 pandemic has brought many changes to the origination and quality control processes. Reverifications is one area where the agencies have given lenders relief. Lenders now have some flexibility where contact and traditional measures with employees and financial institutions is difficult, if not impossible. Lenders are required to track these situations and later perform targeted sampling to conduct the typical reverification. Also, field review requirements have been relaxed, and in many cases where conducting a field review is not possible, the lender can utilize agency resources and checklists as a substitute. One area of quality control that ARMCO is keeping a particularly close watch on is Early Payment Default (EPD). Because of COVID-19 and the impact that shut-down orders have had on unemployment, it is reasonable to expect that EPDs will climb. The agencies also believe this and have made changes that give lenders a modicum of leeway in performing these reviews (utilizing sampling, etc.). ARMCO plans to report more on EPDs in coming reports.
Refinance performance worsened as compared to 2018 and as stated earlier in the report, increases in refinance volume and stricter guidelines, will result in more scrutiny on refinance transactions in the QC world, particularly on cash out refinances.
As we continue into 2020, while interest rates are still low and Americans need cash more than ever due to the impacts of COVID-19, lenders are becoming increasingly cautious and must rely heavily on their QC teams to ensure the loans they are funding adhere to regulator, investor, insurer, as well as internal quality standards.
And in closing, we hope that all readers of this report are well and staying safe.
About the ARMCO Mortgage QC Industry Trends Report
The ARMCO Mortgage QC Industry Trends Report represents a nationwide post-closing quality control analysis using data and findings derived from mortgage lenders utilizing the ACES Analytics benchmarking software.
This report provides an in-depth analysis of residential mortgage critical defects as reported during post-closing quality control audits. Data presented comprises net critical defects and is categorized in accordance with the Fannie Mae loan defect taxonomy.
About ARMCO
ACES Risk Management (ARMCO) is the leading provider of enterprise quality management and control software for the financial services industry. More than half of the top 50 lenders and two of the top five U.S. commercial banks rely on ACES Flexible Audit Technology® to improve audit throughput and quality while controlling costs. Unlike other quality control platforms, only ACES delivers Flexible Audit Technology, which gives independent mortgage lenders and financial institutions the ability to easily manage and customize ACES to meet their business needs without having to rely on IT or other outside resources. Using a customer-centric approach, ARMCO clients get responsive support and access to our experts to maximize their investment.
For more information, visit https://www.acesquality.com or call 1-800-858-1598.
Media Contact: Lindsey Neal | DepthPR for ARMCO | (404) 549-9282 | lindsey@depthpr.com
Learn more
Email us at info@armco.us
1. Freddie Mac’s Primary Mortgage Market Survey
2. MBA’s Profitability Report