ACES’ Mortgage QC Industry Trends Report represents an analysis of nationwide quality control findings based on data derived from the ACES Quality Management & Control Software.
Executive Summary
QC Industry Trends – Overview
QC Industry Trends – by Category
QC Industry Trends – by Loan Purpose
QC Industry Trends – by Loan Type
Early Payment Defaults
Conclusion
About this Report
Executive Summary
This report represents an analysis of post-closing quality control data derived from loan files analyzed by the ACES Quality Management and Control® benchmarking system during the fourth quarter of 2020 (Q4 2020) and incorporates data from prior quarters and/or calendar years, where applicable.
Findings for the Q4 2020 Trends Report were based on post-closing quality control data from approximately 100,000 unique records. All reviews and defect data that were evaluated for this report were based on loan audits selected by lenders for full file reviews.
Defects are categorized using the Fannie Mae loan defect taxonomy. Data analysis for any given quarter does not begin until 90-days after the end of the quarter to allow lenders to complete the post-closing quality control cycle, resulting in a delay between the end of the quarter and publication of the data.
NOTE: A critical defect is defined as a defect that would result in the loan being uninsurable or ineligible for sale. The critical defect rate reflects the percentage of loans reviewed for which at least one critical defect was identified during the post-closing quality control review, and all reported defects are net defects.
Summary of Findings
Amidst a positive interest rate environment and an improving economy, the critical defect rate moderated in Q4 2020. These factors, and more, led to strong volumes as lenders originated a record-breaking $4.3 trillion in mortgages. Refinances made up 65% of that production. With unemployment rates during Q4 being the lowest at any point during the pandemic, conditions were good for mortgage lending, and the overall critical defect rate reflects those conditions.
Report highlights include the following findings:
- The overall critical defect rate improved to 2.09%, which was lower than the prior quarter but still higher than other quarters in 2020.
- Loan Documentation defects rose in 2020, which was most likely driven by pandemic-related issues and symptomatic of manufacturing-related defects overall.
- Income/Employment defect share fell – a positive sign – but manufacturing-related defects grew.
- 2020 was dominated by refinances as a result of pandemic-driven historically/record low interest rates.
- Conventional loan share hit its highest point since ACES began publishing the QC Trends Report in 2016.
- Early Payment Defaults decreased in Q4 2020 and Q1 2021, providing some hope for the future, but lenders should be mindful of upcoming forbearance-related deadlines.
QC Industry Trends – Overview
The overall critical defect for Q4 2020 was 2.09%, an improvement from Q3’s all-time high rate of 2.34% and a 16% improvement overall. This represents the moderation we expected given Q3’s elevated rate. We optimistically hoped that Q3 2020 was the peak in the latest refinance cycle, and while one quarter’s worth of data is too early to definitively say, we did see the first step in what hopefully is the start of a downward trend.
In 2020, we had two quarters reaching over 2.0% in terms of the overall critical defect rate, and those quarters drove the average for 2020 to 1.97%, the highest on record. For perspective, calendar year 2019 had an average critical defect rate of 1.70%, which was 16% lower than 2020. The previous calendar year high was 2018, where the critical defect rate was 1.81%.
COVID-19 and the resulting global pandemic was a clear driver for these inflated defect rates. Another notable factor was the economic response that drove several key metrics including interest rates, mortgage volumes, and what is quite possibly a transformative trend in housing. We often talk about the cyclical nature of the mortgage industry, and from prior cycles, you can infer and make predictions based on where we are in the current cycle. Volume is obviously a key component, with interest rates driving volume and, therefore, staffing. Dramatic swings either way in volume tend to have an outsized impact on defect rates.
When looking at the average rate of a 30-year fixed rate mortgage, it is easy to see why 2020 was a record year for mortgage originations. Using Freddie Mac’s Primary Mortgage Market Survey1, Q4 2020 saw the lowest rates of the year. The average rate at the start of Q4 was 2.93% and ended the quarter at 2.67%. Looking more broadly, the average rate on a 30-year fixed mortgage began in 2020 (pre-pandemic) at 3.72%. Over the course of the year and bottoming in Q4, mortgage interest rates fell more than a full percentage point, resulting in an explosion in loan volume.
If you look a little further forward, the end of Q4 2020 was literally the trough on the interest rate curve. From January 2021 thru April, rates steadily increased until peaking at 3.18% before moderating a bit through June. As it relates to defect rates, 2020 and more recent interest rate changes mean changes to volumes, which burdens lenders’ operations in both directions.
Economically speaking, unemployment is the other macroeconomic area impacted by the pandemic. Increases to the unemployment rate in and of themselves do not necessarily have a direct impact on the critical defect rate. But similar to the interest rate discussion, rapid economic volatility can have a significant impact. The authority on unemployment rates is the Bureau of Labor and Statistics (“BLS”). The pre-pandemic unemployment rate according to the BLS was under 5% for an extended period of time. Suddenly, the economy shut down in February 2020, and by early March, the rate rose to 15%. Most economists would describe this as a “white swan event”, something that could not have been foreseen and has an outsized impact on many things. By the current quarter (Q4 2020), the unemployment rate declined to approximately 6.5%, still way above historical norms.
Yes, critical defect rates for Q4 and the entire calendar year of 2020 were disappointing because they were higher than years’ past. But given the disruptive force of the pandemic, we are not neither too surprised nor too concerned, but rather encouraged by the slight decline in the defect rate for Q4 2020. If you had said back in April 2020 that we would come out of the pandemic with record-breaking volumes and only see slight increases to mortgage defects – despite unemployment reaching all-time highs and major parts of the economy being shut down for 12+ months – I believe most in our industry would have been happy with that.
1 http://www.freddiemac.com/pmms/
Critical Defect Rate by Year: CY 2019 vs CY 2020
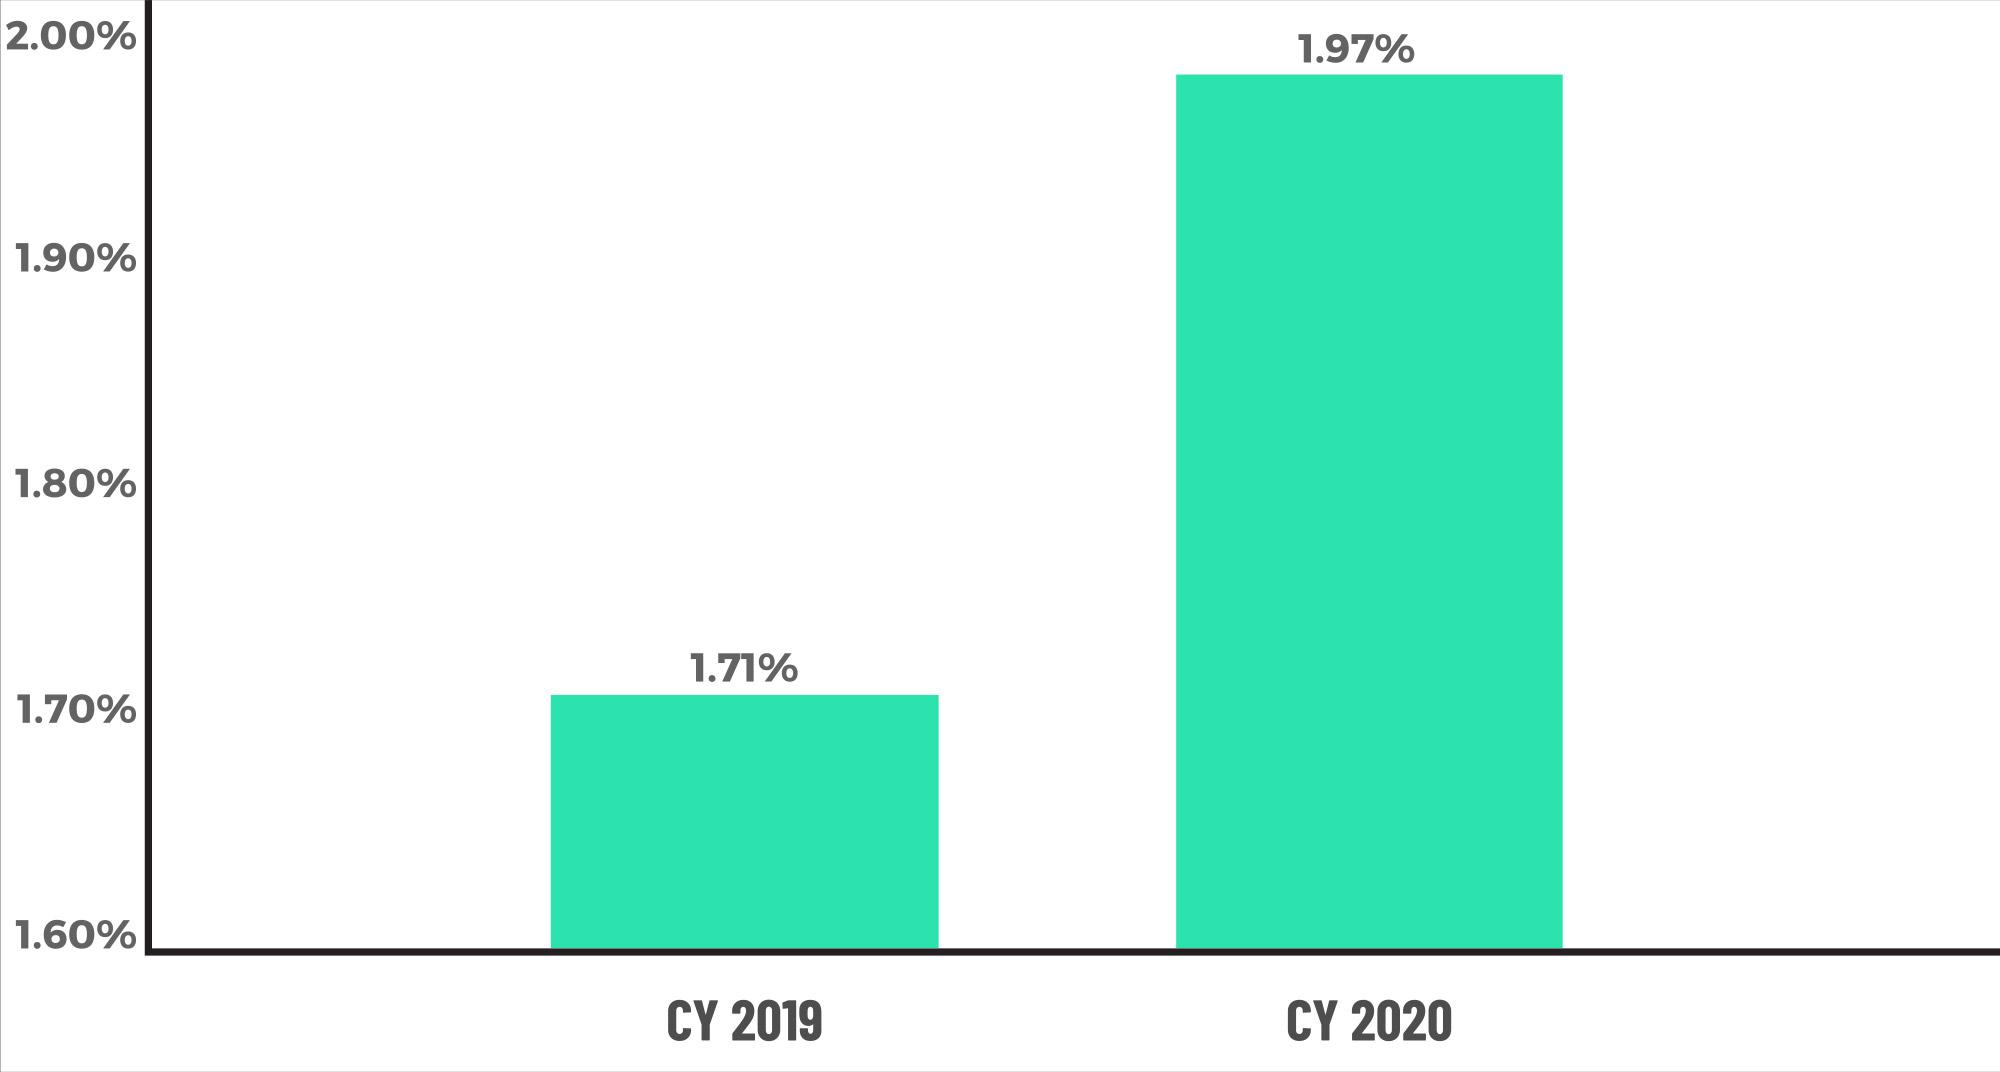
Figure 1 displays critical defect rates for CY 2019 vs. CY 2020.
Critical Defect Rate by Quarter: Q1 2020 — Q4 2020
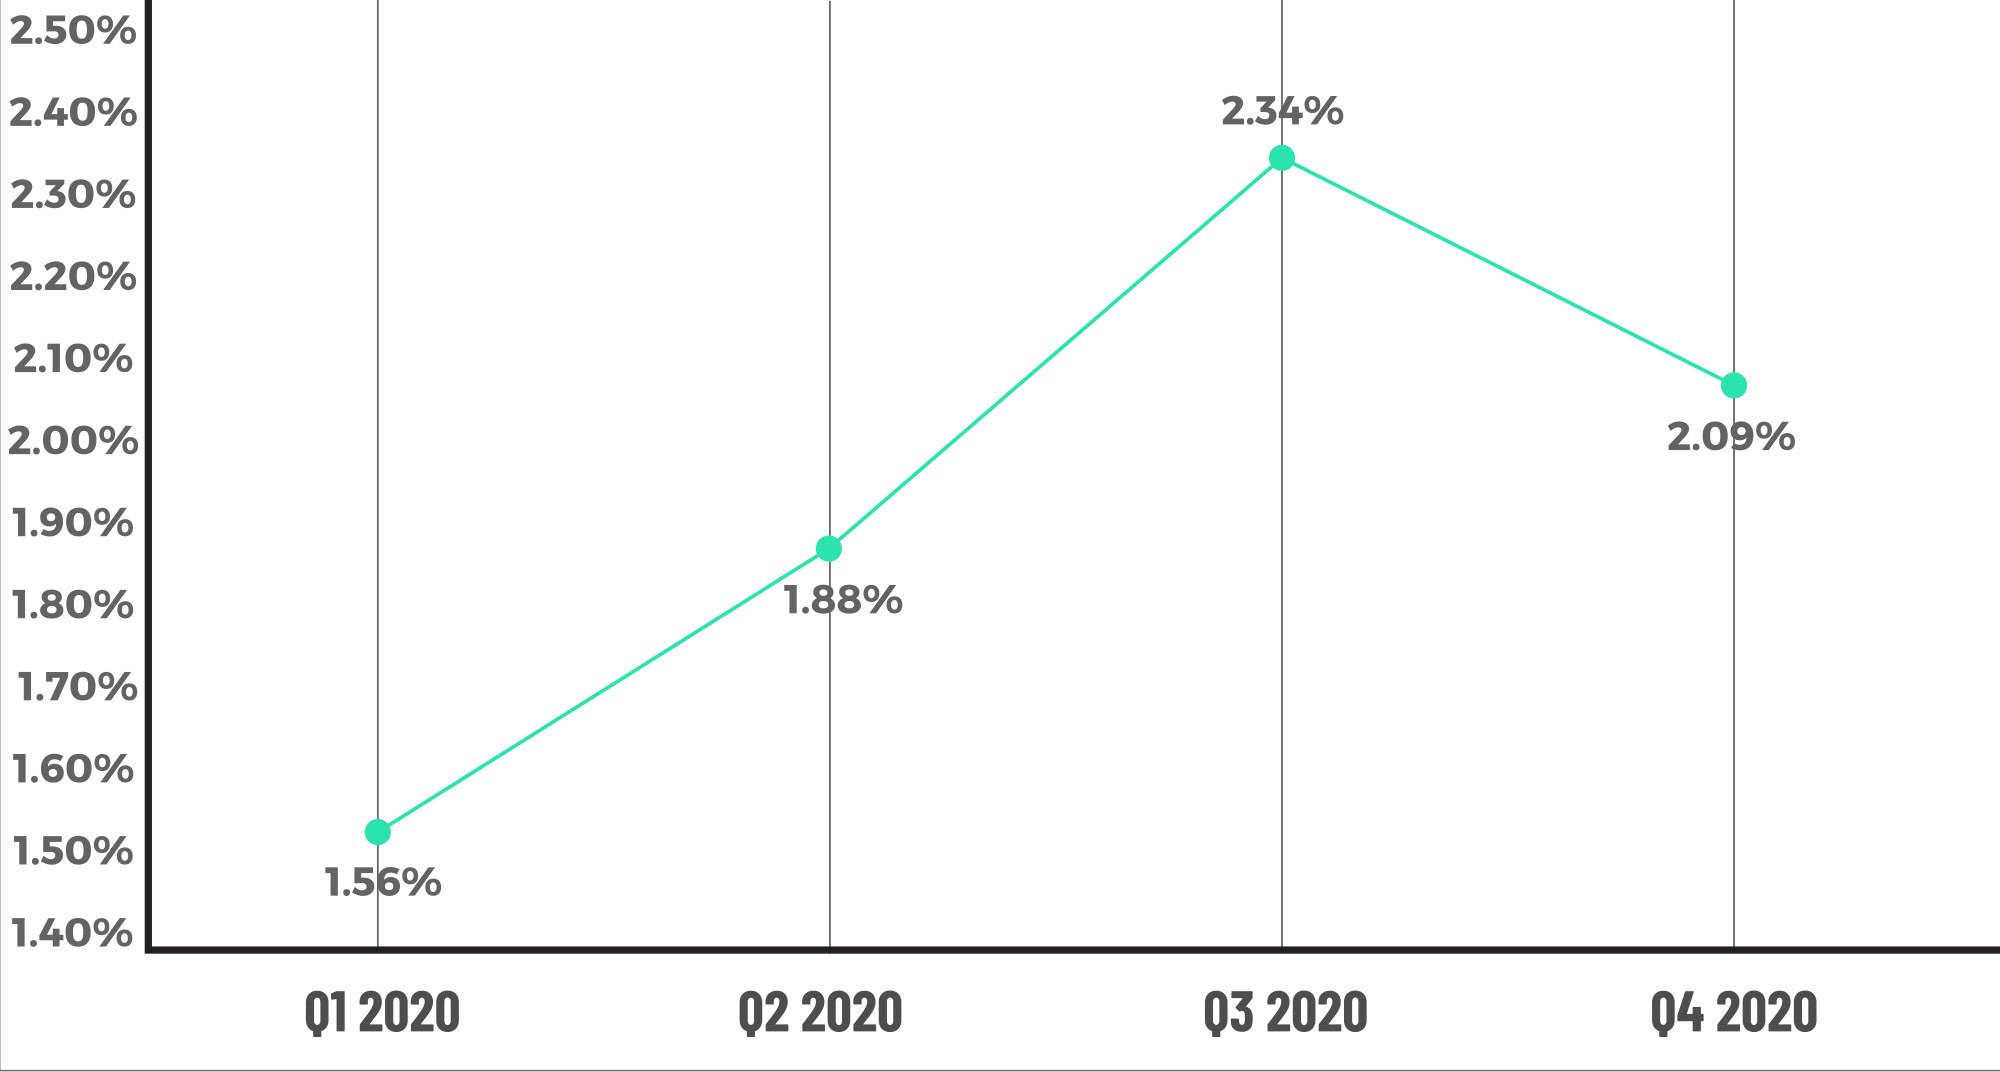
Figure 2 displays the percentage of loans with critical defects by quarter, for Q1 2020 through Q4 2020.
QC Industry Trends by Defect Category
Last quarter we highlighted increases in several of the manufacturing related categories (Appraisal, Loan Documentation, and Borrower/Mortgage Eligibility) and speculated that the increase in these types of defects was impacted by the mid-quarter announcement of the Adverse Market Refinance Fee and the resulting rush to close loans. The data for Q4 2020 shows improvement in each of these metrics and is led by the Loan Documentation category, which made up 14.75% of all defects in Q4 as compared to 18.75% in Q3. The increase in appraisal defects last quarter were of particular concern given the property appreciation environment, shortage of appraisers in a record volume period, and continued problems in accessing borrower homes during a pandemic. Therefore, a 57% decline in share of Appraisal defects in Q4 (2.87%, down from a share of 6.70% in Q3) was a welcome result.
The other metric reported on extensively is the Income/Employment category, which made up 23.77% of all defects in Q4 2020 and increased from the prior quarter’s share of 20.98%. Q2 2020 had the highest unemployment rate and the highest share for the Income/Employment category at 30.19%. So even though this quarter’s rate was higher than the prior quarter, it is still a marked improvement from the peak during the year. Improvement was also noted in the other key underwriting categories. Credit defects fell 31% (7.38% share this quarter, down from 10.71% prior); the Liabilities defect category fell 25% (5.33% this quarter from 7.14% prior); and finally, the share of defects in the Assets category was largely unchanged (9.02% this quarter, 9.82% prior). Thus, three out of the ‘Big Four’ core underwriting categories saw a decline in defect share.
Critical Defects by Fannie Mae Category: Q4 2020
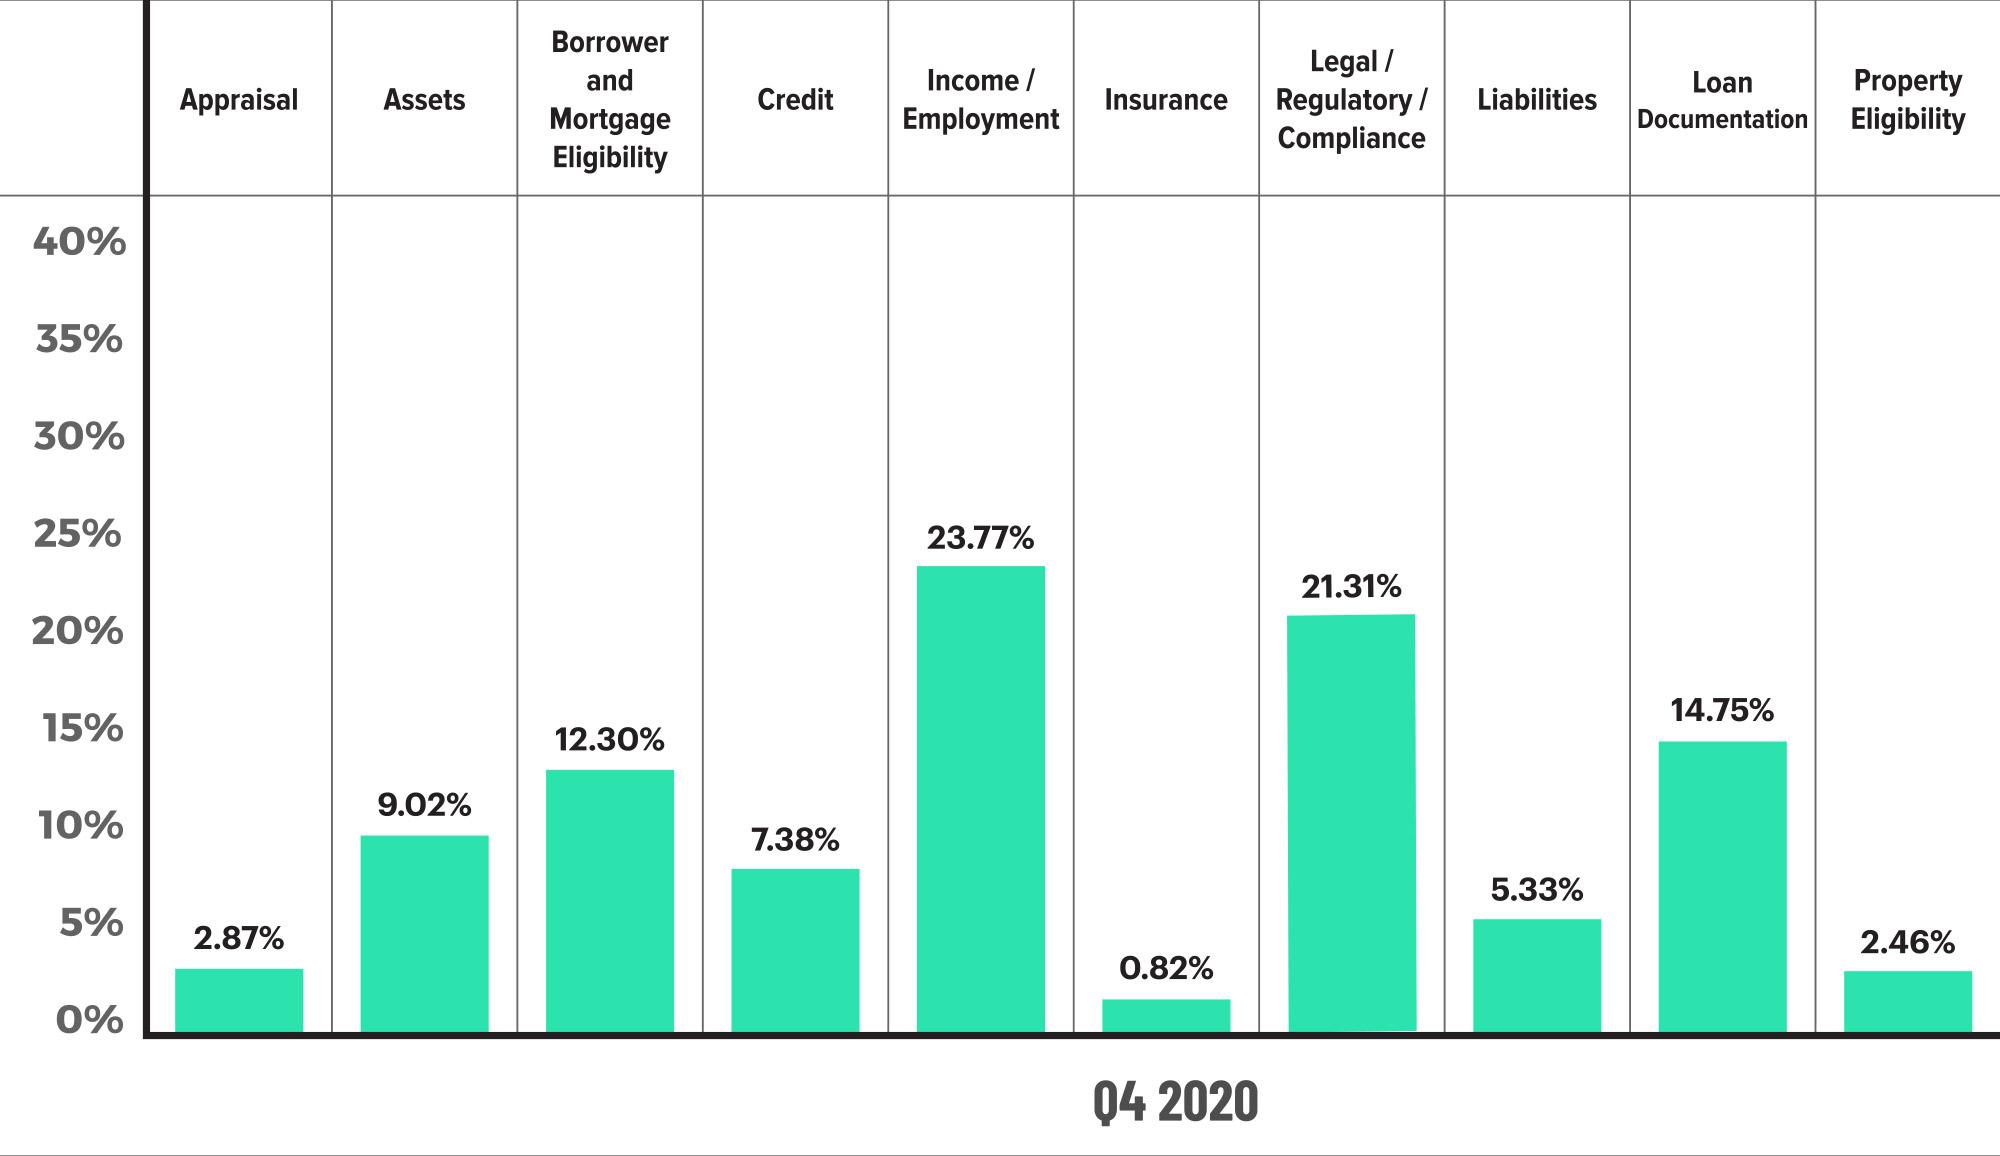
Figure 3 displays the dispersion of critical defects across Fannie Mae categories for Q4 2020.
Critical Defects by Fannie Mae Category: Q3 2020 vs. Q4 2020
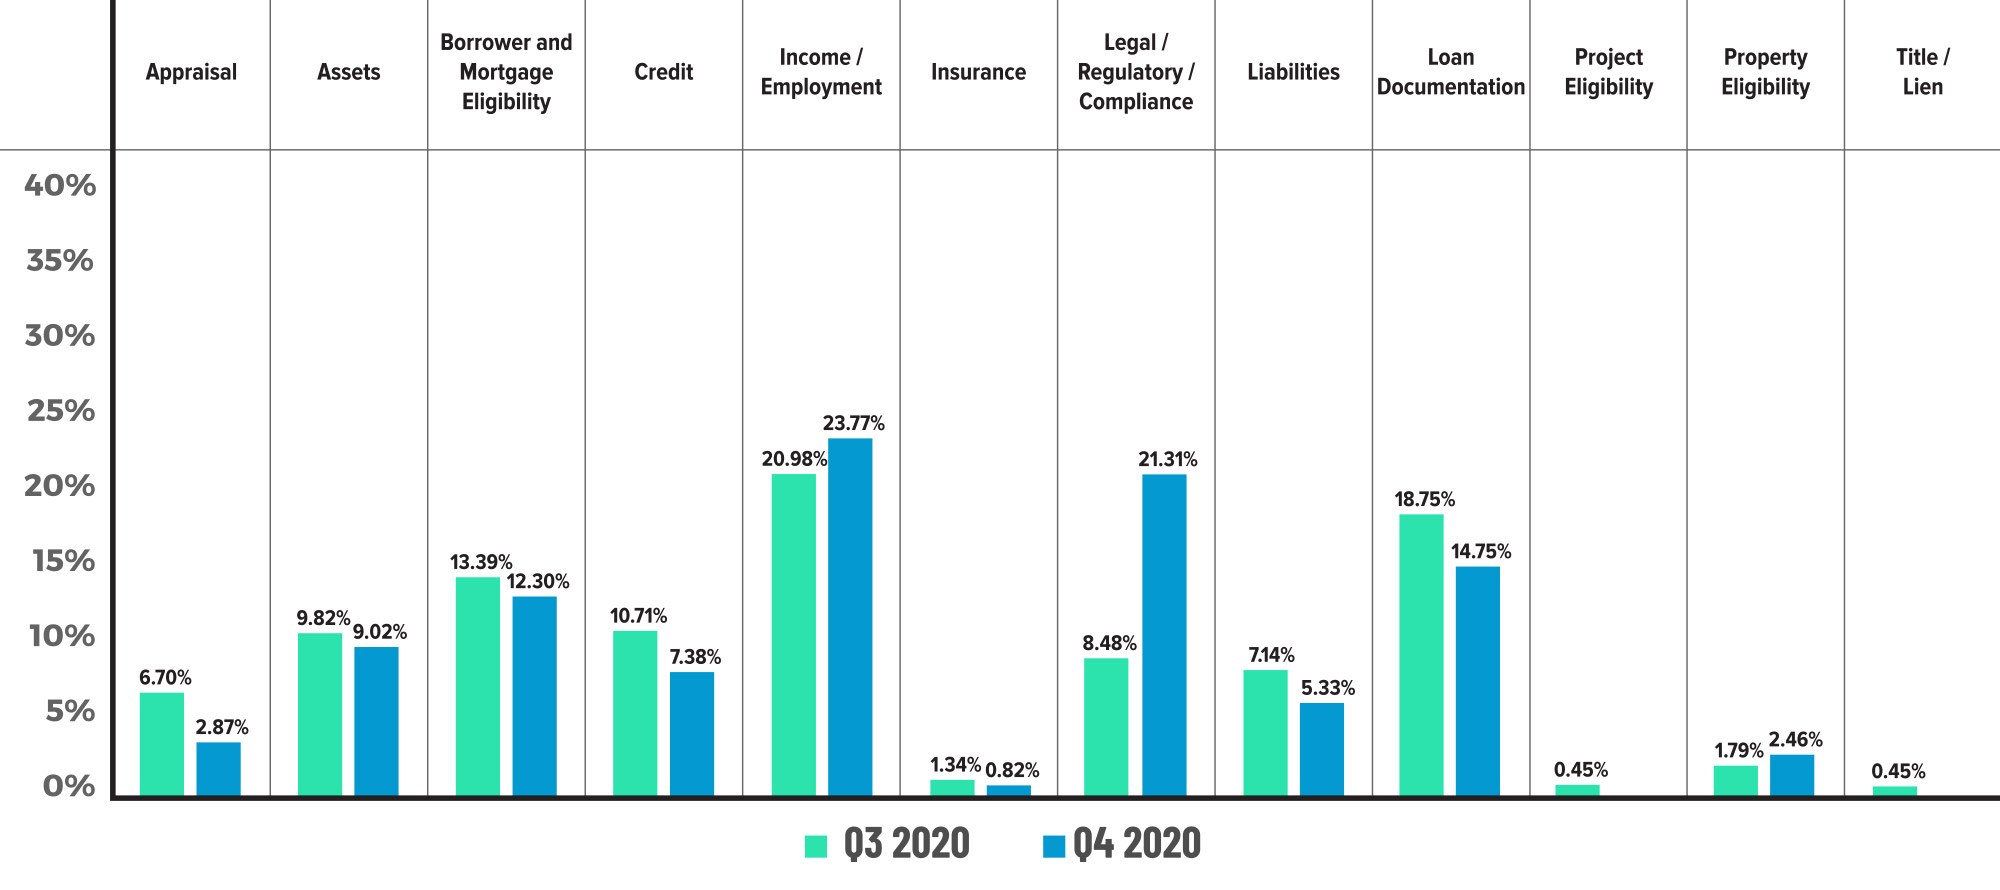
Figure 4 displays the critical defect rate by Fannie Mae category comparing Q3 2020 to Q4 2020.
Looking more broadly at defect categories for the entire year of 2020, Income/ Employment is the most notable. The defect share for 2020 was 23.95%, almost exactly the same as 2019’s at 23.10%. However, the difference in economic conditions between these two years could not be more stark, and the fact that mortgage lenders self- corrected and adapted when faced with the pandemic-related challenges of verifying this information and ultimately kept the share of Income/Employment defects flat year- over-year is a great testament to mortgage lenders’ efforts to maintain loan quality despite the challenging circumstances of 2020. Of the remaining core credit categories, only Liabilities increased in 2020 compared to the previous year (5.58% share vs. 3.55% in 2019). The defect share in both the Assets and Credit categories improved year-over-year (Assets: 10.27%, down from 12.28%; and Credit: 12.80%, down from 17.77%).
Aside from the Income/Employment category, the manufacturing-related Loan Documentation category had the second largest defect share in 2020 at 14.96%. The overall number is not surprising given the plethora of changes enacted during the pandemic and is actually lower compared to CY 2019’s share of 16.64%. Along those same lines, the category with the largest increase year-over-year was Compliance, which had a defect share of 12.42% as compared to 2019 where the defect share was 5.17%. When comparing all 10 defect categories for 2019 versus 2020, only the Compliance and Liabilities categories experienced increases. Five categories declined in 2020 compared to the previous year: Appraisal, Assets, Credit, Insurance and Loan Documentation. The remaining three categories (Borrower/Mortgage Eligibility, Income/Employment, and Property Eligibility) were flat year-over-year. It is important to keep in mind that because volumes and defect rates were higher overall in 2020, comparisons to prior years should be viewed in that context.
Critical Defects by Fannie Mae Category: CY 2019 vs. CY 2020

Figure 5 compares the dispersion of critical defects across Fannie Mae categories for CY 2019 and CY 2020.
QC Industry Trends by Loan Purpose
Interest rates declined steadily during Q4 2020, so it is no surprise that refinances drove the market. ACES’ data shows that refinances dominated and picked up share over the previous quarter. In Q4, refinances made up 54.20% of the reviews, with purchases ending at 45.80%. Refinances also gained when compared to Q3’s 52% share. We speculated last quarter that the refinance share in quality control data was being negatively impacted by sampling criteria, and that appears to be true based on this quarter’s data. There is no question that refinances remained strong in Q4, and, in fact, for the entire year. Black Knight’s Mortgage Monitor2 report estimates that a record-breaking $4.3 trillion in residential mortgages were originated in 2020, and that refinances comprised $2.8 trillion (65%) of that amount. Because ACES reports on post- close quality control data where sampling is involved, our data will slightly differ from that of Black Knight’s, but follows a very similar pattern. The share of refinances in ACES’ data was 35% for 2019 and 54% for 2020. That is an extreme year-over-year increase considering that 2019 also had low interest rates and elevated volumes.
The performance by loan purpose did not change much from quarter-to-quarter. Similar to Q3, refinances made up 53.77% of defects (53.30% last quarter), and purchases were 46.23% of defects, which was slightly lower than last quarter’s 46.70%. The share of defects for refinances and purchases was the same as the overall share for reviews done in ACES for the past two quarters (Q3-Q4 2020). Historically, the share of refinances reviewed was typically higher than the share of defects on refinances. We now have a two-year trend where market share and defect performance are equal, diverting the historical norm where refinance defects made up roughly 5% less than the refinance share. This degradation in performance on refinances can be traced to several factors, including historically high volumes, manufacturing-related defects (re: mistakes, largely caused by volumes), COVID-19 and the resulting changes in employment.

Figure 6 displays the loans reviewed and critical defects by loan type for Q4 2020.

Figure 7 displays the loans reviewed and critical defects by loan type for CY 2020.
2 https://cdn.blackknightinc.com/wp-content/uploads/2021/04/BKI_MM_Mar2021_Report.pdf
QC Industry Trends by Loan Type
Conventional lending continued to pick up market share in Q4 2020, finishing the quarter at 74.05% and up 2.04% from Q3 (72.01%). That share is an all-time high and comes on the back of historical volumes and record-low interest rates. The increase in Conventional share also continues to come at the expense of FHA lending, a trend that has been prevalent throughout 2020. FHA ended the quarter with a 16.16% share, down 3.27% from Q3’s share of 19.43% (a quarter-over-quarter decline of 17%). The share of VA and USDA loans were steady in Q4, with VA loans making up 6.79% of reviews (vs. 6.18% in Q3) and UDSA share at 3.01% in Q4 (vs. 2.38% in Q3). Clearly, the current interest rate environment is driving refinances, and strong property appreciation is allowing more and more borrowers to take advantage of Conventional loans.
The rise in Conventional lending is even more prominent when looking at the year-over- year statistics. For CY 2020, Conventional loans held a 70.46% share, which represented a 14% increase compared to CY 2019. The share of FHA loans for CY 2020 was 19.85%, down from CY 2019’s 27.43%. That is 7.5% lower and an overall decrease of 28%. The CY 2020 and 2019 shares for VA and USDA loans were within 1% of each other, meaning shares were effectively stagnant.
Similar to defect performance by Loan Type, record lending volumes also impacted Loan Type performance. Historically, Conventional loan review share is higher than the defect share. In Q4 2020, Conventional loans underperformed with a 74.05% review share and 78.26% share of the defects, resulting in a ‘spread’ of -4.21%. This does not materially differ from Q3, where the spread was -3.25%. The most notable differences are evident in the year-over-year comparison. For CY 2020, Conventional loans had a 70.46% share and a 72.71% share of the defects, with a spread of -2.25%. Compare that to CY 2019, where the review share was 61.99% and the defect share was 49 %, resulting in a spread of 12.99% (meaning the share of reviews was 12.99% larger than the share of defects). That is a 15+% difference in year-over-year decline in performance for Conventional loans.
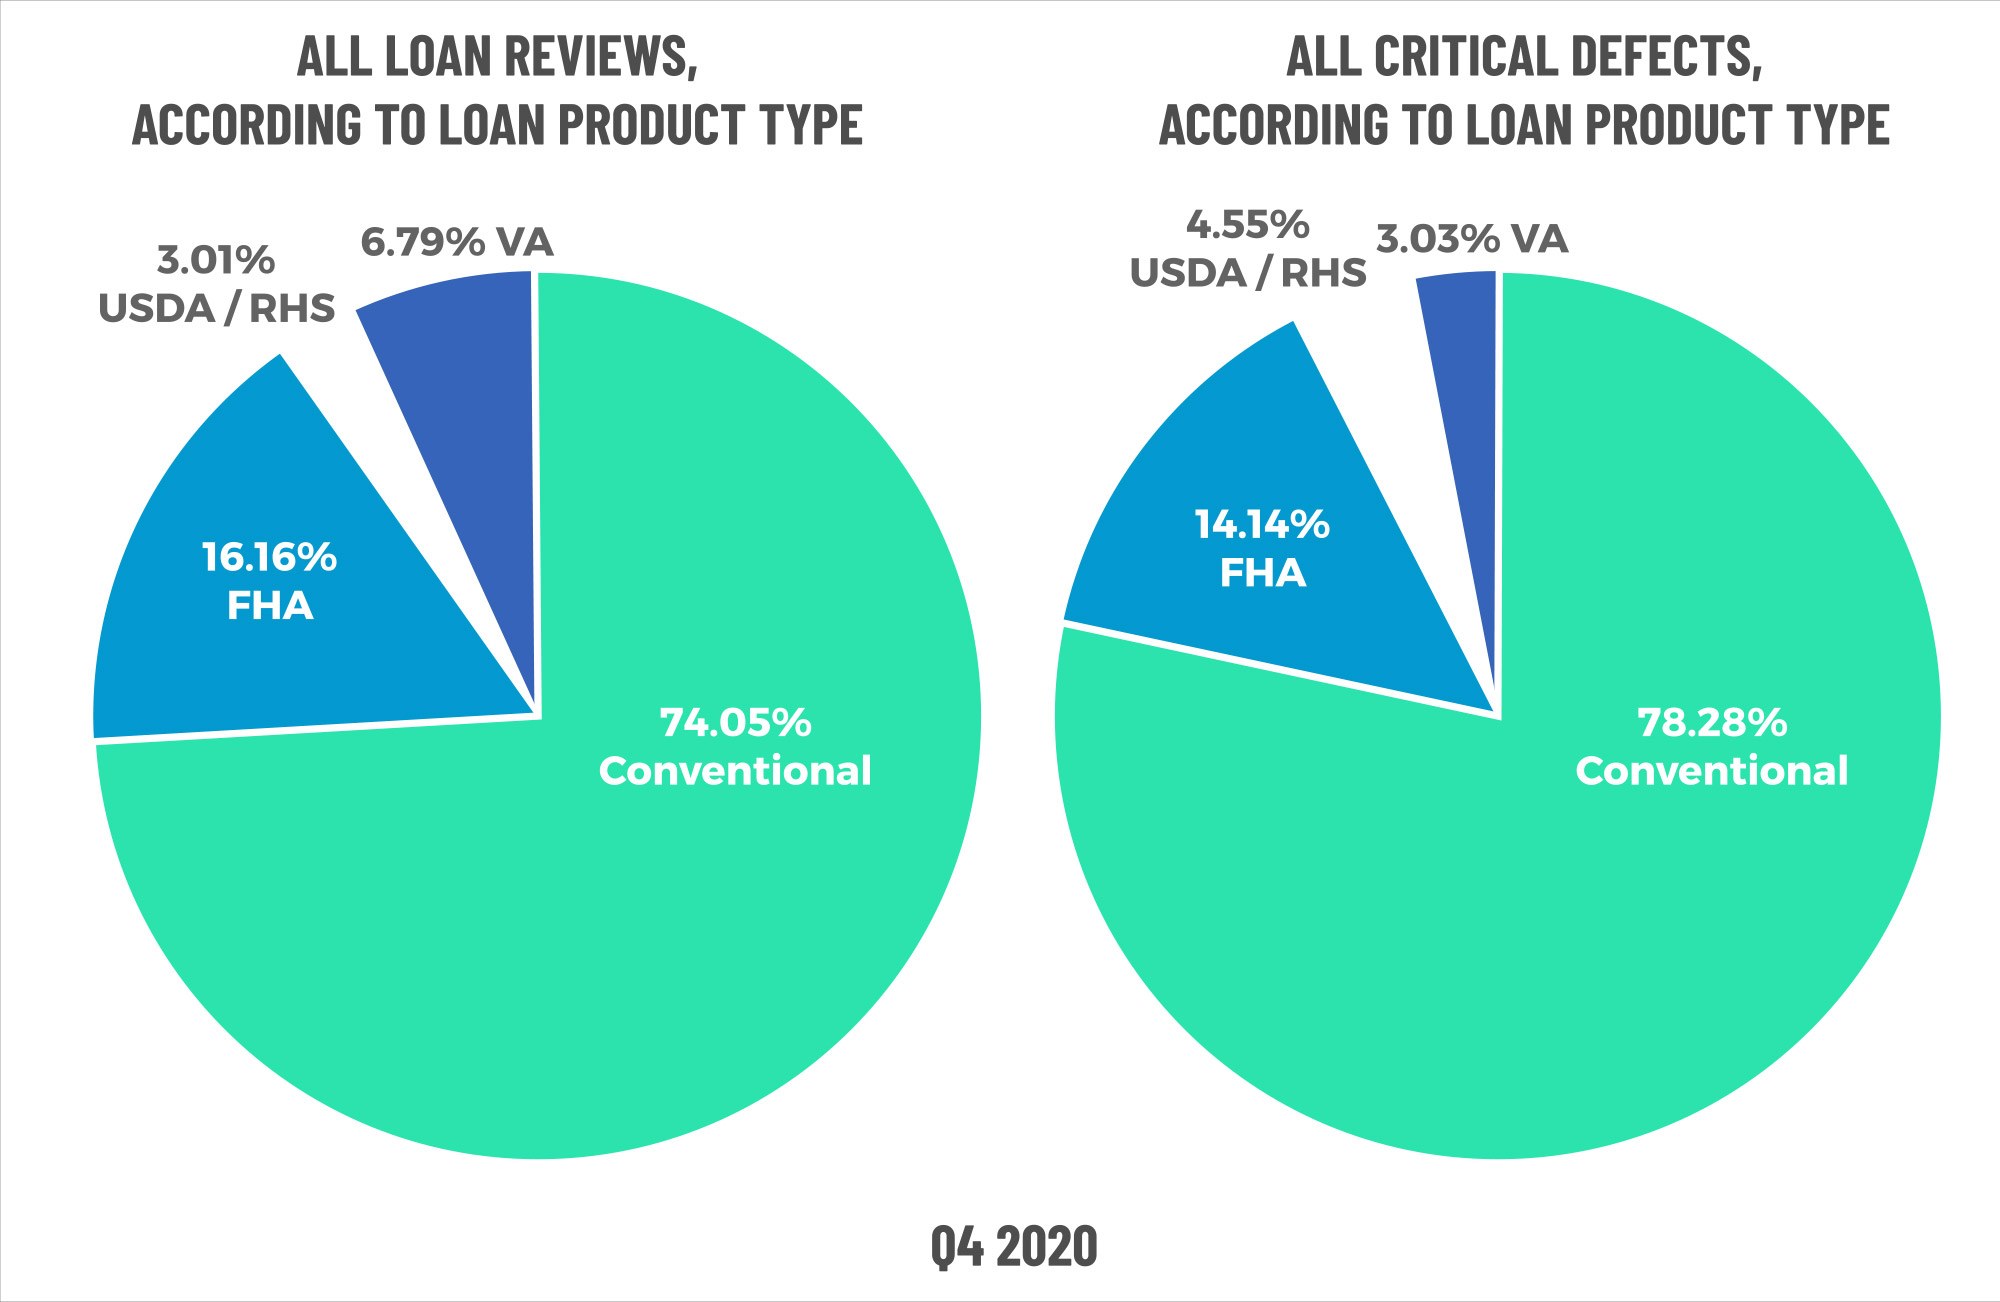
Figure 8 displays the loans reviewed and critical defects by loan type for Q4 2020.
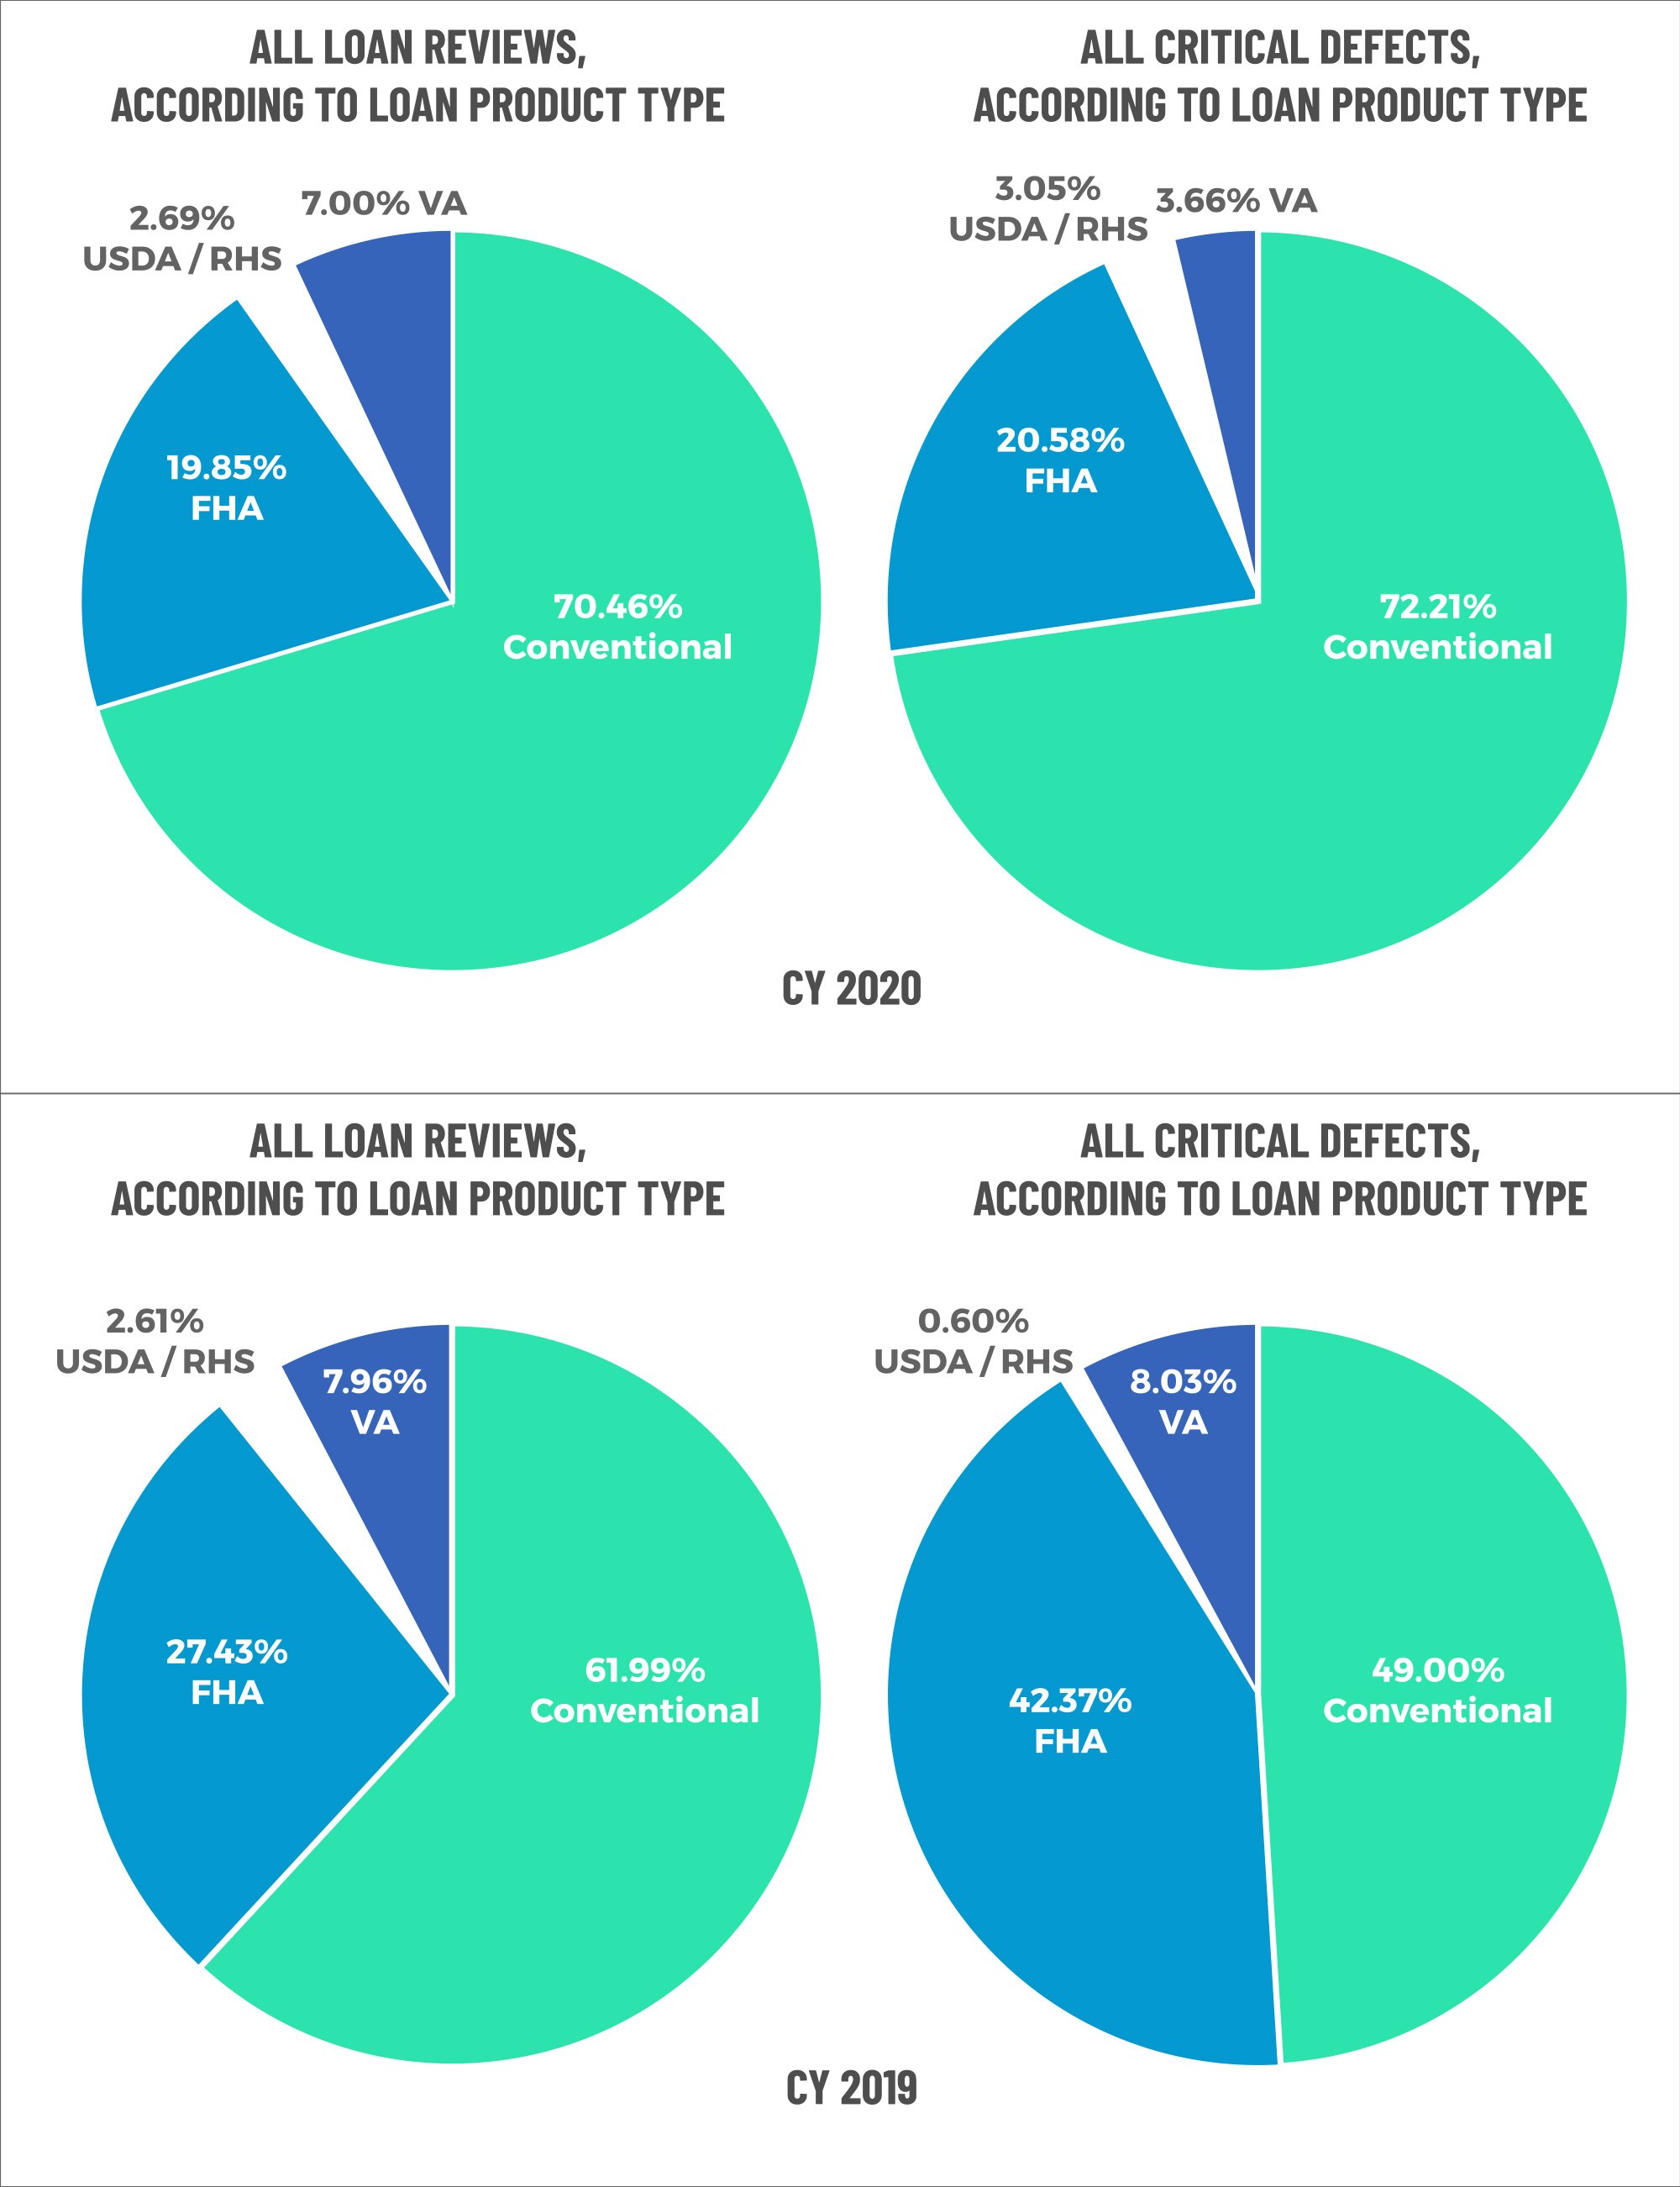
Figure 9 displays the loans reviewed and critical defects by loan type for CY 2020 compared to CY 2019.
Early Payment Defaults
Early Payment Defaults (EPDs) increased to 126% over pre-pandemic levels through the end of Q1 2021, reversing last quarters downturn. Despite the quarter-over-quarter increase, the Q1 2021 level is the second lowest since the pandemic began and provides some hope for the lessening of EPD risk.
It appears we are arriving at an inflection point for forbearances. It’s been said that EPDs are a proxy for the “no questions asked” forbearance protections given to borrowers under the CARES Act. On a positive note, EPD reviews are decreasing as we move further away from the pandemic, and the MBA reports that loans in forbearance have decreased for 14 straight weeks3. On the other hand, several troubling statistics remain. The same MBA report shows that only 11% of loans in forbearance are in the initial forbearance stage, and 83% are in a forbearance extension, with only 25% of borrowers in a forbearance planning to continue making their monthly payments while in forbearance. The data on what happens to loans at the end of forbearances will be crucial going forward, particularly throughout the summer of 2021. Black Knight, in its Mortgage Monitor Report4, reports that the May - July time period will see the most expirations of forbearance plans since the pandemic began. June is the high point, with an estimated 890,000 forbearance plans expiring so the end result (payoff, refinance, foreclosure, success loss mitigation plans, etc.) will be crucial to study in the light of EPDs and CARES Act forbearance plans in general.
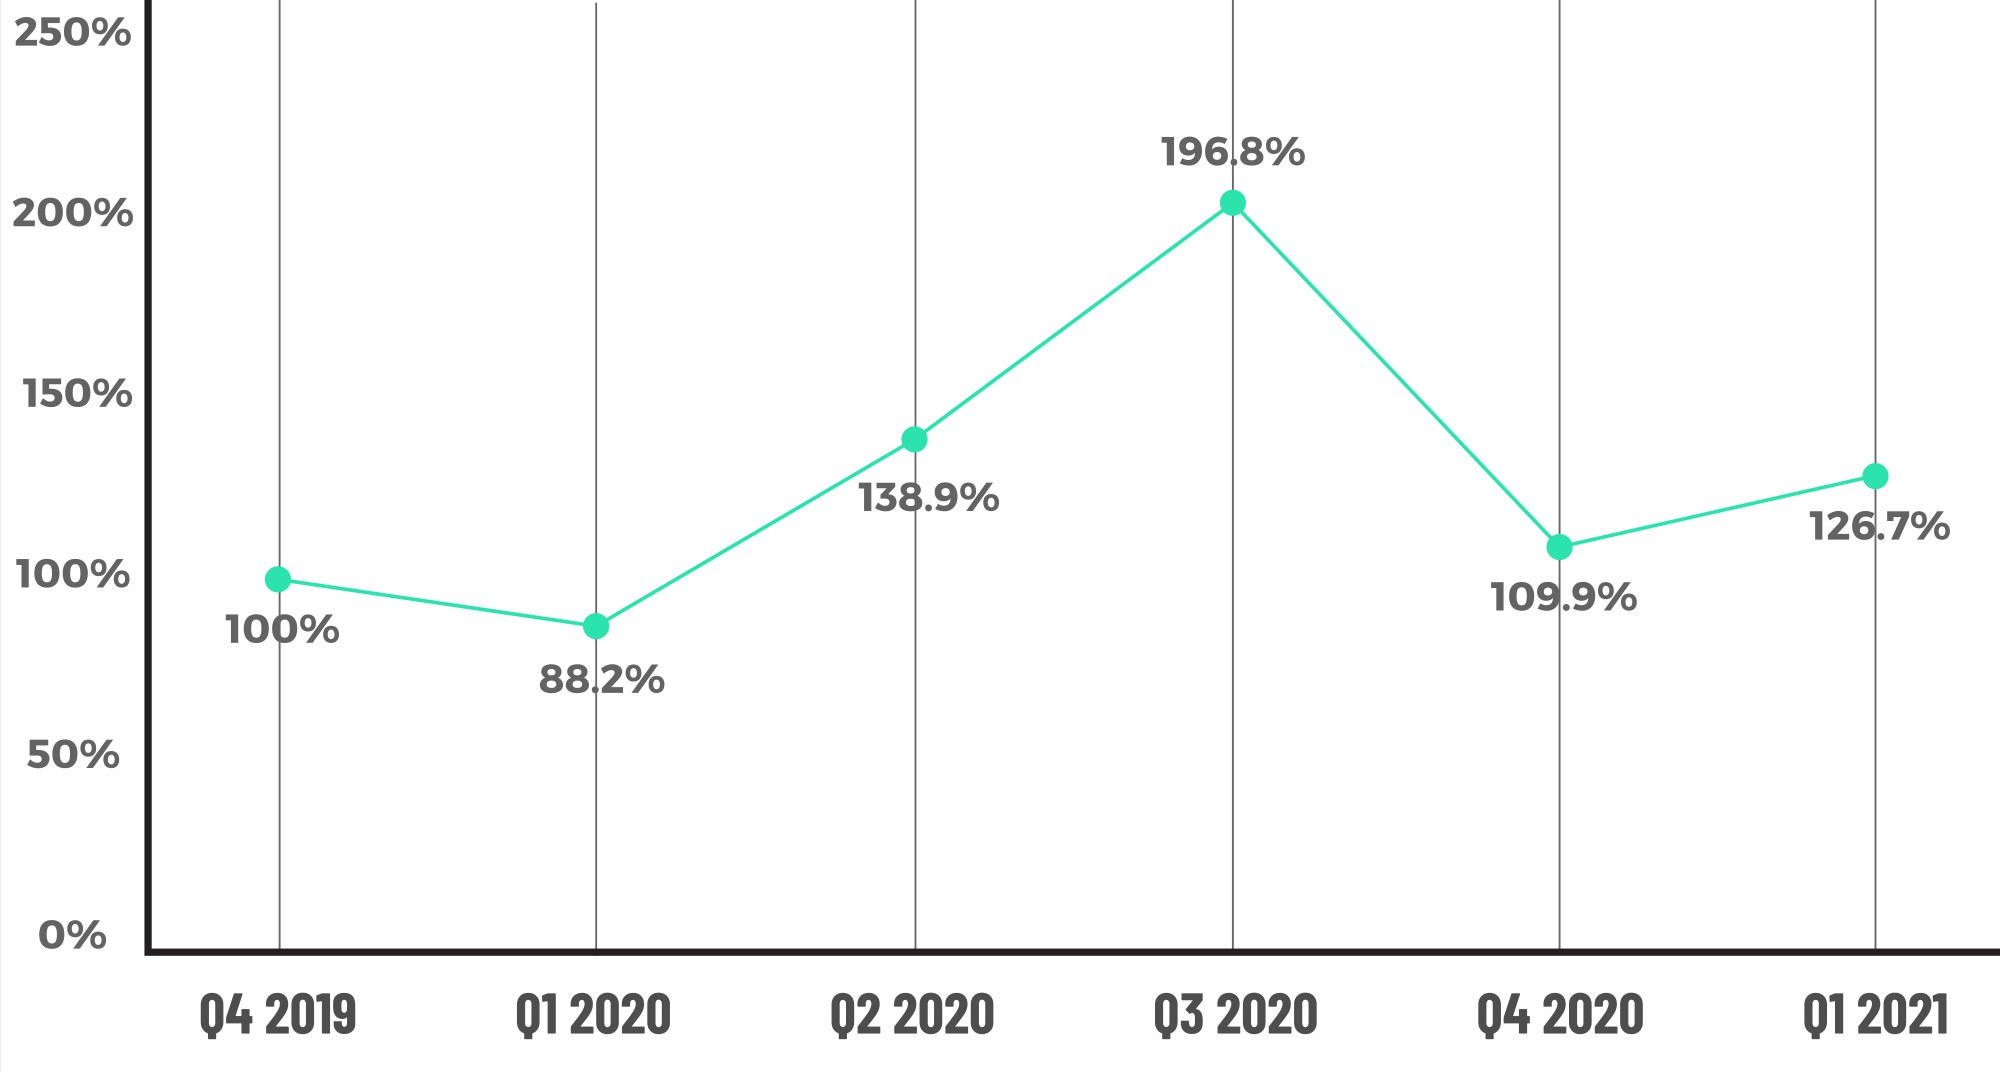
Figure 10 displays the EPD % by quarter from Q4 2019 to Q1 2021.
4 https://cdn.blackknightinc.com/wp-content/uploads/2021/04/BKI_MM_Mar2021_Report.pdf
Conclusion
While Q4’s defect rate was lower than Q3’s, the rate was higher this year than in years’ prior, and overall performance in CY 2020 was driven primarily by two bad quarters (Q3 and Q4). Those quarters happened to be the highest quarters on record for mortgage lending volumes. Thus, it’s evident that volumes and the resulting stress on the system contributed to worsening performance. Throw in a global pandemic that negatively impacted Q2 and Q3 2020, and you start to feel like things could have been worse.
A year can make all the difference. Today, in June 2021, large swaths of the economy are either rebounding or have surpassed pre-pandemic levels and interest rates are still relatively low. Employment opportunities have improved, and the current unemployment rate in June 2021 is less than half of what it was at the peak of the pandemic. Therefore, we believe defect rates will improve as a result.
Property appreciation and the overall housing market will likely be a key indicator of how our industry performs going forward. It is no secret that there is a shortage of available housing, which has certainly been made worse by the rising cost of construction materials, skilled labor shortages, and the pandemic-fueled phenomenon of a remote work environment. Some economists are reporting that the largest generation (Millennials) are starting to aggressively enter the housing market, but there simply is not enough supply of available housing (new and existing) to meet this demand.
Despite higher critical defect rates, we believe the overall outlook for the mortgage lending industry is strong. Interest rates are up slightly, but early indicators of refinance volumes point to only a moderation in volume, not a precipitous drop. To that point, the MBA reports an average net profit of $3,361 per loan in Q1 2021, down only slightly from Q4 2020’s $3,738 per loan. The same article reported profit representing 124 basis points of the average loan balance, which is still above the historical (2008-current) average of 55 basis points. So lending is still highly profitable, and default/loss risk, while increasing, remains extremely low.
As we are likely closer to the end of the latest refinance boom than the beginning, critical defect rates will be an area to which we will pay extremely close attention. Lenders should note lessons learned from prior periods of high volume where each loan becomes harder to close, and credit and other exceptions are made to get loans to closing. How lenders adapt to the challenges and changing environment in 2021 will ultimately determine whether or not the critical defect will improve.
About the ACES Mortgage QC Industry Trends Report
The ACES Mortgage QC Industry Trends Report represents a nationwide post-closing quality control analysis using data and findings derived from mortgage lenders utilizing the ACES Analytics benchmarking software.
This report provides an in-depth analysis of residential mortgage critical defects as re- ported during post-closing quality control audits. Data presented comprises net critical defects and is categorized in accordance with the Fannie Mae loan defect taxonomy.
About ACES
ACES Quality Management, formerly known as ACES Risk Management (ARMCO), is the leading provider of enterprise quality management and control software for the financial services industry. The nation’s most prominent lenders, servicers and financial institutions rely on ACES Quality Management & Control® Software to improve audit throughput and quality while controlling costs, including:
- 3 of the top 5 and more than 50% of the top 50 independent mortgage lenders;
- 7 of the top 10 loan servicers;
- 11 of the top 30 banks; and
- 1 of the top 3 credit unions in the USA.
Unlike other quality control platforms, only ACES delivers Flexible Audit Technology, which gives independent mortgage lenders and financial institutions the ability to easily manage and customize ACES to meet their business needs without having to rely on IT or other outside resources. Using a customer-centric approach, ACES clients get responsive support and access to our experts to maximize their investment.
For more information, visit www.acesquality.com or call 1-800-858-1598.
Media Contact: Lindsey Neal | DepthPR for ACES | (404) 549-9282 | lindsey@depthpr.com
View all reports