ACES’ Mortgage QC Industry Trends Report represents an analysis of nationwide quality control findings based on data derived from the ACES Quality Management & Control Software.
Executive Summary
QC Industry Trends – Overview
QC Industry Trends – by Category
QC Industry Trends – by Loan Purpose
QC Industry Trends – by Loan Product Type
Economic Discussion
Conclusion
About this Report
Executive Summary
This report represents an analysis of post-closing quality control data derived from loan files analyzed by the ACES Quality Management and Control® benchmarking system during the fourth quarter of 2021 (Q4 2021) and the full calendar year 2021 (CY 2021). The report incorporates data from prior quarters and/or calendar years, where applicable.
Findings for the Q4 2021 Trends Report were based on post-closing quality control data from approximately 100,000 unique records. Loan audits selected by lenders for full file reviews served as the basis for all reviews and defect data evaluated for this report.
Defects are categorized using the Fannie Mae loan defect taxonomy. Data analysis for any given quarter does not begin until 90-days after the end of the quarter to allow lenders to complete the post-closing quality control cycle, resulting in a delay between the end of the quarter and data publication.
NOTE: A critical defect is defined as a defect that would result in the loan being uninsurable or ineligible for sale. The critical defect rate reflects the percentage of loans reviewed for which at least one critical defect was identified during the post-closing quality control review. All reported defects are net defects.
Summary of Findings
Defect rates rose slightly in Q4 2021 and could not put together back-to-back quarters of improvements in the rate. The overall critical defect rate rose from 1.87% last quarter to 1.95%, but looking at the year in totality, defect rates improved in 2021 compared to 2020. The data shows that, in Q4 2021, the industry is clearly out of the refinance cycle and in a period of transition. As such, lenders should re-double their efforts on the income components of underwriting. Given that Lenders’ origination departments are less profitable, servicing is generating as much buzz as origination, and the regulators are noticing.
Report highlights include the following findings:
- The overall critical defect crept higher in Q4 2021, up .08% to 1.95% (a change of 4% from the prior quarter) as lenders transitioned to a purchase-heavy lending environment.
- Declining volumes have helped stabilize lender processes, keeping defects at bay, but signs are starting to emerge that the credit box is widening in the hunt for volume.
- Income/Employment defects declined in overall share but remained the No. 1 most frequently cited issue. This is a concern as any pandemic-related income verification issues should have long been in the rearview mirror.
- Appraisal-related defects rose in Q4 2021 after being minimal throughout the last refinance cycle.
- Purchase review share was 20 points higher than refinances, dealing a death blow to refinance dominance for the near future.
- Conventional lending share crept down from the prior quarter and is now 8 points below the pandemic peak amid a mini resurgence in FHA lending.
- Pressing issues continue to challenge lenders, including the CFPB’s renewed focus on servicers.
QC Industry Trends – Overview
The critical defect rate for Q4 2021 came in at 1.95%, up 4% from the prior quarter’s rate of 1.87%. The slight increase in the defect rate continues a trend of volatility since the pandemic began in Q2 2020. It has been challenging to string together consecutive quarters of declining defect rates, but defects remain below the 2% threshold we were at for much of the pandemic.
For the full calendar year of 2021, elevated defect rates in Q1 and Q2 2021 drove the yearly average to 2.01% — the first time the average critical defect rate finished a calendar year above 2% since ACES began tracking in 2016. The defect rate was below that 2% threshold in the back half of 2021, but the lower rates were not enough to overcome the higher rates at the start of the year. Figure 2 below shows the defect rates for the totality of the pandemic and illustrates COVID’s effect on mortgage lending operations. The defect rate for 2020 and 2021 hovered around 2%, which is 15% higher than pre-pandemic levels. For context, the average yearly critical defect rate was 1.71% for CY 2019.
Regarding the lending environment in Q4, the average interest rate on a 30-year fixed-rate mortgage did cross a key threshold in Q4 2021. The average rate for the quarter was 3.08%1, up from 2.87% in Q3 2021. As interest rates rose, refinances and overall lending volume fell. Estimates put origination volume around $1 trillion in Q4, down ~10% from Q3’s volume of $1.16 trillion (e.g. the highest rate in three years). Refinance volumes generated most of the headlines, but according to ATTOM Data Solutions Q4 2021 report2, all three lending categories (purchase, refinance and equity lending) declined from Q3 to Q4. Current interest rates are nearly double the pandemic low, so we can expect more negative news on mortgage volumes in the coming quarters.
Declining volumes at the end of a refinance cycle tend to impact critical defect rates positively by reducing the capacity demands on lenders’ processes, thus making them more effective in catching errors. As volumes fall, however, defect rates tend to creep up as lenders take on more risk to help qualify borrowers — some of which have marginal profiles. Of course, lenders are free to make those decisions based on their own risk profile, and there’s nothing wrong with stretching the limits of your risk tolerance profile, but we do not necessarily believe that’s the case here. The reason for that is the environment that we were in during 2020 and 2021. Lenders were doing well, and volumes were exploding. So, we believe the higher defect rates over the past several years were due to volumes, staffing and COVID-related concerns.
It is difficult to project where the overall critical defect rates go from here. With current mortgage interest rates above 5% and volumes down significantly year-over-year, we are already seeing staffing changes, declines in profitability and M&A activity. All are very typical for this point in the purchase-refinance cycle.
1 http://www.freddiemac.com/pmms/
Critical Defect Rate by Quarter: Q1 2021 — Q4 2021
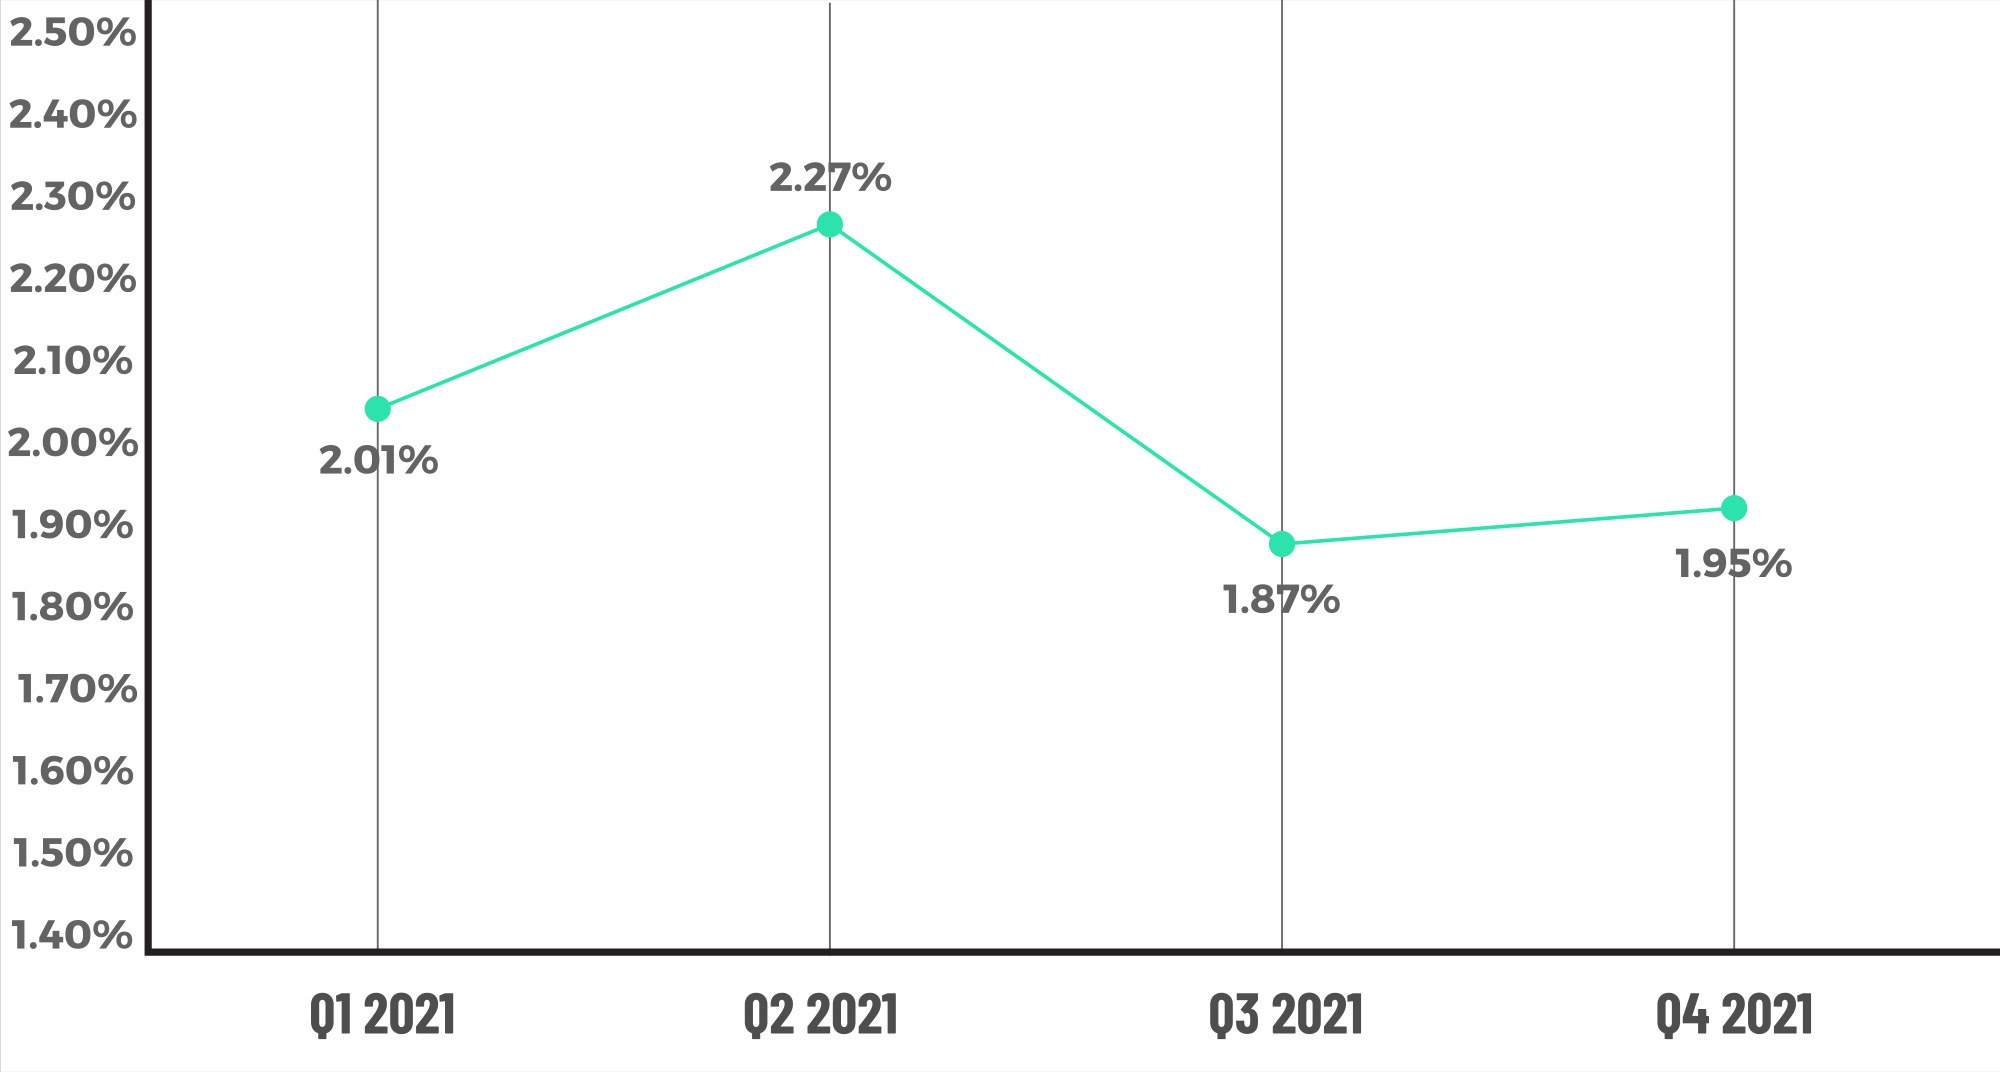
Figure 1 displays the percentage of loans with critical defects by quarter, for Q1 2021 through Q4 2021.
Critical Defect Rate by CY: 2020 — 2021
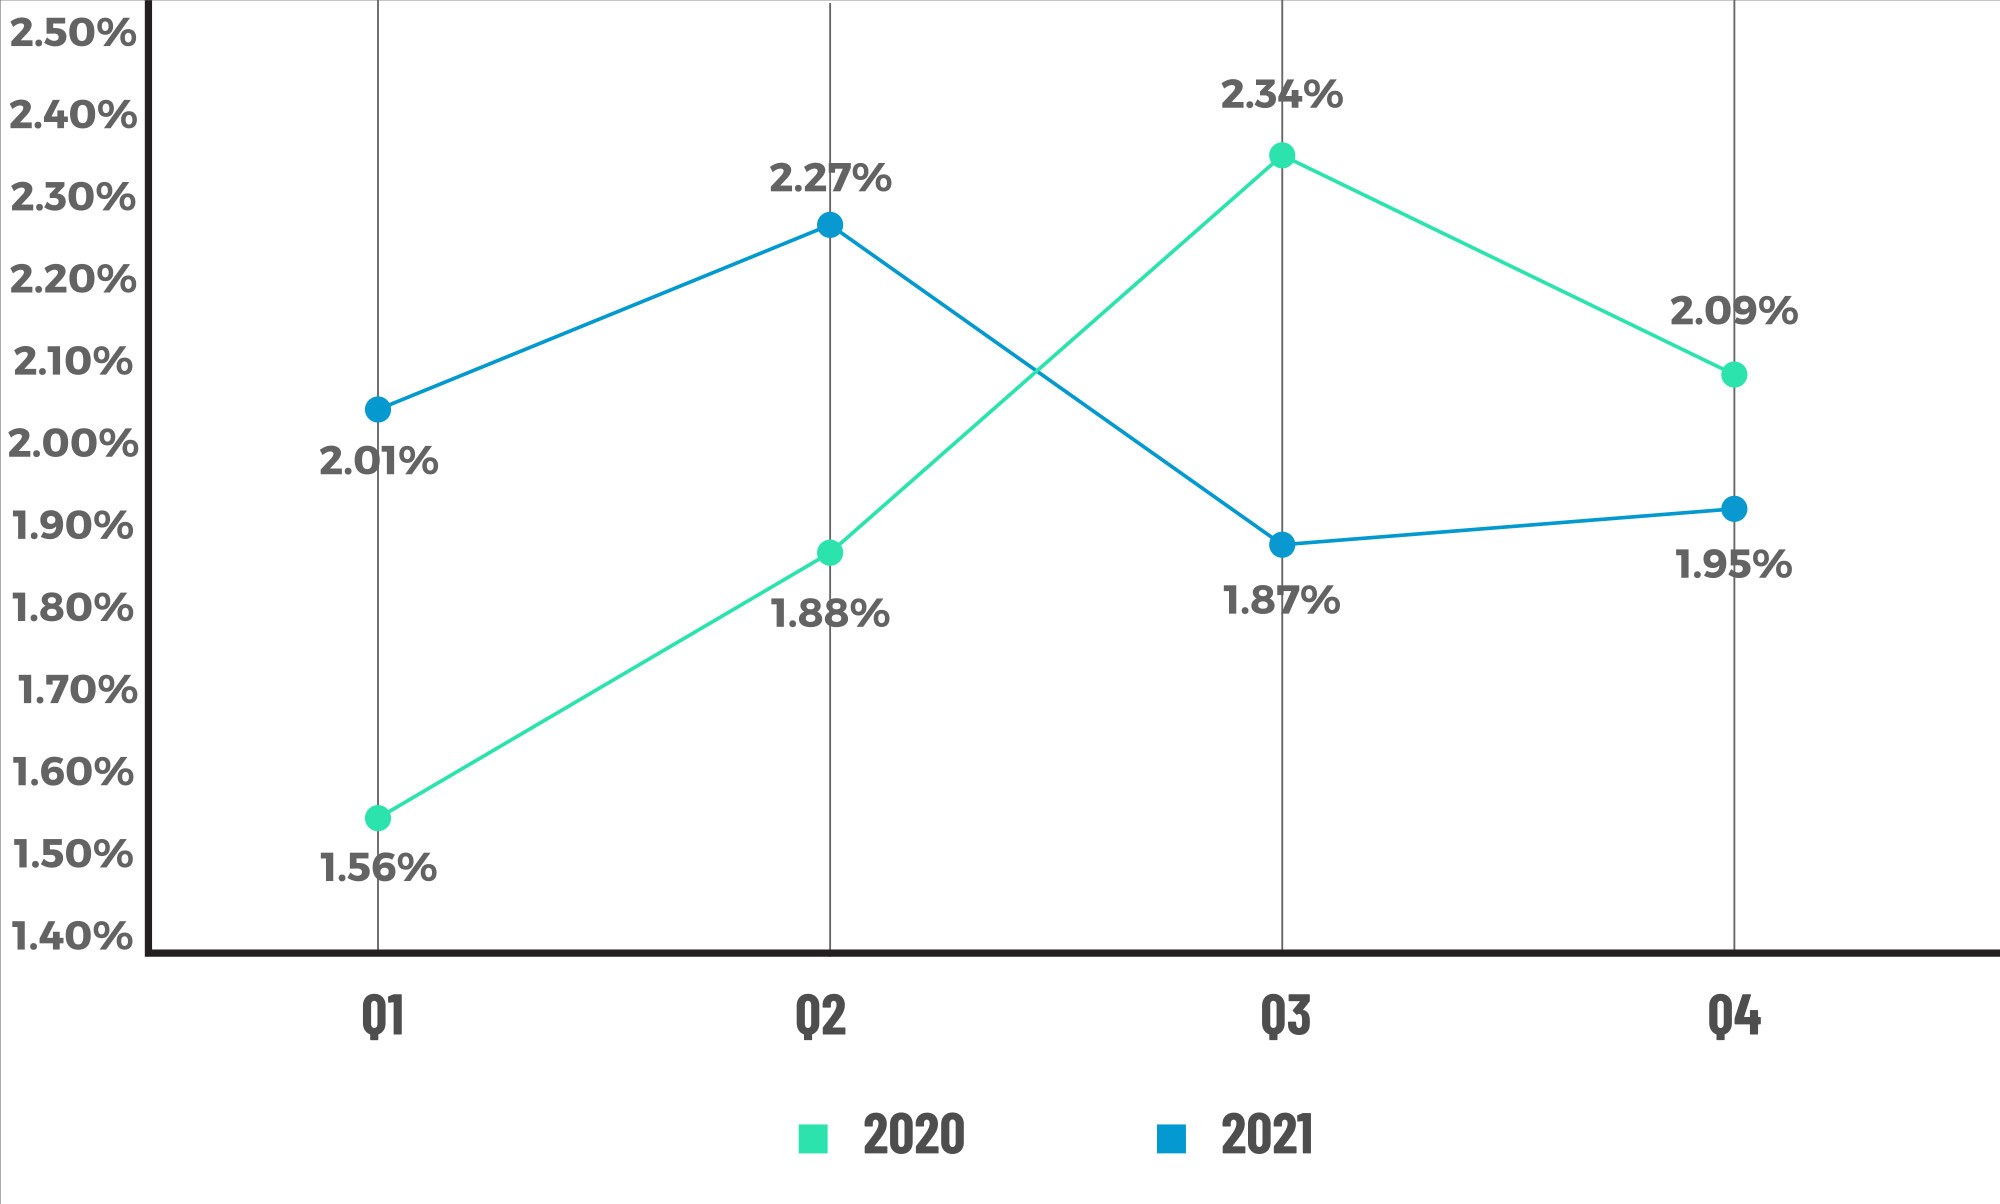
Figure 2 displays the percentage of loans with critical defects by quarter for each quarter in CY 2020 and CY 2021.
QC Industry Trends by Defect Category
Continuing a trend that has stood out since the early days of this latest refinance cycle, the Income/Employment category led all defects with a share of 26.63%. There was some improvement, with Income defects declining by 6.5% from Q3 2021’s share of 33.16%, but the full CY comparison shows Income/Employment defects increased 7% from CY 2020’s share of 23.95%, comprising 30.85% of all defects in CY 2021. It has now been more than two years since another category had the highest share of defects.
We also keep a close eye on the remaining three categories that give insight into borrower health. Of those, the Assets category had the second-largest share of defects at 16.08%, which was roughly flat with last quarter’s share of 16.58%. The Liabilities category ended Q4 2021 with a defect share of 10.05%, up from 8.02% in the prior quarter, and the Credit category made up 9.05% of defects in Q4 2021, which was a significant increase from last quarter’s 5.35%. In summary, of the so-called “Big 4” categories, one saw a decrease in share, one was flat, and two increased from the prior quarter.
In other categories, the Loan Documentation defect share nearly doubled in Q4 2021 to 14.57% from 7.49% in the prior quarter. The Appraisal category also doubled, albeit from a smaller base, comprising 7.04% of all defects in the quarter versus 2.67% in Q3 2021. Of the defect category shares that declined, the leader was the Legal/Compliance category, which declined from 9.63% in Q3 2021 to 3.52% in Q4 2021. The expiration of COVID-specific regulations at the state level no doubt impacted the defect share in that category, as several state-level regulations had run their course by Q4 2021.
Figure 6 below shows sub-categories that comprise the overall Income/Employment category. The income calculation and associated documentation requirements remain the single most complicated parts of qualifying borrowers and make up 85% of the defects in the overall category. In the early days of the pandemic, it made sense that income documentation was challenging to verify, with the country shutting down, employees moving to a remote work environment and long turn times for lenders resulting in documentation expiring before the loan could close. That we continue to see these issues is a bit of a concern and a red flag that lenders should investigate within their book of business.
Critical Defects by Fannie Mae Category: Q4 2021
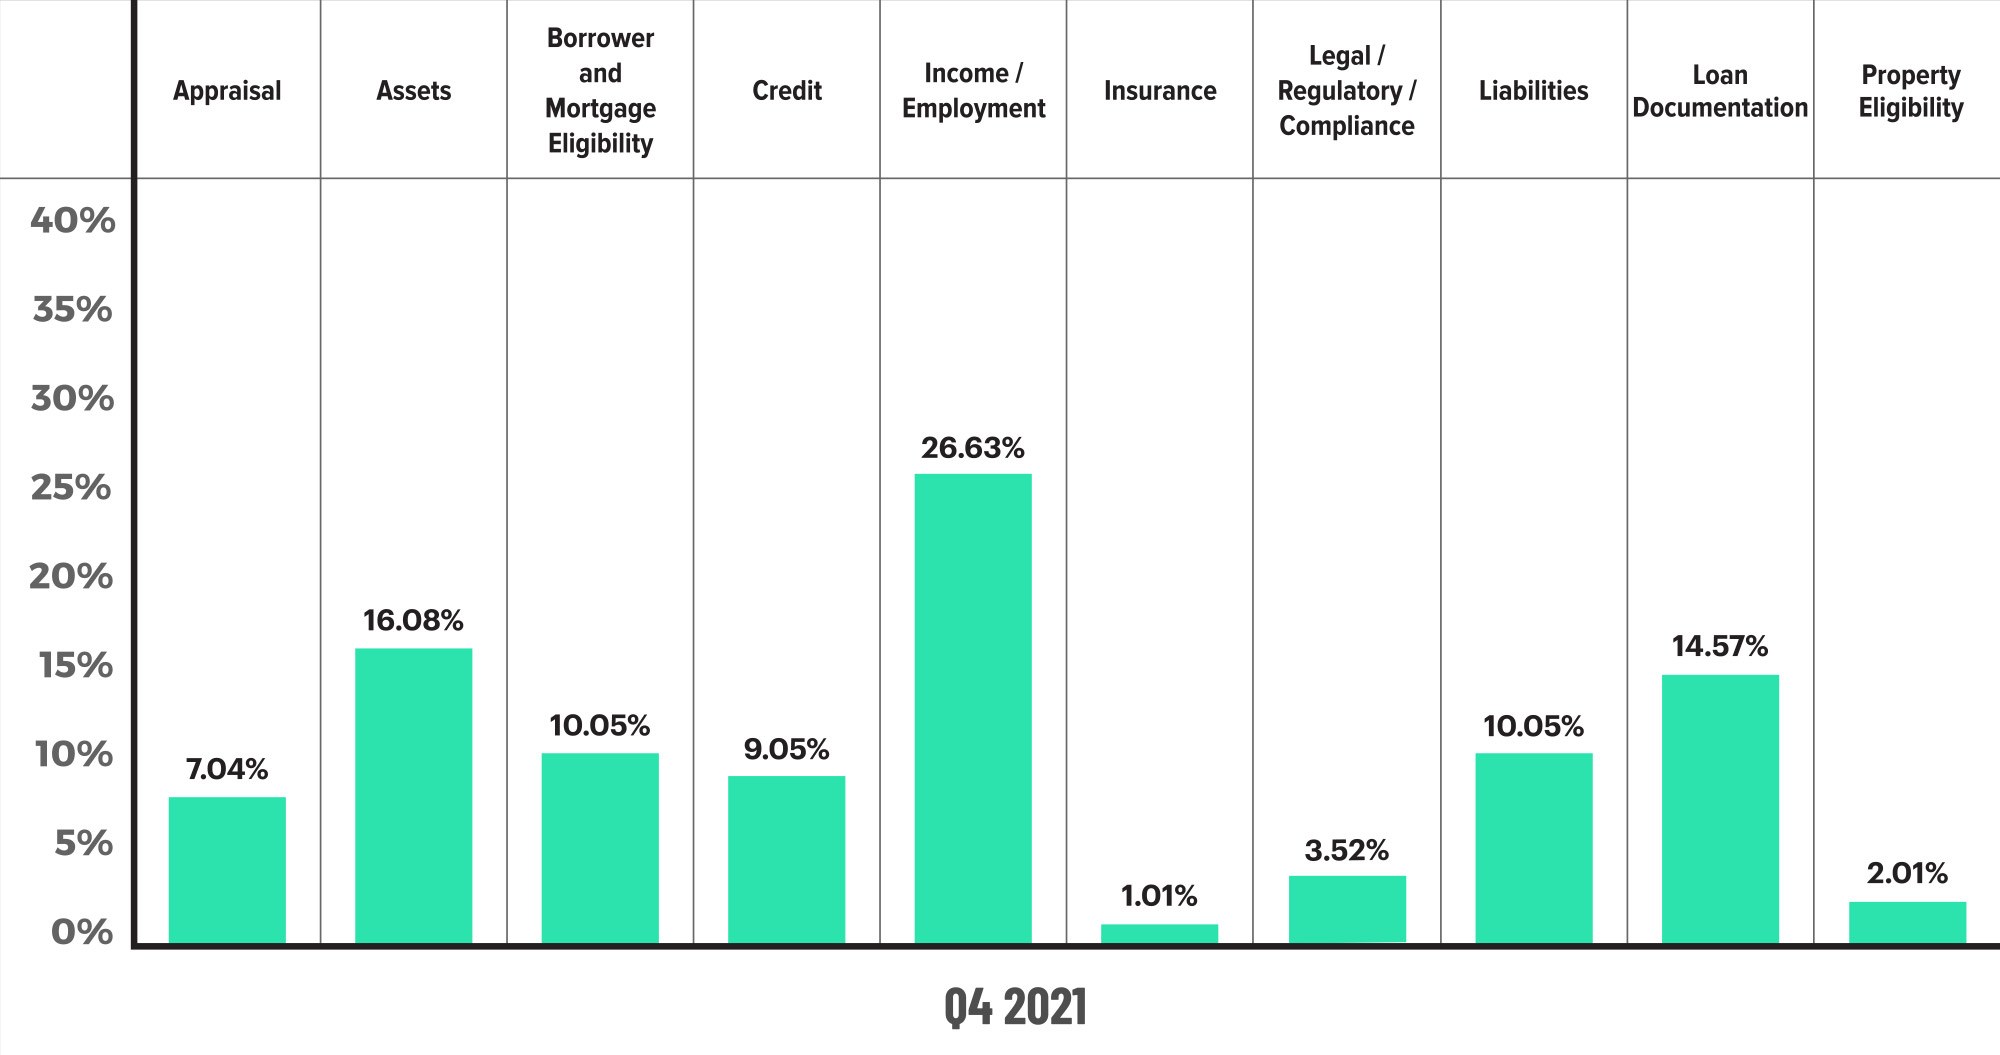
Figure 3 displays the dispersion of critical defects across Fannie Mae categories for Q4 2021.
Critical Defects by Fannie Mae Category: Q3 2021 vs. Q4 2021
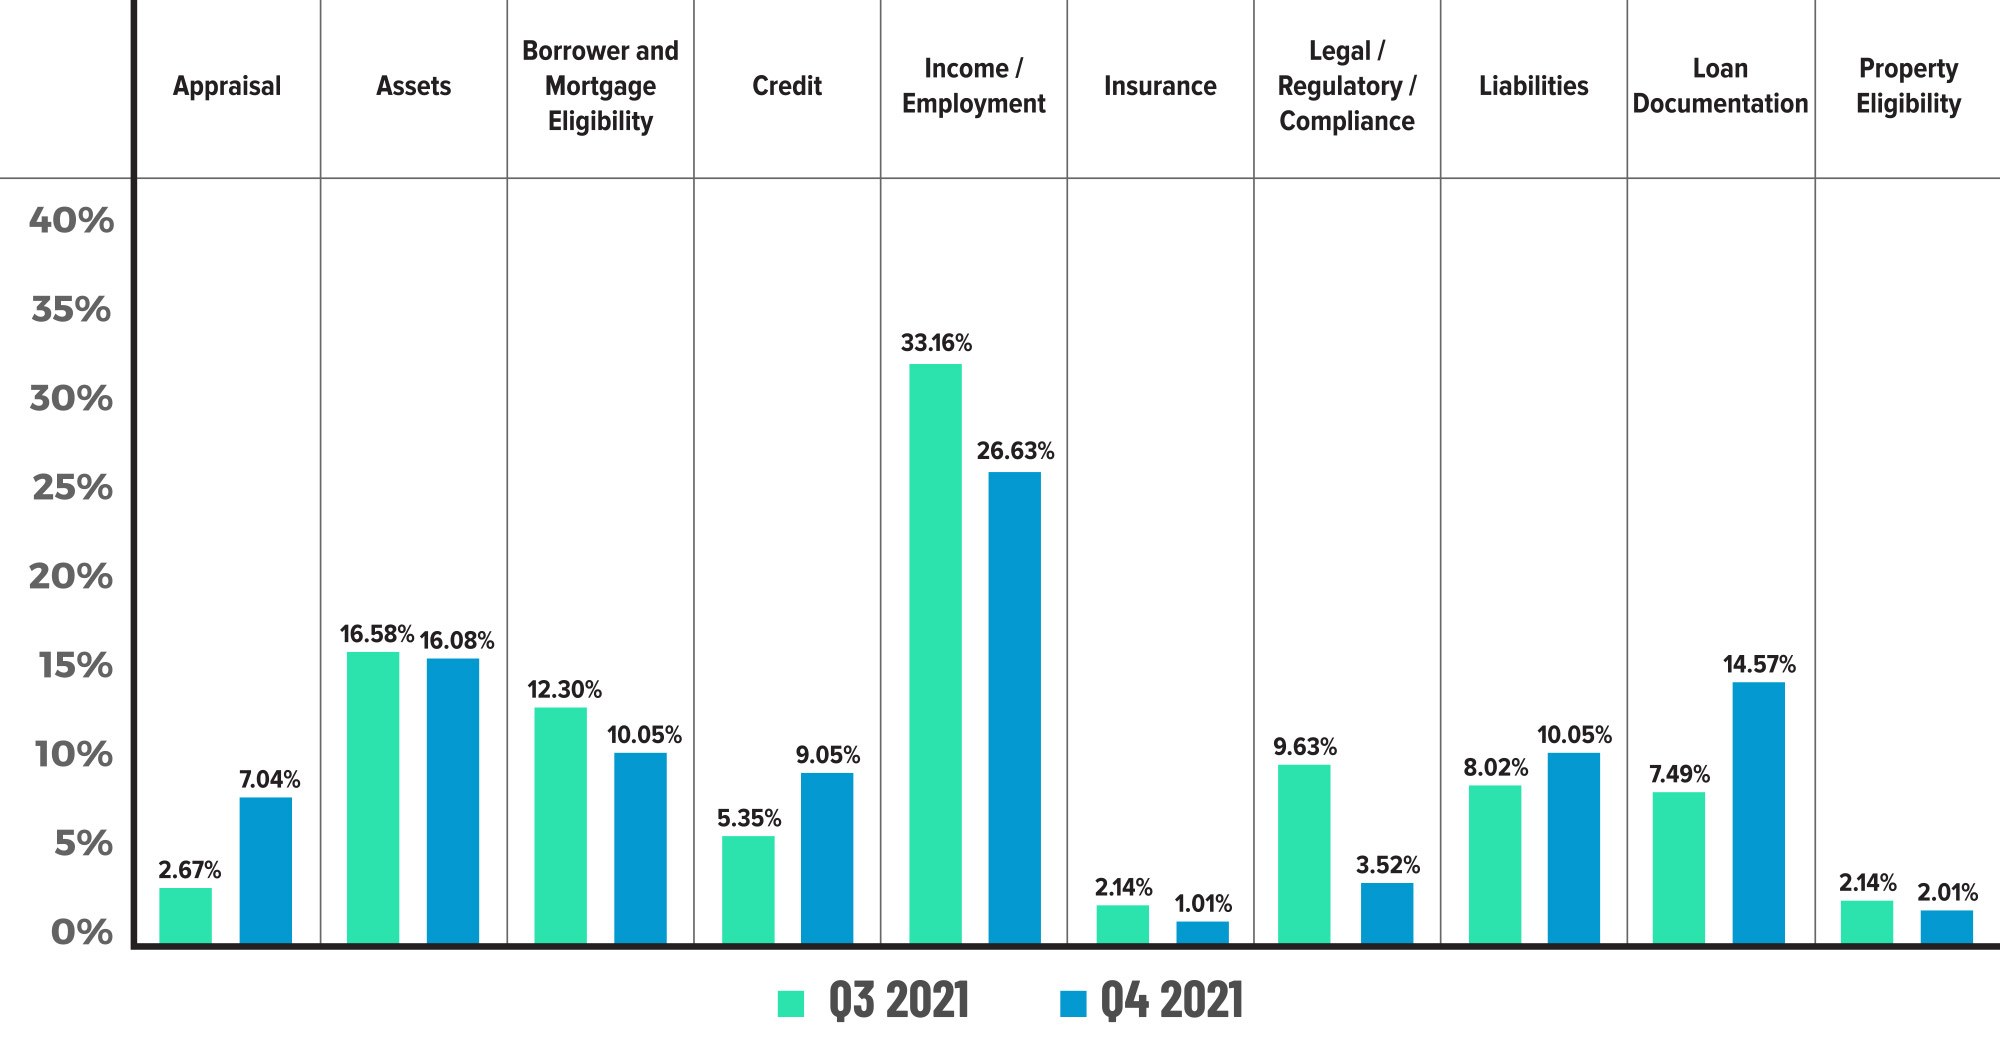
Figure 4 displays the critical defect rate by Fannie Mae category comparing Q3 2021 to Q4 2021.
Critical Defects by Fannie May Category: CY 2020 vs. CY 2021
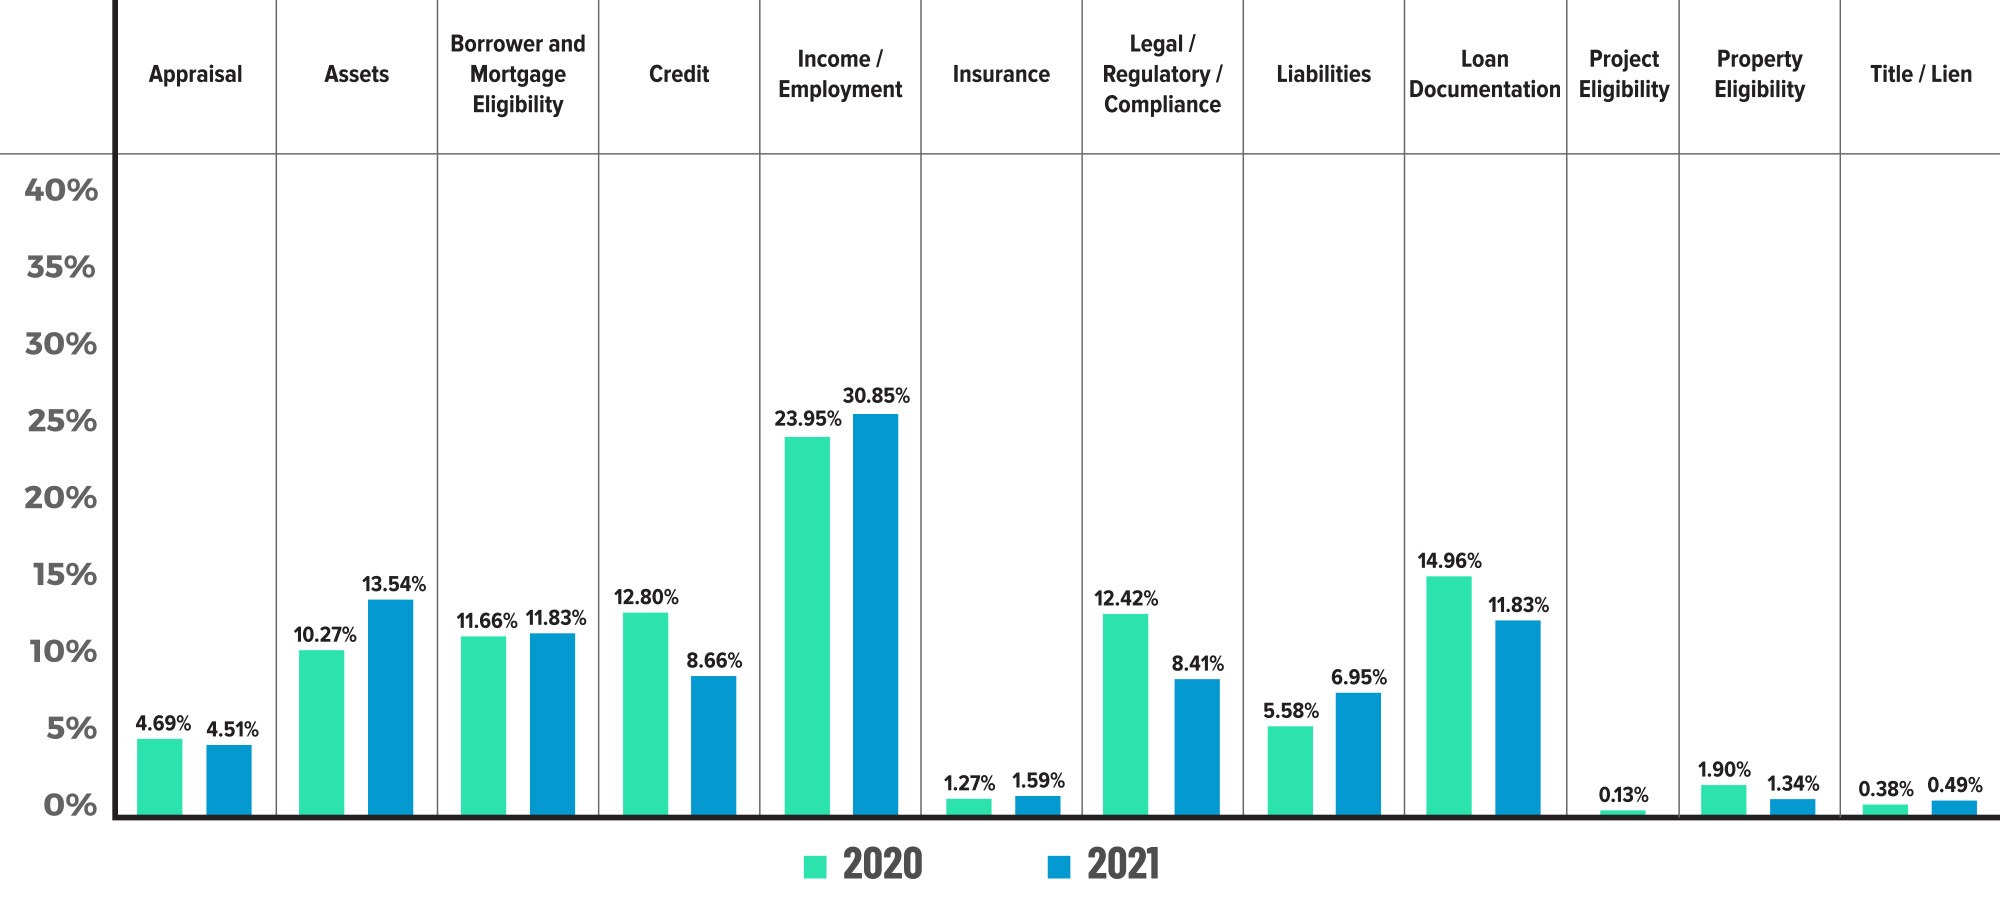
Figure 5 displays the critical defect rate by Fannie Mae category comparing CY 2020 to CY 2021.
Critical Defects by Fannie Mae Sub-Category: Q4 2021

Figure 6 displays sub-category information for Q4 2021 within the Assets, Credit, and Income/Employment categories.
QC Industry Trends by Loan Purpose
Purchases continued to pick up share in Q4 2021, ending the quarter with a review share of 60.03% and a 20% advantage over the refinance share of 39.97%. The purchase share was up 3% from Q3 2021’s share of 56.99%. For the full CY 2021, purchase and refinance shares were roughly 53.38% and 46.62%, respectively. Purchase reviews overtook refinances reviews in ACES’ QC data -- not necessarily overall market data -- in Q2 2021 and have not looked back. Prior to the pandemic, purchase share was between 50%-55%. The highest share before this current quarter (Q4 2021) was Q2 2019, when the share of purchases was 71.72%. It seems very likely that the 60% purchase share this quarter will continue to climb into early 2022 data with the noted increase in interest rates.
In Q4 2021, the percentage of defects was higher for purchases, comprising 56.78% of all defects by loan purpose. While this was higher than the refinance defect share of 43.22%, it was also higher than the review share of 53.38%, a scenario that indicates relatively worse performance. For the full calendar year, we get much closer to “defect parity” for both purchase and refinance, meaning that review shares are roughly equal to the corresponding defect share.
We believe that the trends in this dataset are likely to continue. Purchase should maintain, if not increase, its review share, and we believe any perceived degradation in the purchase defect performance is more of a reverting to historical norms. The pandemic upended this metric somewhat in that the share of refinance defects was higher than the review share, thus signifying underperformance on refinance loans. Refinance volumes and pressure on lenders to originate loans quickly at those mass volume amounts were the most likely cause.
Critical Defects by Loan Purpose: Q4 2021
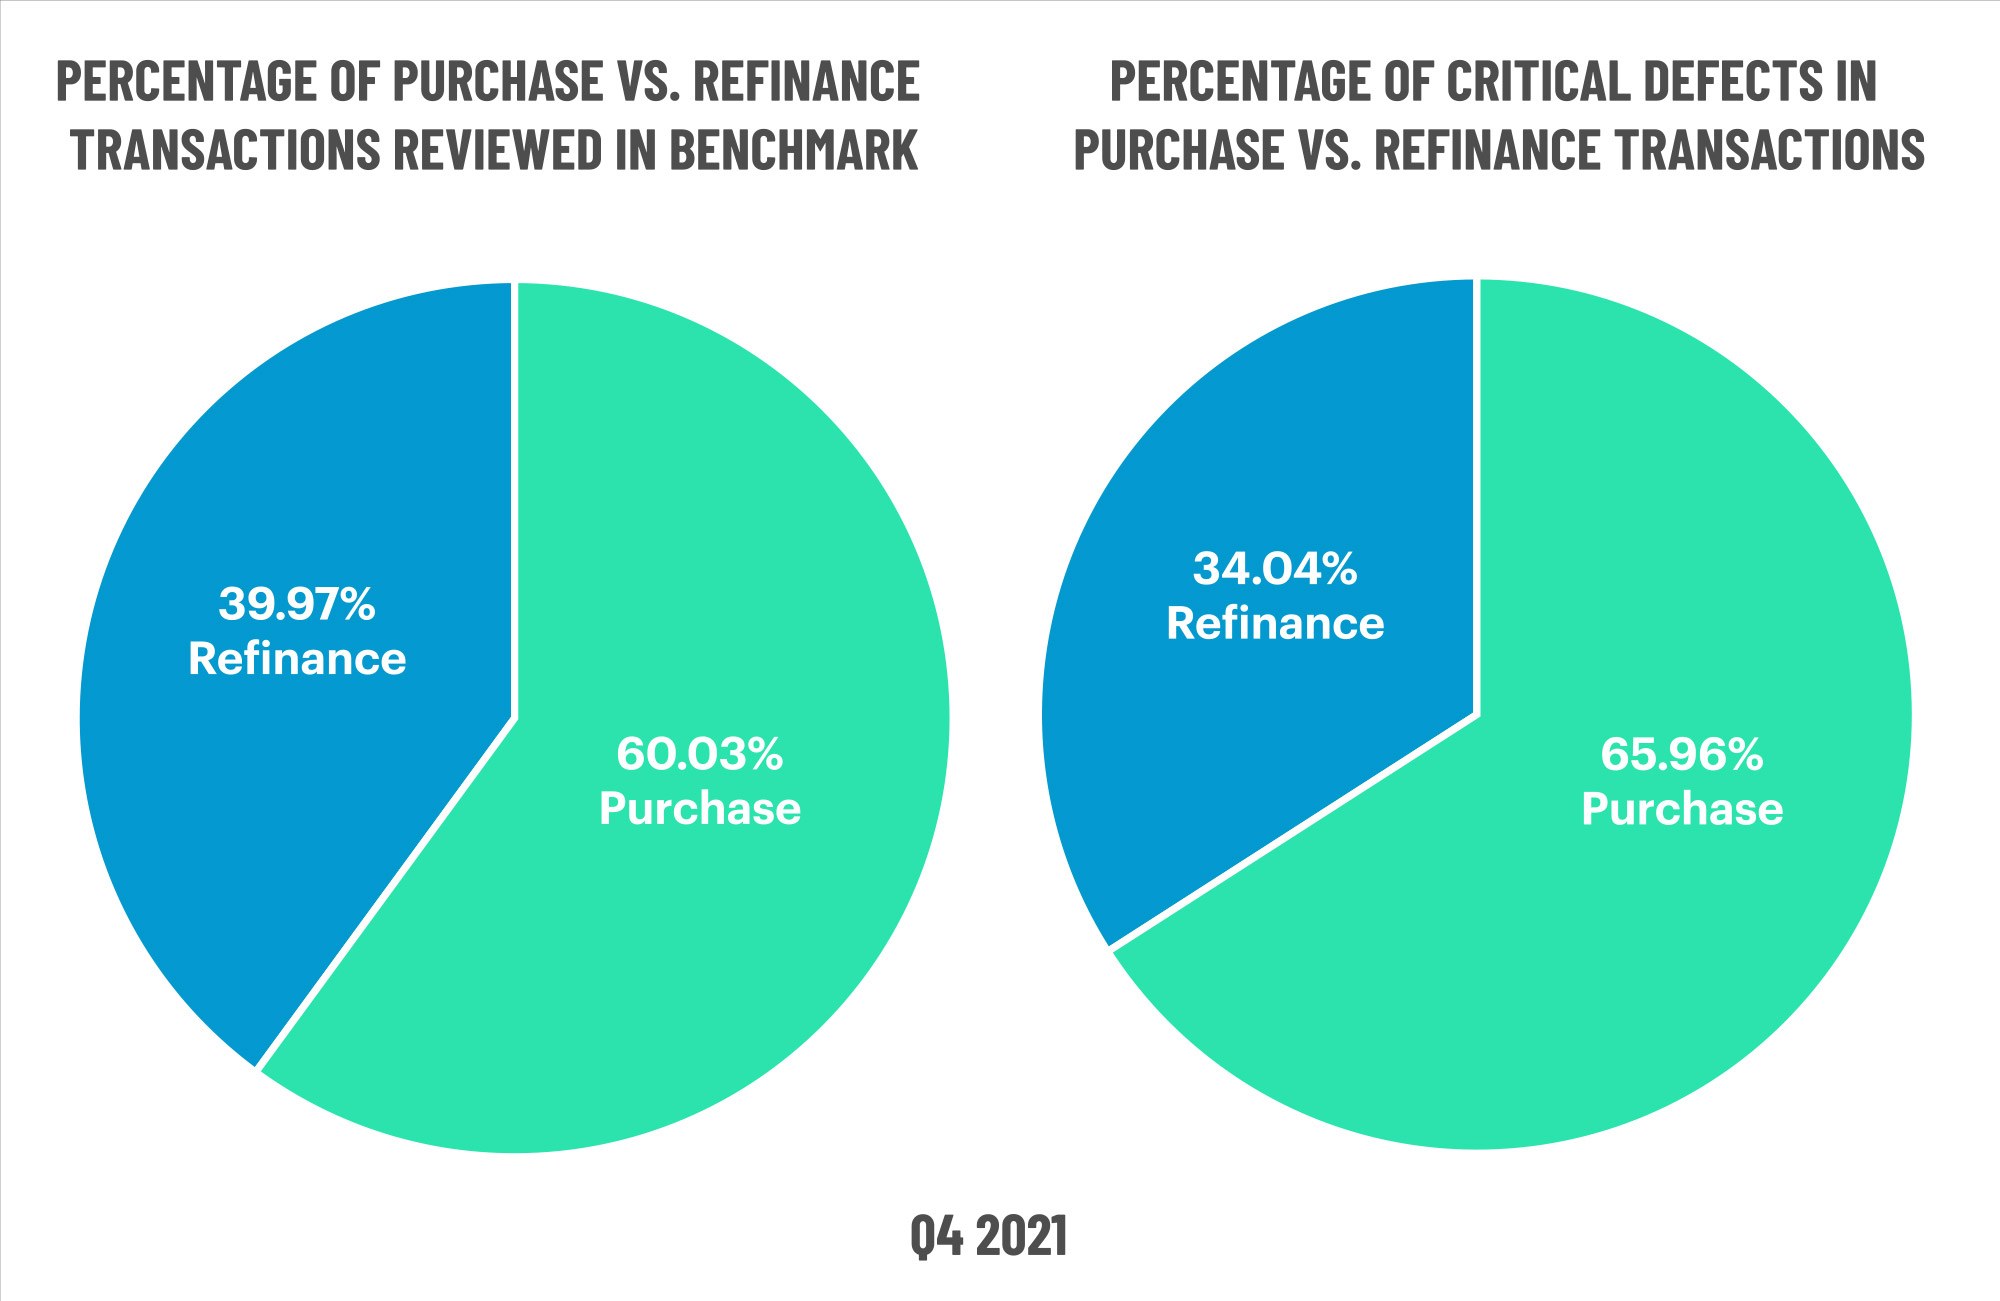
Figure 7 displays the loans reviewed and critical defects by loan purpose for Q4 2021.
Critical Defects by Loan Purpose: CY 2021

Figure 8 displays the loans reviewed and critical defects by loan purpose for CY 2021.
QC Industry Trends by Loan Product Type
Despite declining 1.5% from Q3 2021, conventional lending held its grip on review share by loan product type, ending Q4 2021 with a share of 66.31%. This continues a multi-quarter trend downward from the peak share for conventional loans of 74.05% reached in Q4 2020. Outside of the pandemic, the share of conventional loans typically was between 65% and 70%, so this is another area that seems to be reverting to historical norms.
FHA lending picked up 1.22% of the review share in Q4 2021 and ended the quarter at 22.11%, as compared to 20.89% in Q3 2021. The review share for VA and USDA lending was 8.82% and 2.75%, respectively. Both of those review shares were flat from the prior quarter. On the performance side, the significant change in Q4 2021 was in the positive defect performance of the conventional loans. Conventional loans had a defect share of 45.39%, down significantly from last quarter’s defect share of 53.79%. Historically, the share of defects on conventional loans was ~10% points lower than the review share. In Q4 2021, the defect spread was -21%, signifying strong performance.
That strong performance on conventional loans seemingly came at the expense of FHA lending, with review share at 22.11%, and defect share at 35.46%. With a defect spread of +13.35%, it is clear that defects on FHA loans ticked up in Q4 2021. We expect the full CY 2022 to look more like 2019 than the pandemic years of 2020 and 2021. This means lenders should pay special attention to their FHA loans, as it is likely that defect share there rises.
Critical Defects by Loan Product Type: Q4 2021

Figure 9 displays the loans reviewed and critical defects by loan type for Q4 2021.
Critical Defects by Loan Product Type: CY 2021
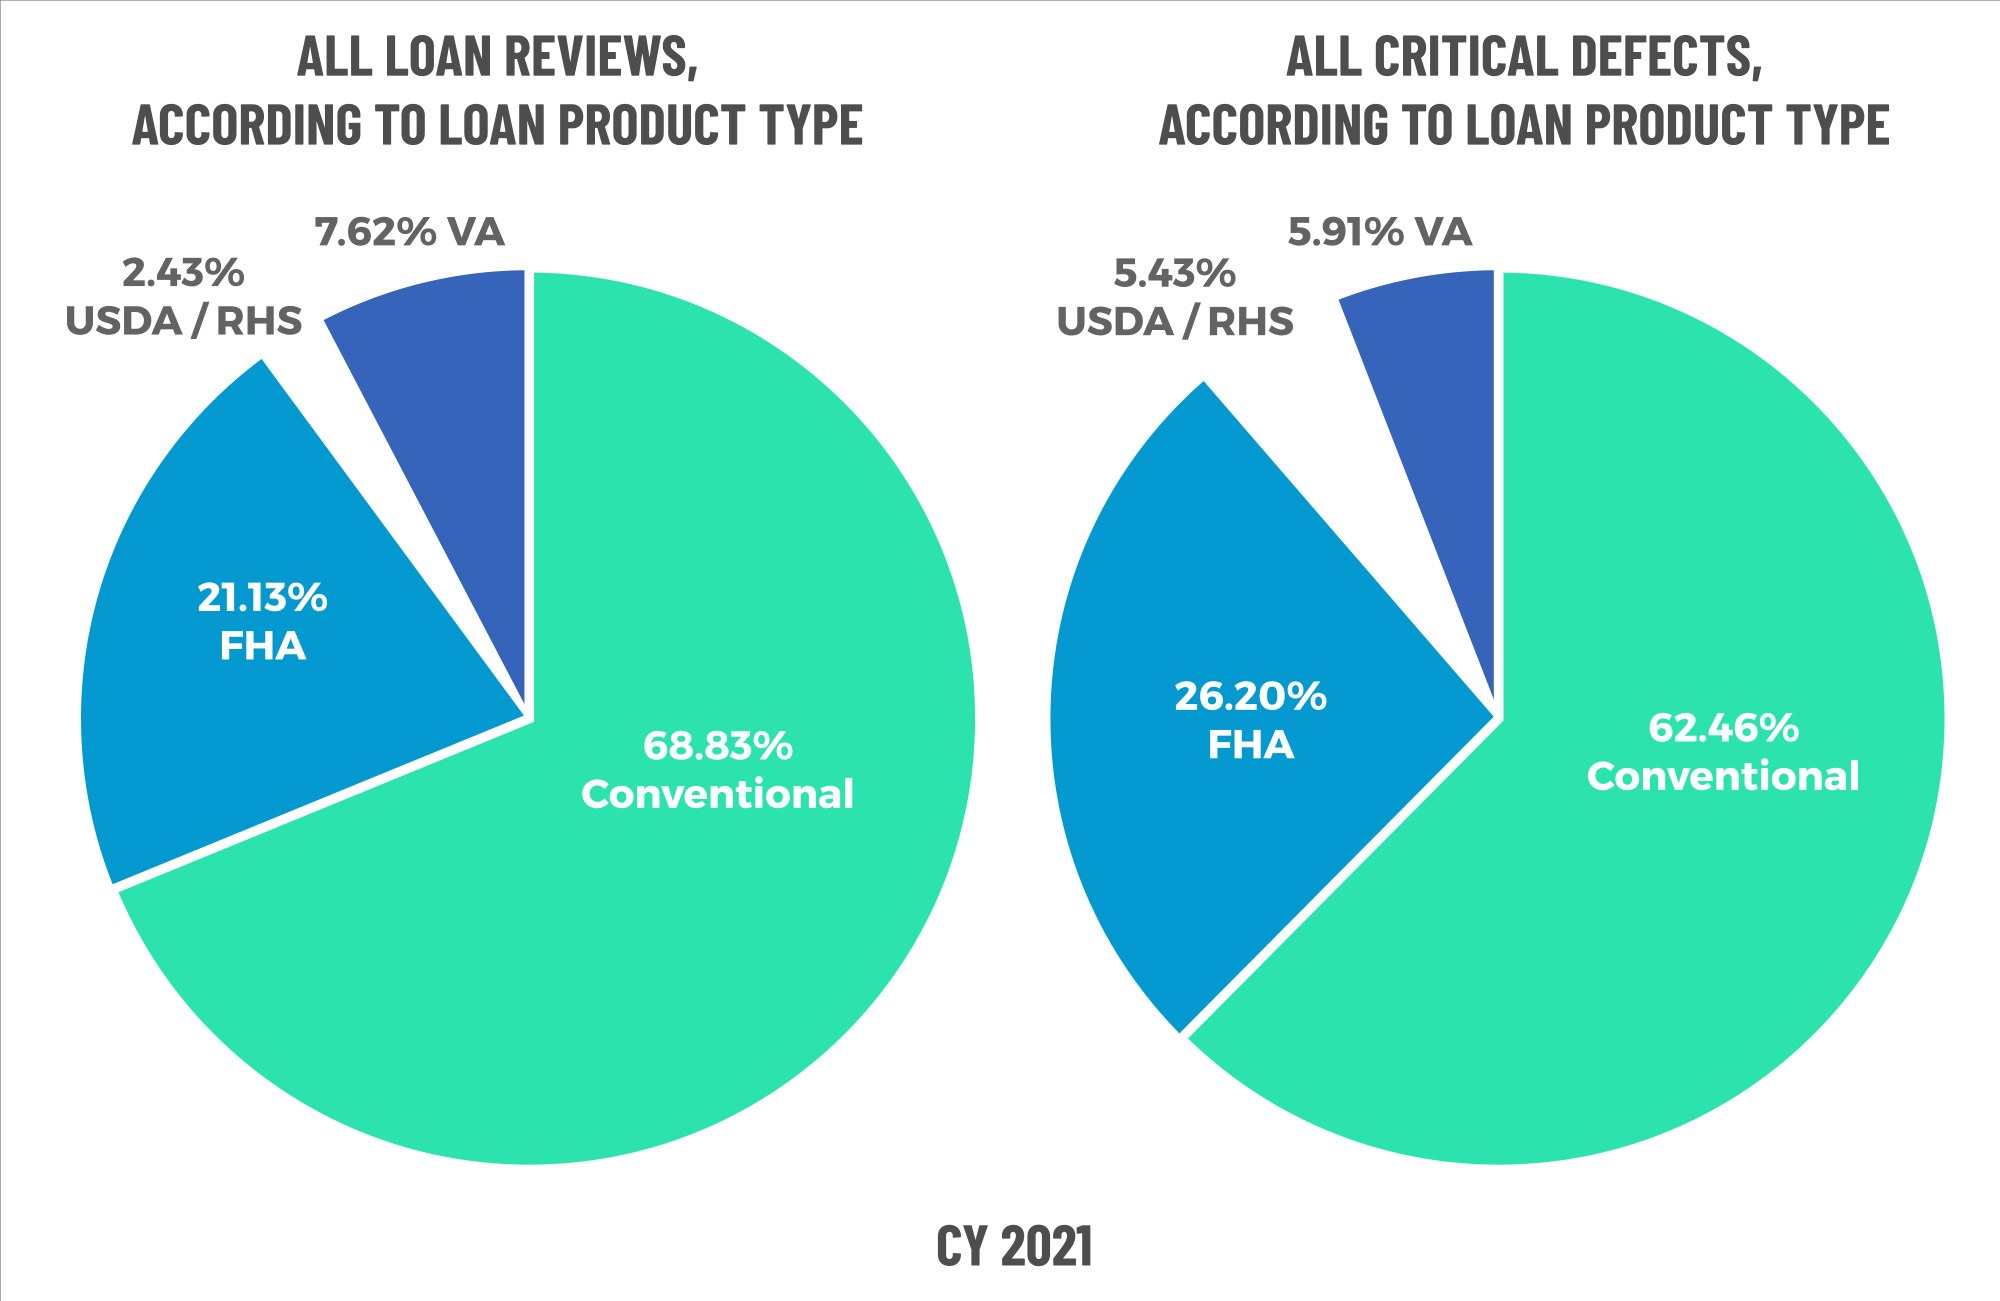
Figure 10 displays the loans reviewed and critical defects by loan type for CY 2021.
Economic Discussion
There is no doubt that 2020 and 2021 were two of the most challenging years on record – both in general and for the mortgage industry. Many of us are old enough to have lived through massive disruptions in our industry, such as the tragic attacks on our country on Sept. 11, 2001. Those attacks coincided with the bursting of the dot-com bubble, and just a few years later, we had the Credit Crisis of 2008 and the ensuing chaos. We had 7 or 8 years or so of relative calm before the COVID storm hit in 2020. At this point, we should be prepared for any catastrophe that comes our way, and be assured, they are coming.
Lender Profitability
Lots of time gets spent talking about the pressures homeowners face – rising costs all over the place, from interest rates to homeowners’ insurance to maintenance and repair costs. However, the environment is equally challenging for lenders. We looked at SEC filings for five large lenders and found that 2021 was a banner year for lenders, with volumes up 21% from what was also an excellent year for lenders in 2020. Yet, volume doesn’t tell the whole story.
One of the primary drivers of lender profitability is the gain-on-sale, or the percentage of the loan balance “above par” that a lender makes when selling the loan to an investor. In 2020, the lenders we looked at had an average gain-on-sale of 3.66%. That same number for 2021 was 2.36%, a full 1.3% lower. That decrease translates to a considerable amount of lost revenue. The impact is evident if you look at these same lenders’ revenue in just the origination segment. When origination volumes were lower in 2020, these five lenders generated $27 billion in origination revenue. Because of the negative impact of higher origination volumes on the gain-on-sale, those same lenders only generated $18 billion in origination revenue. Therefore, in an environment where volumes, staffing and other costs were up, revenue was down $9 billion (or 30%). Servicing is acting as an excellent hedge against the origination headwinds, but the gain-on-sale metric is a key one to watch going forward in evaluating the health of lenders.
Credit Standards and New Products
It should be no surprise that lenders will widen the credit box as refinance volumes dry up, and the most recent data available from the Agencies on their mortgage-backed securities supports this. The average credit score was 751, down from March. Debt-to-income ratios were 36%, and loan-to-value ratios were 82% -- both up from their levels in March. None of these metrics scream “red flag” at the moment, but they show that the margin for error is getting tighter for lenders. This means QC plans will have to be updated and new processes developed by risk managers. Pay attention to where the red flags are in the industry data as well as your own. Translate those learnings into new ways to sample and target your risk.
From a product perspective, the easier to underwrite products like rate/term refinances will be few and far between. In addition to purchase lending, cash-out refinances and HELOCs will be the primary sources of all refinances. Each borrower, therefore, gets incrementally harder to qualify. The most recent estimate is that homeowners have ~$450 billion in untapped equity. Many will still want cash but are locked into their low rate from 2020 or 2021. New products and guidelines will be necessary for these loans, including second liens, and we’re likely to see a pick-up in adjustable-rate mortgages, which have been depressed volume-wise in this last refinance cycle. It’s also possible that we will see the resurgence of investor overlays.
Final Word on Early Payment Defaults
In last quarter’s report, we stopped tracking early payment defaults (EPDs) because the data showed that EPDs were consistently trending below pre-pandemic levels and, therefore, the repurchase risk to lenders never materialized. We still firmly believe that, especially given how much has changed since the start of the pandemic. When the CARES Act was enacted, the official unemployment rate was 14%, meaning nearly 21 million Americans wanted work but couldn’t find it. That led to many borrowers opting for forbearance, which drove EPD numbers way up. No one knew how long unemployment would remain high, and the risk was that borrowers who opted for forbearance plans would be on the plan for such a long time that the compounding of missed payments would ultimately lead to defaults and/or foreclosures. The concern was that EPDs caused by CARES Act forbearance provisions could prompt investors to step up repurchase scrutiny and requests.
That didn’t happen for several reasons, but most especially because of what transpired with all those loans in forbearance. According to Black Knight, 92% of all borrowers that were on a forbearance plan have exited that plan. That same data shows that another 29% of exits have resulted in a payment-in-full – meaning that 82% of all forbearance exits have resulted in a positive outcome. Only 9% of loans that have exited forbearance remain delinquent, and roughly half of those loans are in active loss mitigation status. However, we still have 8% (or ~700,000) of loans in active forbearance.
Repurchase Risk = No / Regulatory Risk = Yes
Approximately 1.3 million loans are still in active forbearance or have not reached an outcome since exiting. The question remains whether these loans will work themselves out with the same level of success as the earliest loans to come out of forbearance. That’s hard to say, but the environment is considerably more challenging. The concern is that the housing and interest rate environment has changed at such a dramatic and rapid rate that the easy options aren’t as feasible. The earliest exits were in the first half of 2021 and in a much different interest rate environment where refinance (and paying off the loan in forbearance) was a viable option. With rates above 5%, refinancing is less attractive as an option. Also, while property appreciation has been strong in virtually every locale, selling the property and paying off upon forbearance exit is becoming less attractive as the overall cost of housing rises.
We’ve been able to hold off the pain thus far, but a tremendous amount of work remains to resolve all these cases -- work that needs to be done by servicers that have not processed loss mitigation plans and defaults with any kind of scale since the end of the Great Recession in 2010/2011. In addition, the CFPB has signaled renewed vigor in its oversight responsibilities, echoed in its statement, “Unprepared is Unacceptable.” In his April testimony in front of the Senate Banking Committee, CFPB Director Rohit Chopra’s mortgage-related comments were almost entirely focused on servicing. Thus, servicers should consider themselves “on notice” as far as regulators are concerned and shore up their compliance practices accordingly to meet this renewed level of scrutiny and oversight.
Conclusion
Despite a slight rise in the overall critical defect rate in Q4 2021, the entire year showed improved results over 2020. The numbers for Q1 2022 should be interesting, with the war in Ukraine starting towards the end of the quarter and the explosion in global inflation triggering U.S. mortgage interest rates to rise. Lenders have their work cut out for them, and the economic environment is less than friendly overall, making Quality Control and Compliance teams more important than ever.
About the ACES Mortgage QC Industry Trends Report
The ACES Mortgage QC Industry Trends Report represents a nationwide post-closing quality control analysis using data and findings derived from mortgage lenders utilizing the ACES Analytics benchmarking software.
This report provides an in-depth analysis of residential mortgage critical defects as reported during post-closing quality control audits. Data presented comprises net critical defects and is categorized in accordance with the Fannie Mae loan defect taxonomy.
About ACES
ACES Quality Management is the leading provider of enterprise quality management and control software for the financial services industry. The nation’s most prominent lenders, servicers and financial institutions rely on ACES Quality Management & Control® Software to improve audit throughput and quality while controlling costs, including:
- 4 of the top 5 and more than 50% of the top 50 independent mortgage lenders;
- 7 of the top 10 loan servicers;
- 11 of the top 30 banks; and
- 1 of the top 3 credit unions in the USA.
Unlike other quality control platforms, only ACES delivers Flexible Audit Technology, which gives independent mortgage lenders and financial institutions the ability to easily manage and customize ACES to meet their business needs without having to rely on IT or other outside resources. Using a customer-centric approach, ACES clients get responsive support and access to our experts to maximize their investment.
For more information, visit www.acesquality.com or call 1-800-858-1598.
Media Contact: Lindsey Neal | DepthPR for ACES | (404) 549-9282 | lindsey@depthpr.com
View all reports