ACES’ Mortgage QC Industry Trends Report represents an analysis of nationwide quality control findings based on data derived from the ACES Quality Management & Control Software.
Executive Summary
QC Industry Trends – Overview
QC Industry Trends – by Category
QC Industry Trends – by Loan Purpose
QC Industry Trends – by Loan Product Type
Economic Discussion
Conclusion
About this Report
Executive Summary
This report represents an analysis of post-closing quality control data derived from loan files analyzed by the ACES Quality Management and Control® benchmarking system during the fourth quarter of 2022 (Q4 2022) and the full calendar year 2022 (CY 2022). The report incorporates data from prior quarters and/or calendar years, where applicable.
Findings for the Q4 2022 Trends Report were based on quality control data from approximately 50,000 unique records. Volumes are essential to this analysis, and the included records reflect trends in overall origination volumes. However, data from additional lenders is added to this analysis once the lender's QC review seasoning within the ACES software reaches the 12-month bar. Therefore, the overall volume in the QC Trends Report does not precisely mirror the overall market. All reviews and defect data evaluated for this report were based on post-close loan audits selected by lenders for full file reviews.
Defects are categorized using the Fannie Mae loan defect taxonomy. Data analysis for any given quarter does not begin until 90 days after the end of the quarter to allow lenders to complete the post-closing quality control cycle, resulting in a delay between the end of the quarter and our publication of the data.
NOTE: A critical defect is defined as a defect that would result in the loan being uninsurable or ineligible for sale. The critical defect rate reflects the percentage of loans reviewed for which at least one critical defect was identified during the post-closing quality control review. All reported defects are net defects.
Summary of Findings
After two straight quarters of increase and reaching a report high in Q3 2022, the overall critical defect rate declined to 1.84% in Q4, bringing the rate back below the 2% threshold. Two of the four major underwriting categories saw growth in defect share, and increases were also seen in half of the categories included in this quarter's report. Some warning signals revealed themselves, as defect share rose for both conventional and FHA loans, while USDA and VA loan performance improved dramatically.
From an annual standpoint, the overall defect rate for CY 2022 was 2.07%, up 5% from CY 2021's rate of 1.97%. Defects increased year-over-year in three underwriting categories, as did six of the 11 total defect categories. While purchase defect share increased in 2022 as refi defect share declined, review share and defect share were, more or less, in alignment. USDA defect share dropped significantly in 2022, while VA defect share rose dramatically. Conventional and FHA defect shares also increased, albeit minimally, from 2021.
Report highlights include the following findings:
- The overall critical defect rate declined 25.5% over Q3 2022, ending the quarter at 1.84%.
- Thanks to two consecutive quarters of +2% defect rates, the overall rate for CY 2022 was 2.07%.
- Of the four major underwriting categories, Credit improved considerably over Q3, while Liabilities achieved a more modest improvement. Both Assets and Income/Employment increased significantly, reversing the multi-quarter trend of declining share in that high-profile defect category.
- Income/Employment remained the leading category of defects reported, with Assets and Borrower and Mortgage Eligibility completing the top three categories of defects cited.
- A sub-category analysis of the Assets and Income/Employment categories found documentation to be the leading driver of defects within these two categories.
- Appraisal defects also increased in Q4, ending another multi-quarter trend of decline.
- Purchase share remained high in Q4, with the industry achieving defect parity for the quarter.
- Despite declining in terms of review share, FHA defects increased for the second consecutive quarter, as did conventional loans. USDA and VA loan defects continued to improve.
QC Industry Trends – Overview
Q4's overall critical defect rate of 1.84% not only represents a trend in the right direction after two consecutive quarters of increase above the 2% threshold, but it was also the lowest defect rate of any quarter in 2022 and since Q3 2021. Anytime the overall defect rate is under 2% for the quarter or the year, that is something in which the industry should take pride. Empirically speaking, 2% has become the informal marking stick where below is acceptable and above becomes worrisome. In the current repurchase environment, defects become infinitely more expensive. Furthermore, coming off of a quarter (Q3 2022) with an abnormally high defect rate, this quarter's decline was especially heartening. Lenders are already facing deteriorating financial conditions so every loan with a critical defect becomes a potential financial problem lenders can ill afford to incur.
Looking at the year as a whole, 2022 was a much better year than the data may otherwise indicate. A comparison of the quarterly defect rates for 2021 and 2022 shows three out of the four quarters in 2022 were lower than the same quarter in 2021. Q3's record defect rate of nearly 2.5% is what threw off the average for the entire year. As noted in last quarter's report, the dramatic decline in origination volumes due to rising interest rates was the primary driver behind Q3's record-breaking defect rate. Once lenders adjusted to this major market shift, defect rates stabilized as anticipated.
What's also important to remember is that 2022 was an interesting year. In Q1, interest rates averaged 3.75% – certainly up from the record lows of the previous 18 months but still attractive enough to potential homebuyers1. However, Russia's invasion of Ukraine triggered massive economic uncertainty, and interest rates began to rise as a result.
While the most significant rate of change occurred in Q1 as rates increased 45% by quarter's end, it was crossing the 6% threshold in Q3 that really seemed to seize up the homebuying market. Q4 saw some stability, relatively speaking, and even a slight decline. Rates began the quarter at 6.66% and, after reaching an annual peak of 7.08% in late October and early November, settled at 6.42% by the end of December. Historically speaking, this is one of the most considerable changes in interest rates the industry has experienced over a single year. Thus, even being in survival mode, lenders seemed to stabilize their processes after struggling with 2021's sudden regulatory/agency changes and managed loan quality reasonably well. Entering 2023, QC groups should be on alert that production groups are under pressure to close deals, as those efforts could put additional stress on quality.
1 https://fred.stlouisfed.org/series/MORTGAGE30US
Critical Defect Rate by Quarter: Q1 2022 — Q4 2022
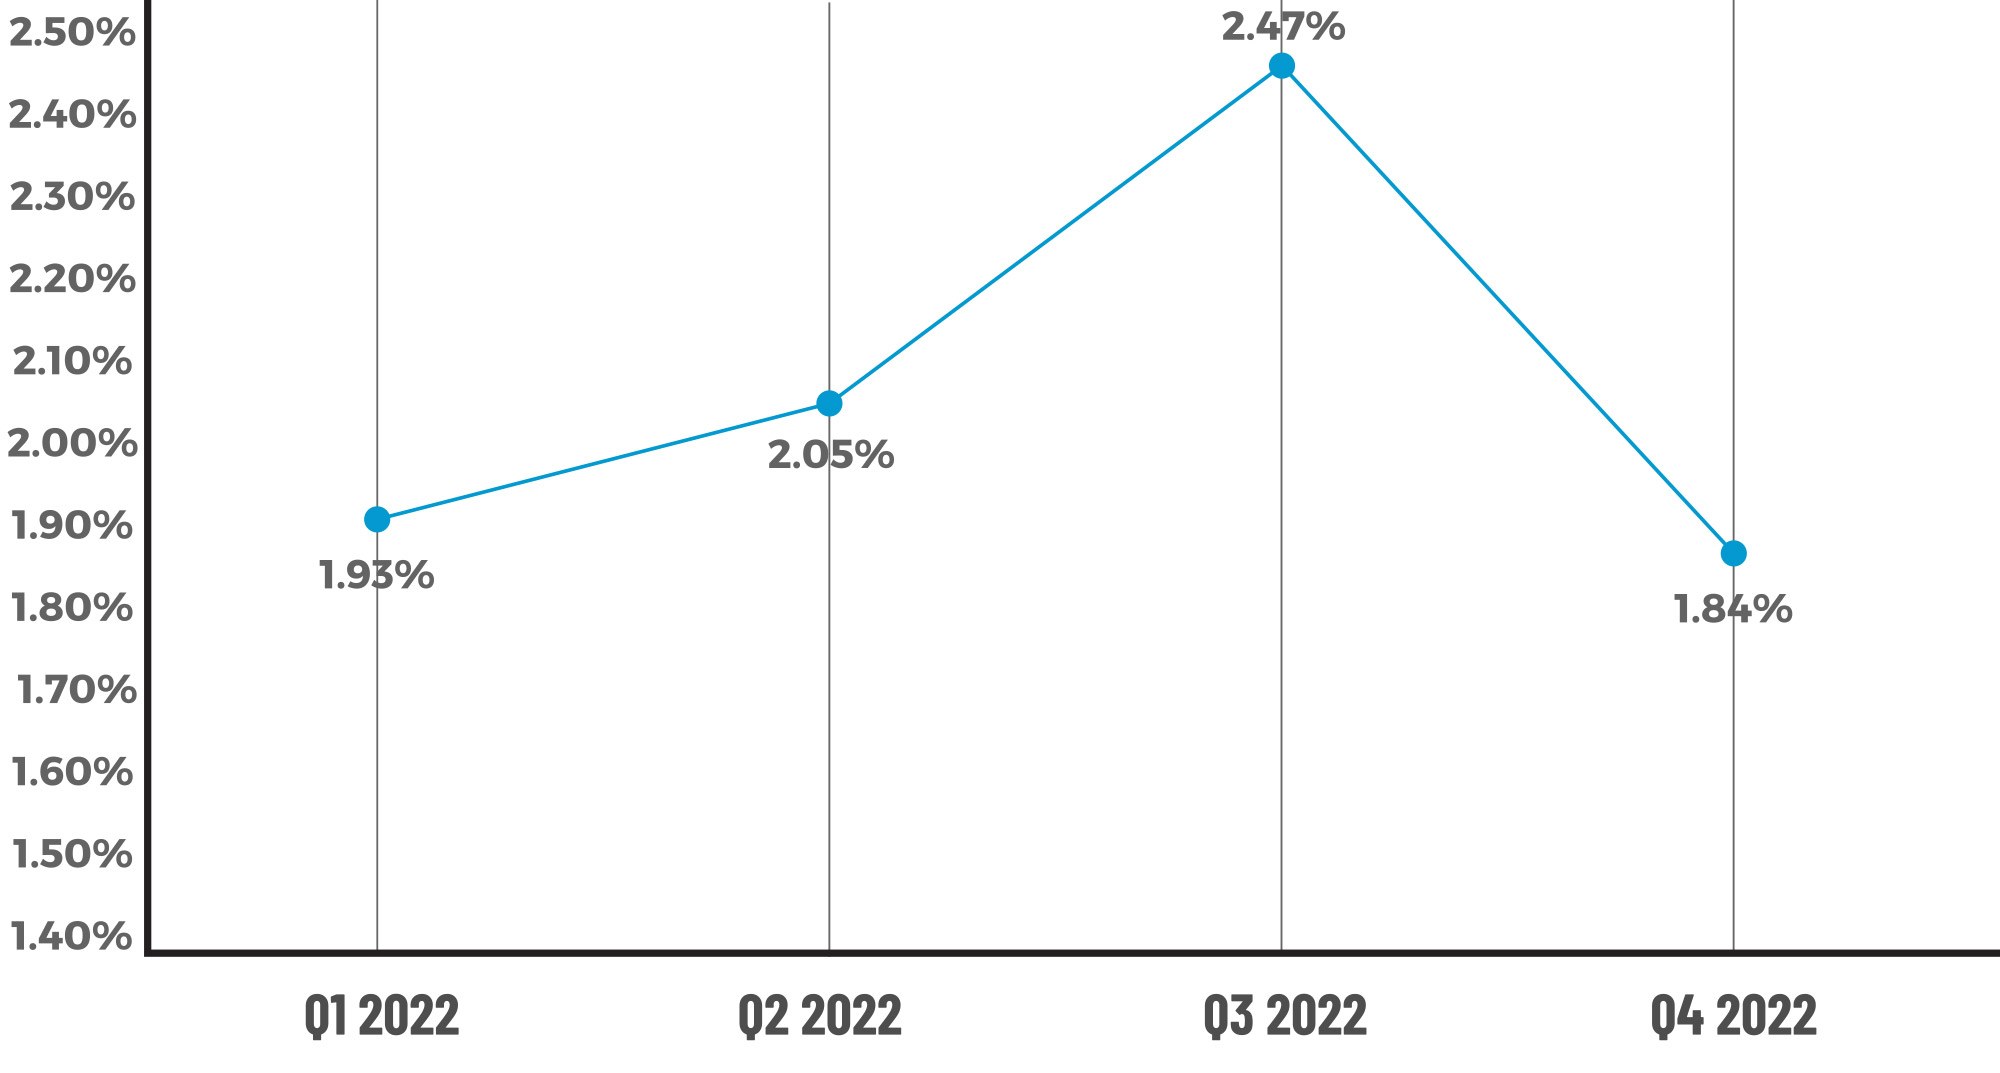
Figure 1 displays the percentage of loans with critical defects by quarter, for Q1 2022 through Q4 2022.
Critical Defect Rate by Calendar Year: 2021 — 2022
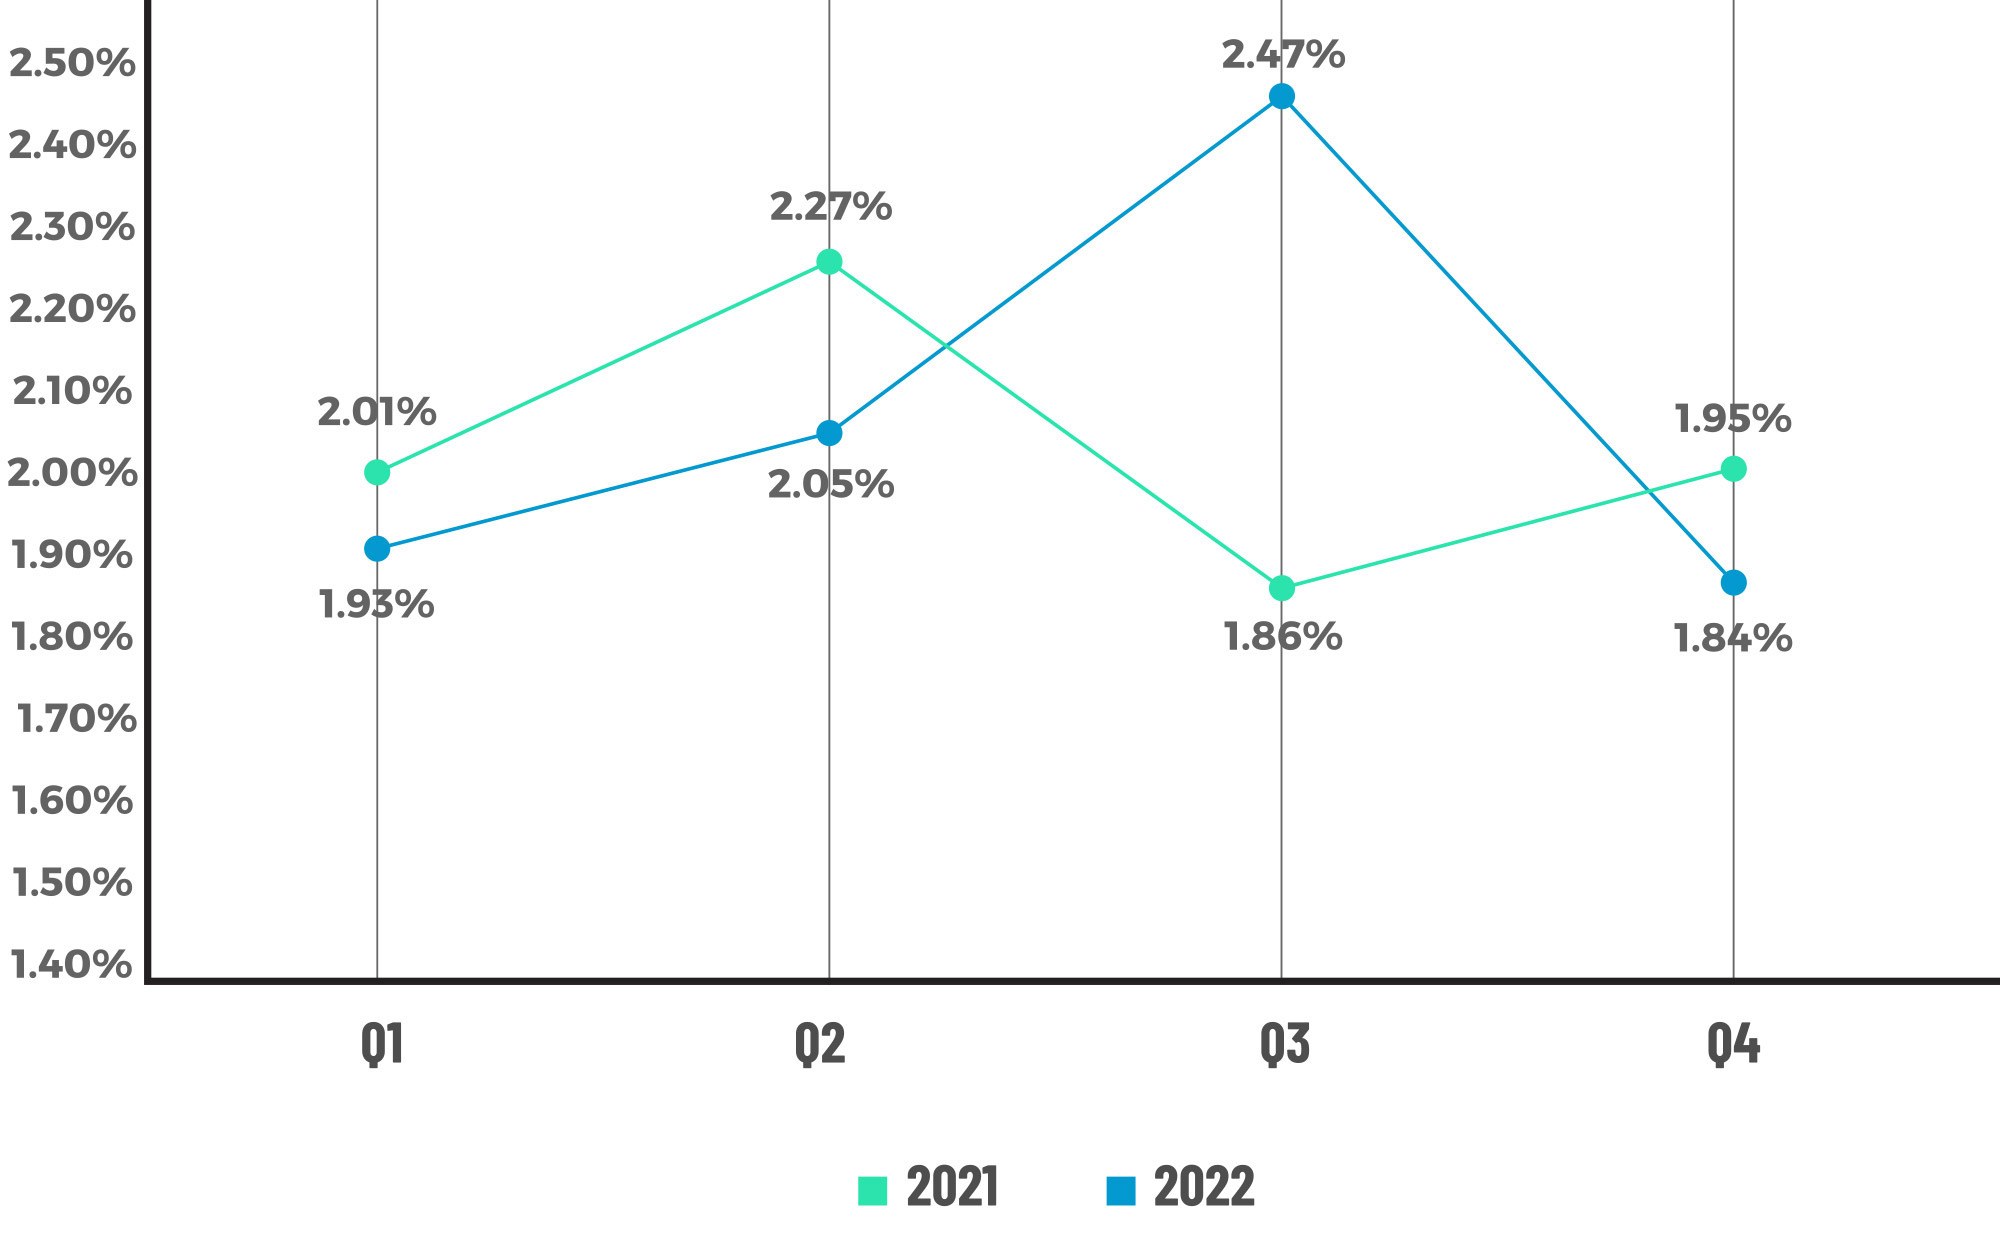
Figure 2 displays the percentage of loans with critical defects by quarter for each quarter in CY 2021 and CY 2022.
QC Industry Trends by Defect Category
A familiar theme re-emerged in Q4 with Income/Employment leading all categories at 36.91%, an increase of nearly 50% over Q3. Assets were the second most cited category in Q4 at 18.12%, representing a 20.24% increase, and Borrower and Mortgage Eligibility rose 54.33% to round out the top three at 14.09%.
Income/Employment is arguably one of the most challenging parts of the underwriting process. Understandably, lenders are trying to qualify and approve every application they take, but they must do so cautiously. Higher interest rates and property taxes are pressuring debt-to-income (DTI) ratios, so accurately calculating the income portion of the lending equation will be paramount to avoiding defects in this area moving forward.
However, looking at these numbers in isolation does not tell the whole story. While all three categories saw significant quarter-over-quarter increases, the year-over-year comparison shows that Income/Employment and Borrower and Mortgage Eligibility were down 2.8% and 21.4%, respectively, from 2021. In contrast, Assets did see a slight year-over-year increase of 8.49%.
One area of consistent focus in these reports is the "Big 4" underwriting-related categories – Income/Employment, Assets, Credit and Liabilities, as these categories are closely tied to borrower health and qualification. As noted above, defect share in the Assets and Income/ Employment categories increased between Q3 and Q4. Still, both Credit and Liabilities decreased, with Credit experiencing a dramatic 66% reduction over Q3 and Liabilities a more modest 2% decline.
Looking at the sub-categories that make up Assets, Credit and Income/Employment, we see documentation is the leading driver of defects in two of the three categories. This data is a roadmap for how lenders can avoid repurchase risk. Lenders should use this information to adapt their processes, target their pre-funding reviews in these areas and clean up these parts of the manufacturing process. For example, we know that the Income/Employment category is driving overall defect rates. Using this sub-category analysis, lenders now know they can focus on documentation issues to resolve a majority of the defects found within this category.
Again, we see some diverging trends when examining the year-over-year analysis versus quarter-over-quarter for the "Big 4" categories. Despite both areas having declined between Q3 and Q4, yearly defect share for Credit and Liabilities were both up from 2021, having increased by 12.6% and 10%, respectively. Yearly trends related to Assets and Income/ Employment were covered earlier in this report.
Other categories outside the core underwriting areas worth examining are Loan Documentation and Legal/Regulatory/Compliance. Both categories experienced substantial quarter-over-quarter improvement, with Loan Documentation defects down 31.4% over Q3 and Compliance down 51%. However, Loan Documentation defects increased by 12.76% in 2022 compared to 2021. While any increase is cause for concern, this is primarily a manufacturing-related category, and defects in this area more often signal a period of internal disorganization or disruption than a deterioration in loan quality. The quarterly and yearly decline in Compliance defects was a welcome sight, especially as defects were rising in this area, albeit slowly, during the first half of 2022.
This quarter's other area of note is the Appraisal category, which saw a reversal of three consecutive quarters of decline. Given the importance of the appraisal in the lending decision, this should be an area of focus in lenders' QC efforts going forward. Historically, lenders do not cite a large number of appraisal issues based on this report's findings. However, information from public reporting indicates that investors are concentrating here and reporting issues with valuations. As such, lenders should ensure they conduct a more thorough QC review of appraisals in this environment.
Critical Defects by Fannie Mae Category: Q4 2022
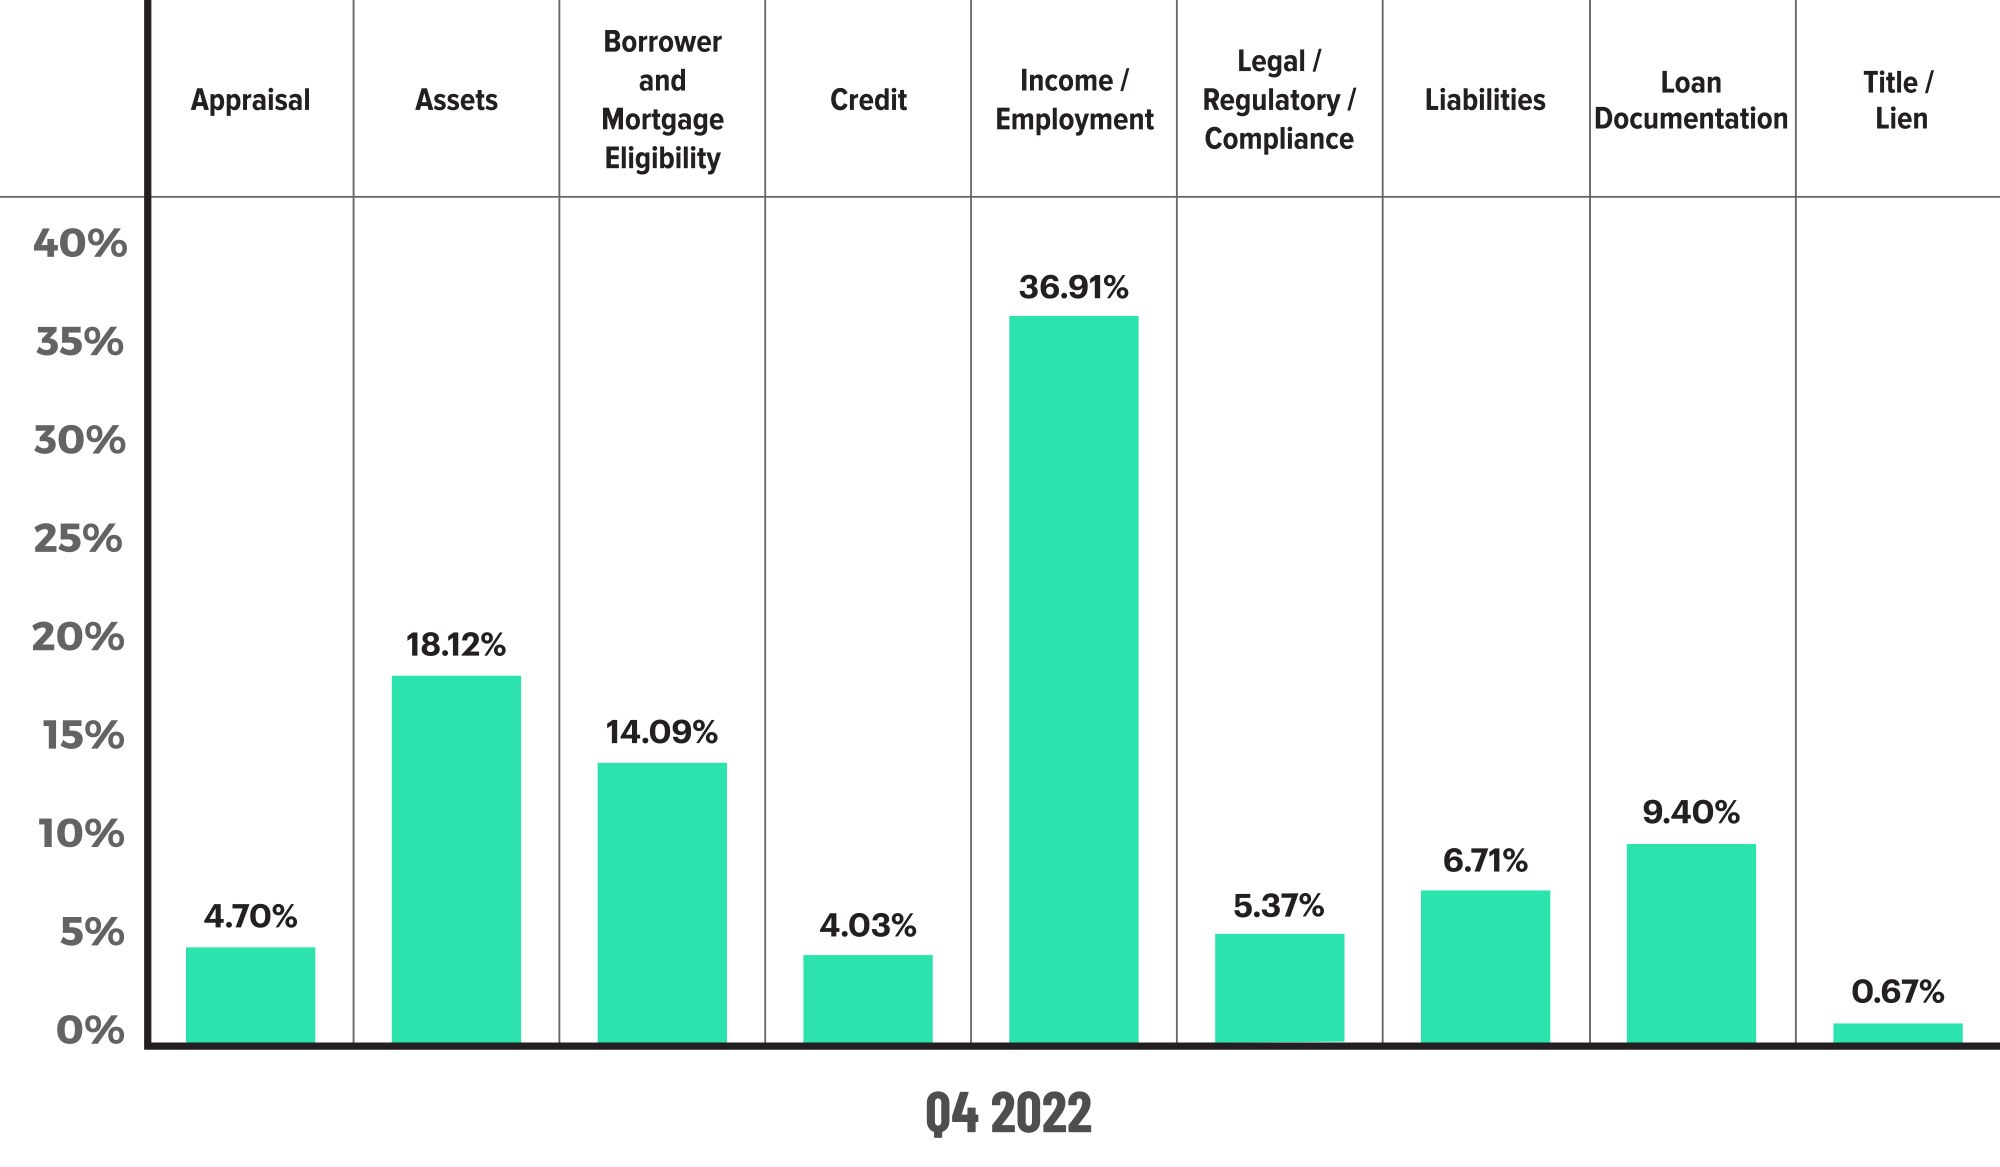
Figure 3 displays the dispersion of critical defects across Fannie Mae categories for Q4 2022.
Critical Defects by Fannie Mae Category: Q3 2022 vs. Q4 2022
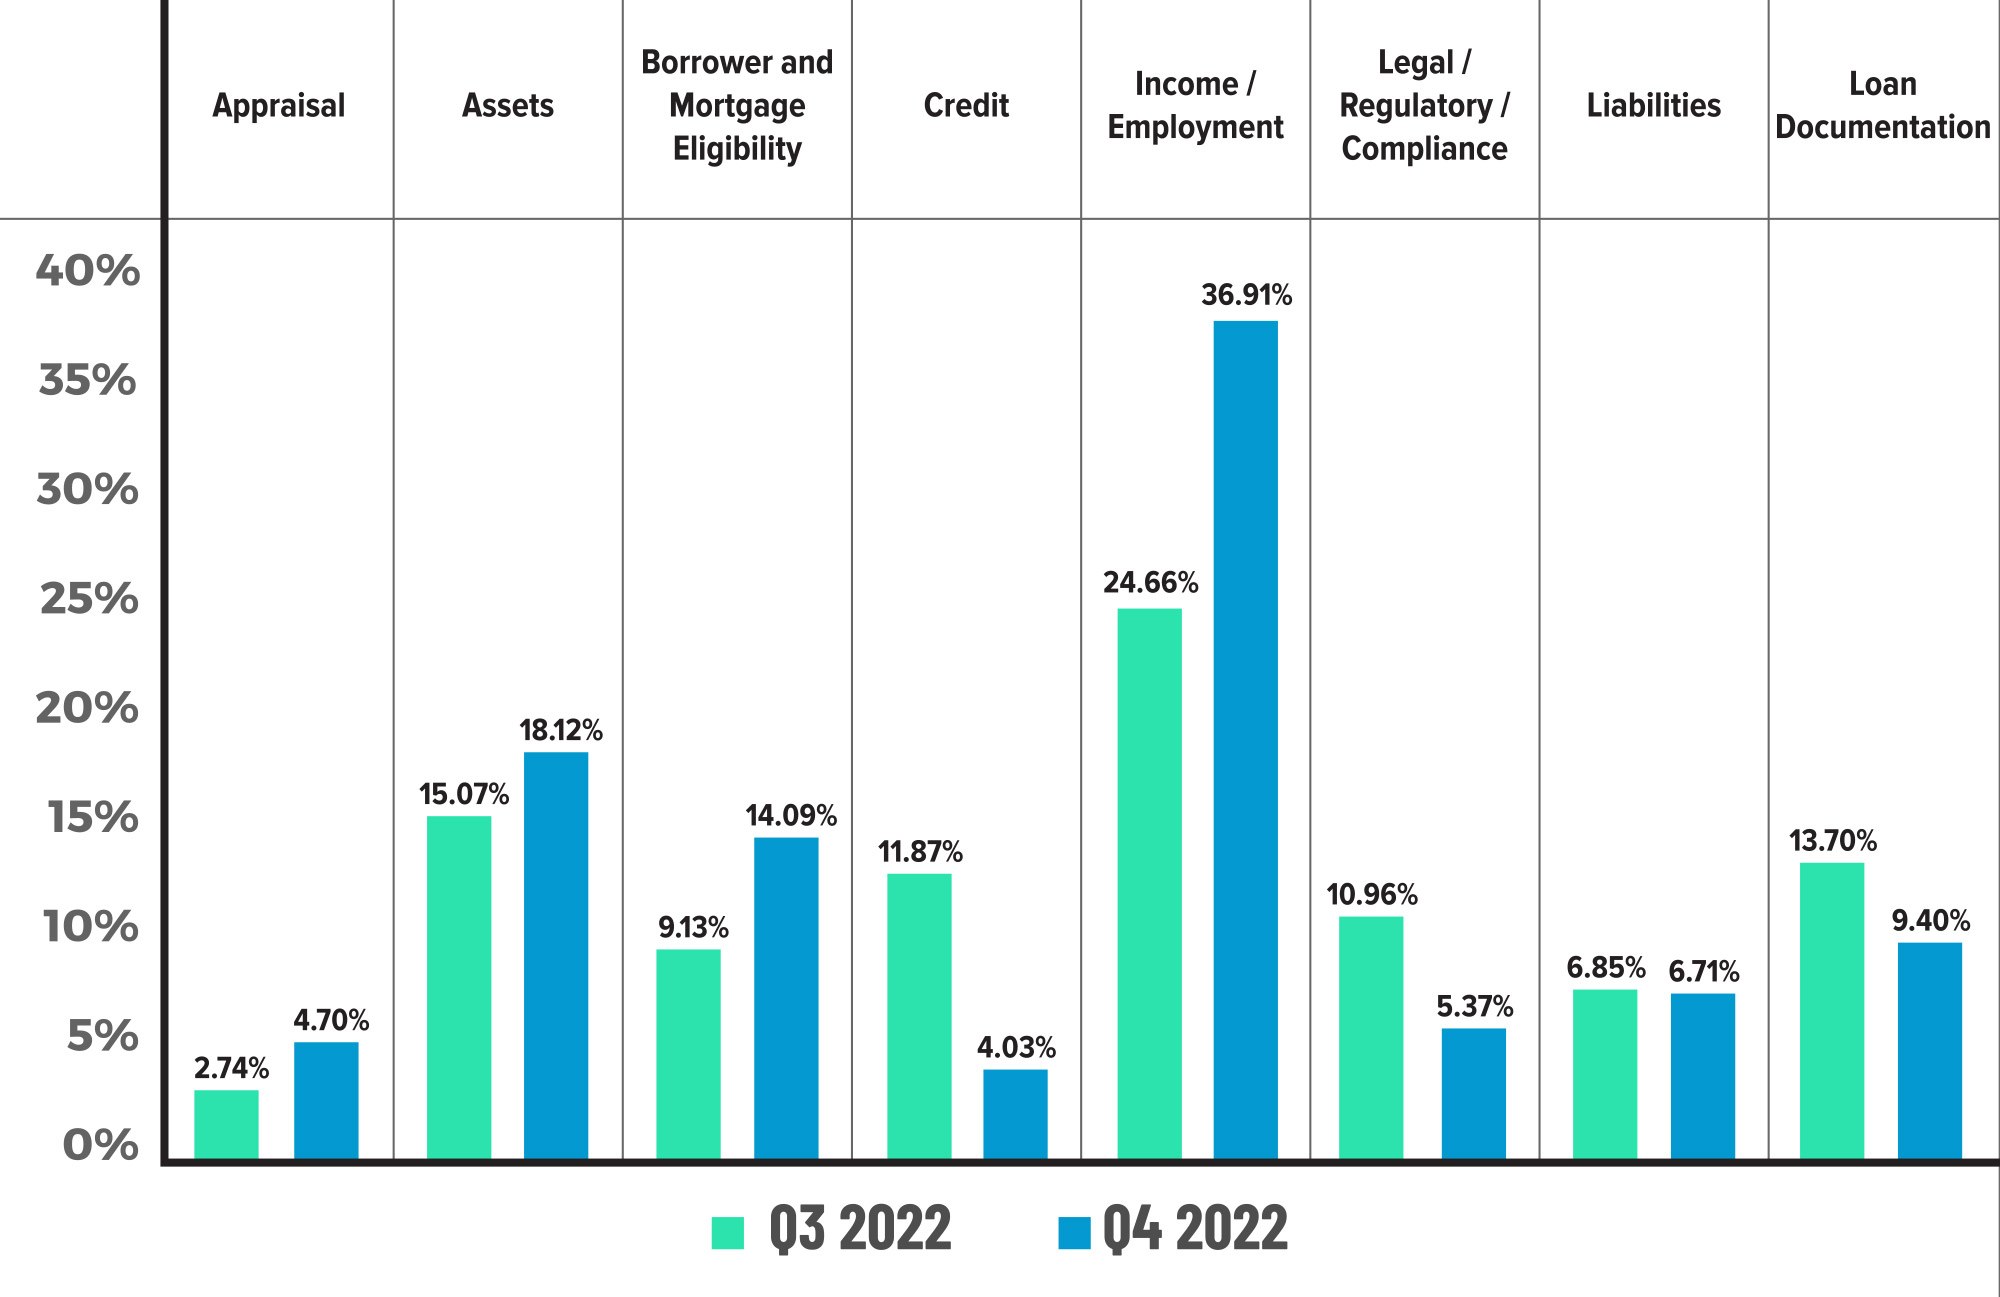
Figure 4 displays the critical defect rate by Fannie Mae category, comparing Q3 2022 to Q4 2022.
Critical Defects by Fannie Mae: CY 2021 vs. 2022
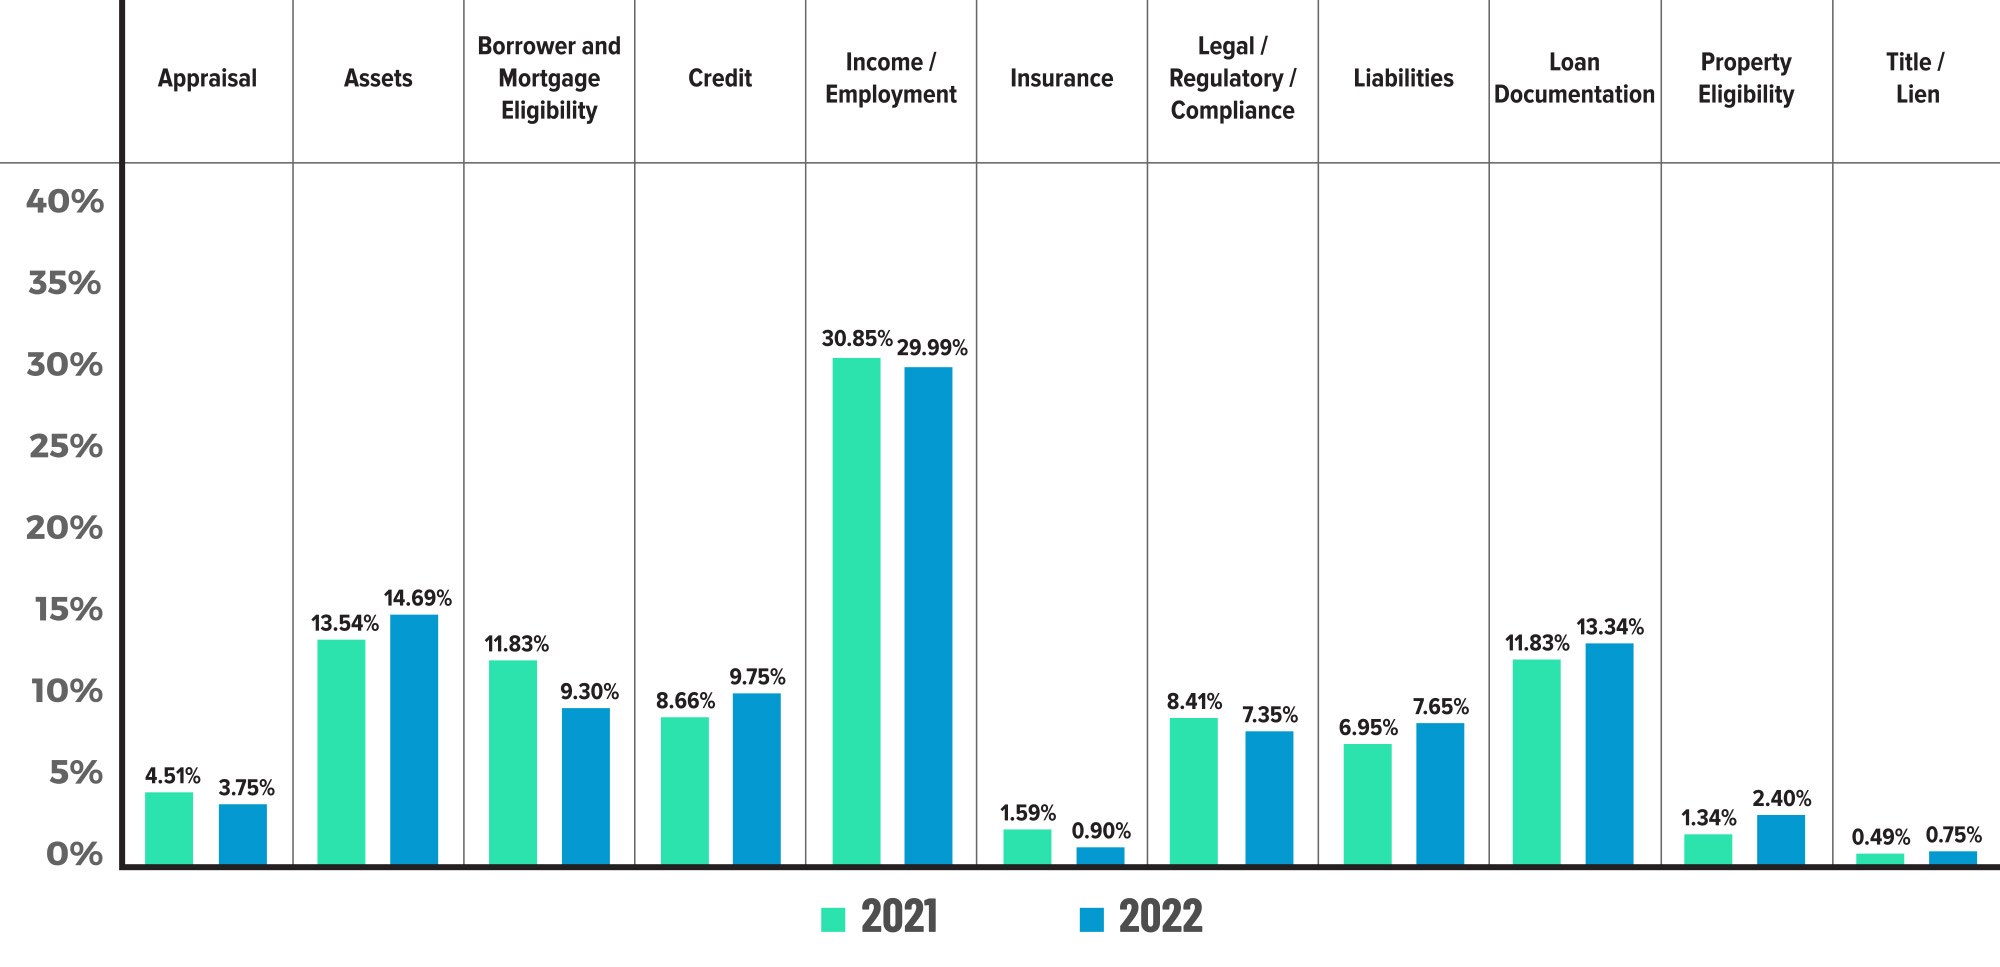
Figure 5 displays the critical defect rate by Fannie Mae category, comparing CY 2020 to CY 2021.
Critical Defects by Fannie Mae Sub-Category: Q4 2022
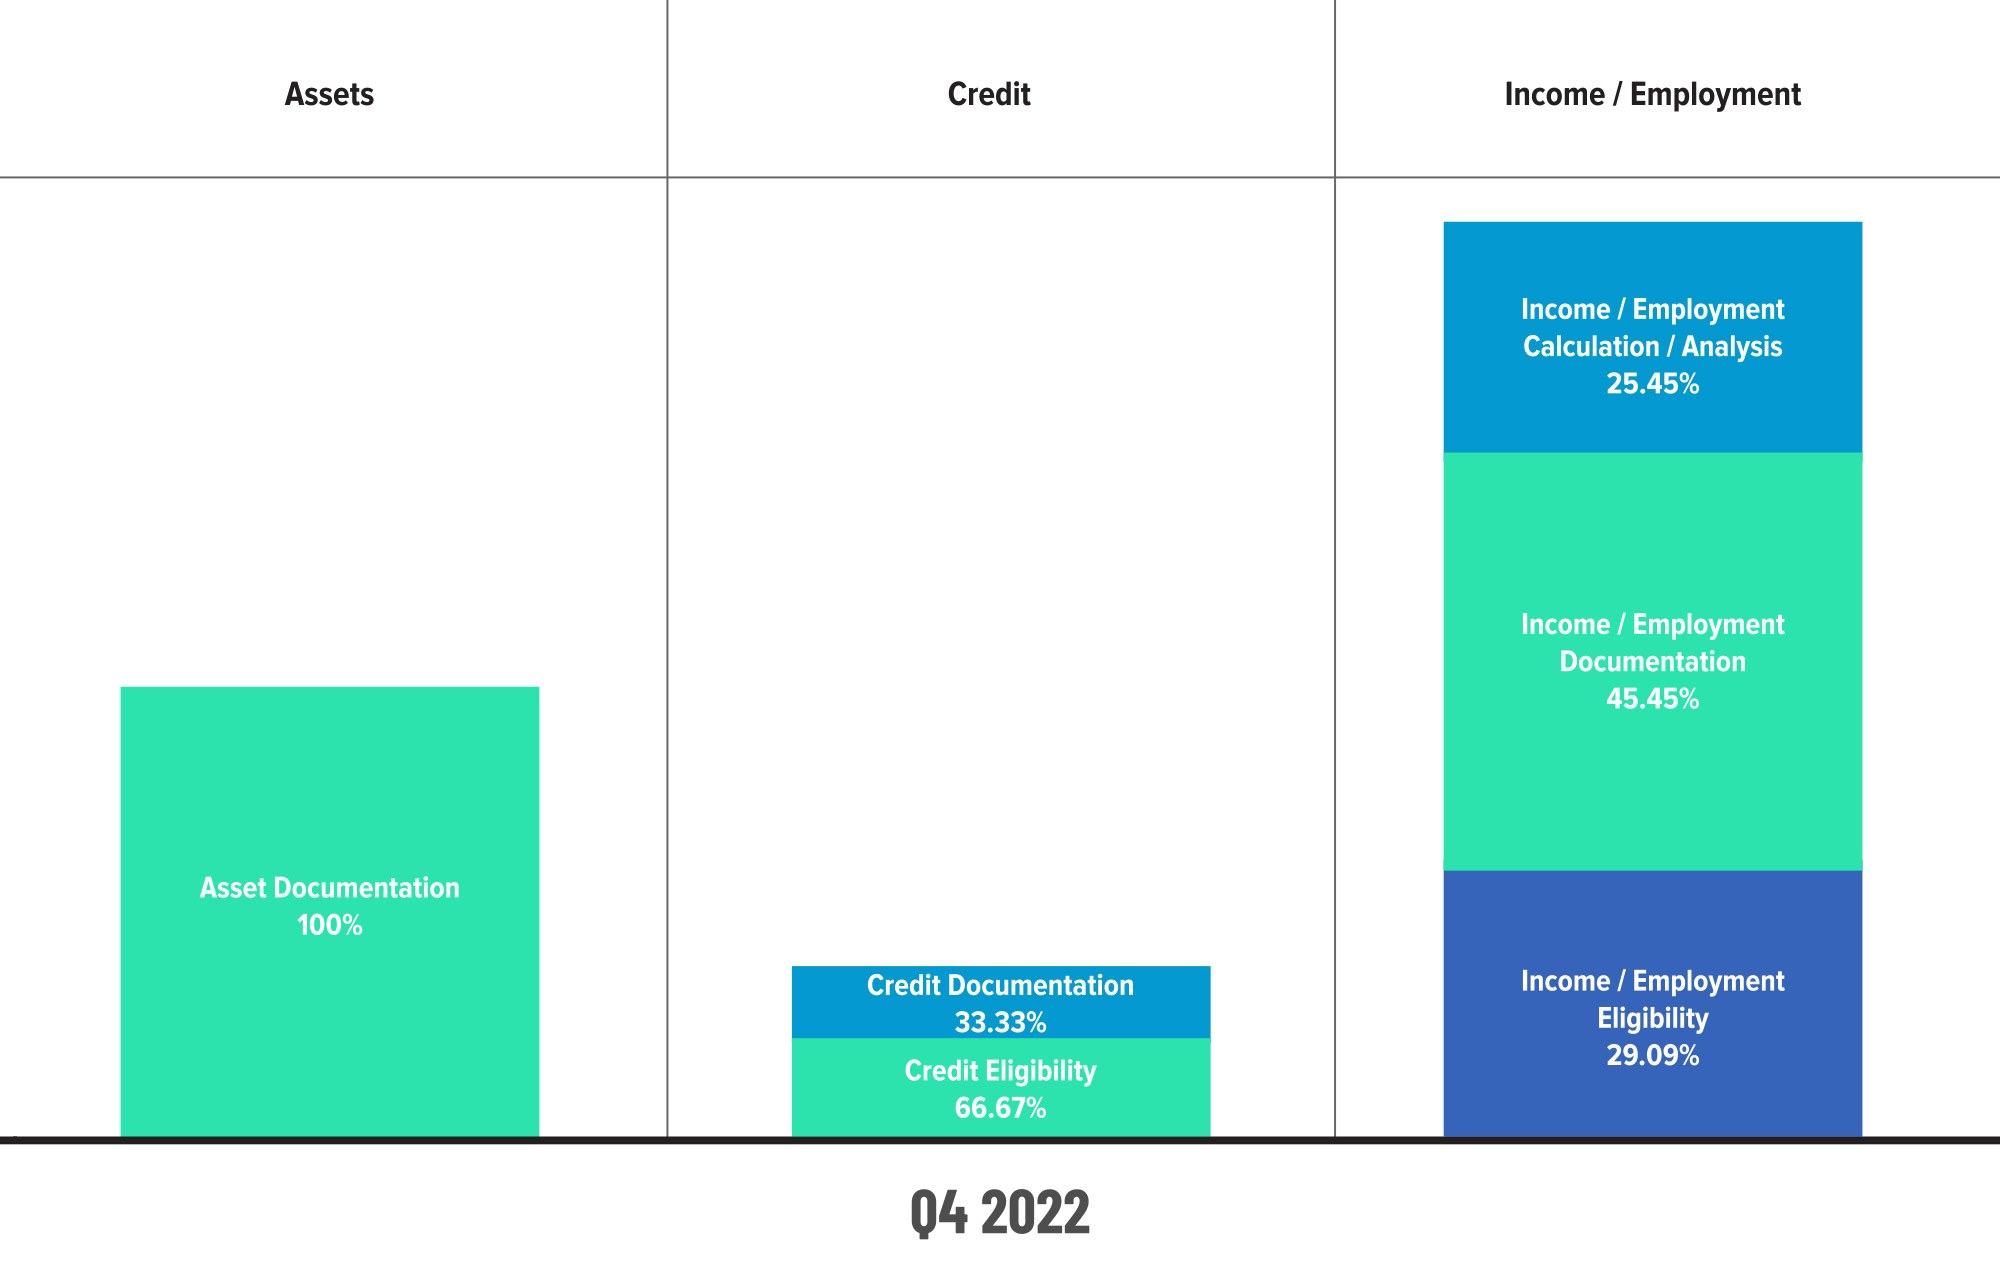
Figure 6 displays sub-category information for Q4 2022 within the Assets, Credit and Income/Employment categories.
QC Industry Trends by Loan Purpose
Looking at Q4's QC sample breakdown by Loan Purpose, it is no surprise that purchase loan share dominated, comprising 84% of all reviews during the quarter. Purchase defect share is nearly identical, indicating defect parity for the quarter. The yearly purchase review share was slightly lower than the Q4 data at 73.36%, but that is to be expected, as refinances comprised nearly 40% of reviews in Q1 and almost 30% of reviews in Q2.
For reference, purchases and refinances were roughly equal in 2021, so the 2022 data shows a 37.43% growth in QC samples for purchase loans. Defect share for 2022 was mostly in line with the review share, though purchase defects were slightly higher than review share for the year. Normally, this imbalance would indicate worsening loan performance, but the difference here is only 2.5% so the gap is not significant enough to be concerning.
Critical Defects by Loan Purpose: Q4 2022
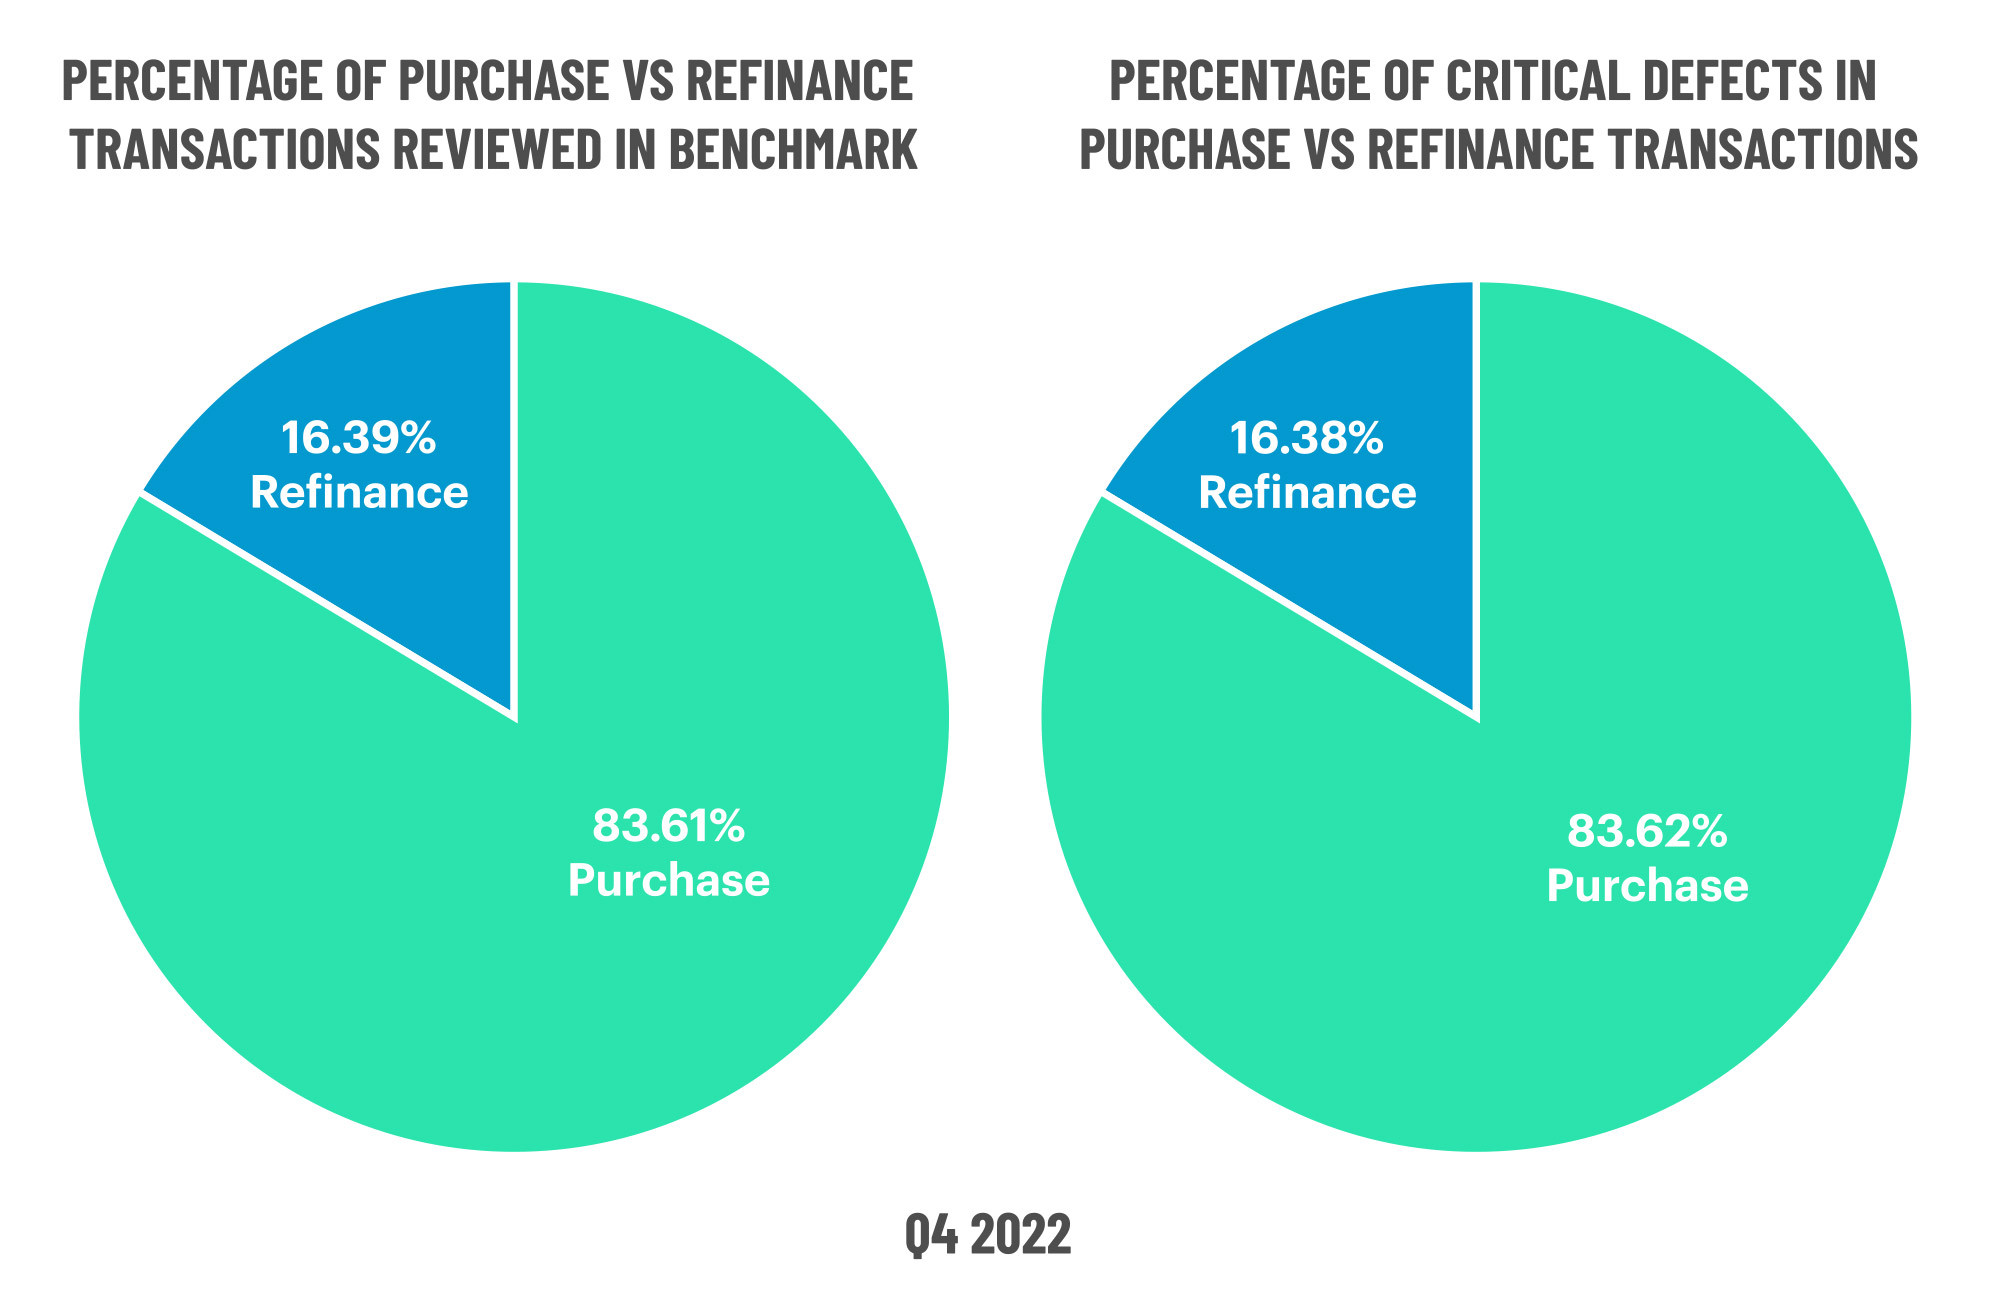
Figure 7 displays the loans reviewed and critical defects by loan purpose for Q4 2022.
Defects by Loan Purpose: Q4 2022
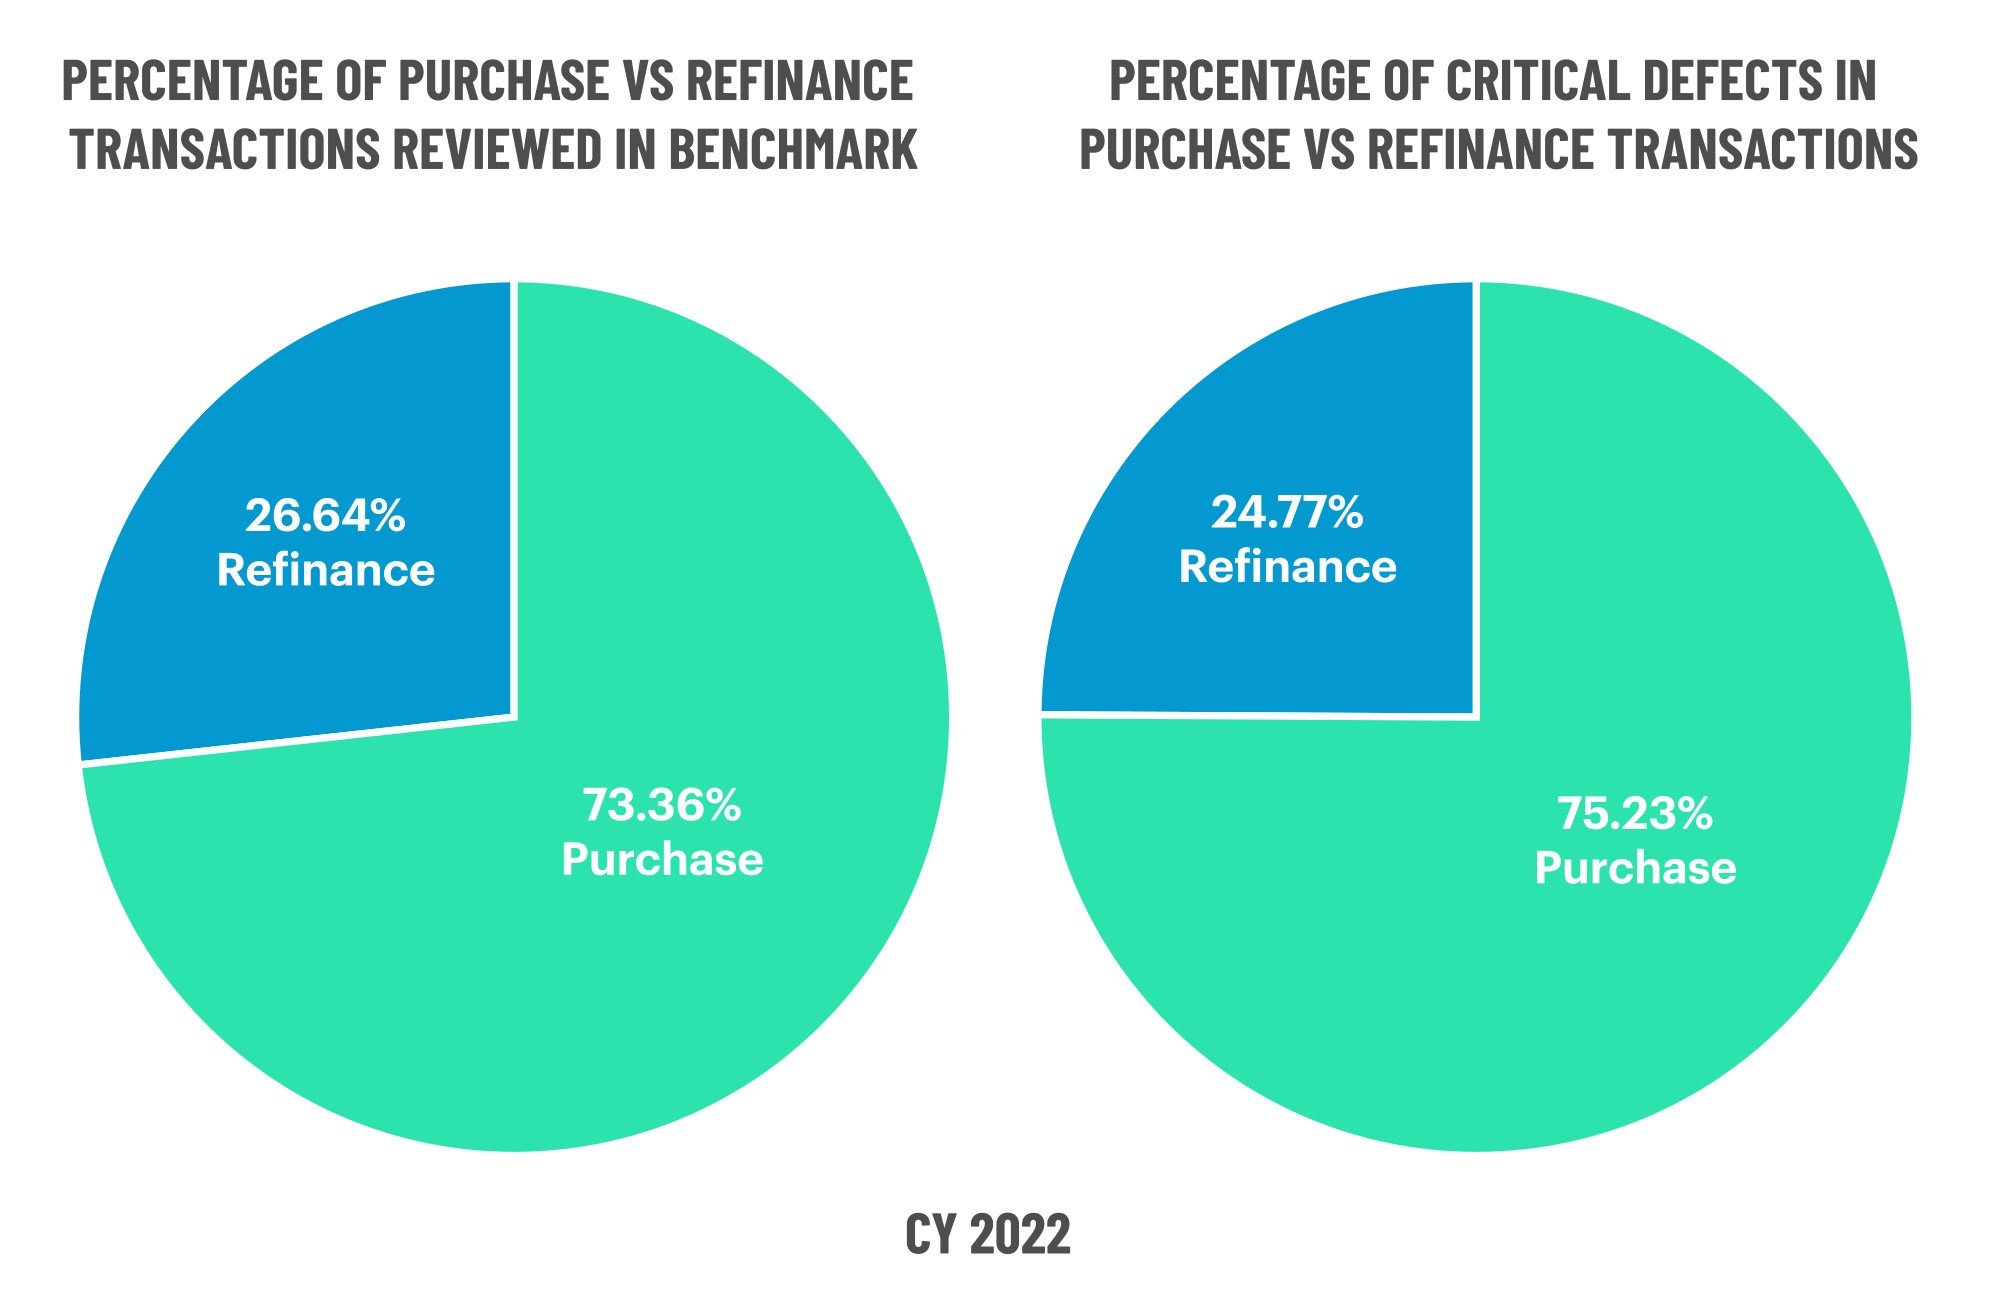
Figure 8 displays the loans reviewed and critical defects by loan purpose for CY 2022.
QC Industry Trends by Loan Product Type
In Q4, conventional loan review share increased to 65.98%, up 5.3% from 62.64% in the prior quarter. On the defect side, conventional loans comprised 50.43% of the defects this quarter, resulting in a defect spread of -16% and consistent with prior quarters. As is often the case, FHA defect share accounts for the majority of the difference. The review share for FHA loans was 20.25% this quarter, and FHA loans made up 38.26% of the defects for a defect spread of 17%.
The defect spread for USDA and VA loans was negligible, and defect share continued to improve in both these areas, which suggests that the spike in defects observed in Q2 was a momentary blip versus a persistent issue.
Comparing year-over-year data, 2022 saw a slight decline in review share for conventional loans from 66.31% in 2021 to 64.42% in 2022. From a defect perspective, conventional loans improved dramatically in 2022, comprising 47% of defects versus 62% in 2021. This indicates that lenders recognized this as a problem area last year and adjusted their processes accordingly to avoid defects on conventional loans in 2022.
One area that is cause for concern is FHA loan performance. While FHA review share declined 7.15% between Q3 and Q4, defect share increased 10.51%, marking the second consecutive quarter of double-digit increase. Furthermore, FHA defects were on the rise in three out of four quarters in 2022.
Lenders should pay special attention to FHA loans, especially in today's purchase-driven market. It is no secret that FHA purchase loans are challenging to originate and typically have razor-thin qualification margins, leaving little room for error.
Historically, HUD is more reactive than other investors regarding stepping up repurchase reviews. If these loans start to default, there is an automatic review by HUD at the time of claim, but it is also likely that reviews of performing loans will pick up soon. Defects showing up now have yet to be scrutinized by HUD for repurchase. Thus, the recent poor performance of FHA loans should be a signal to expect increased scrutiny from HUD, and lenders must focus some of their QC efforts in bringing those FHA defects down.
Defects by Loan Product Type: Q4 2022
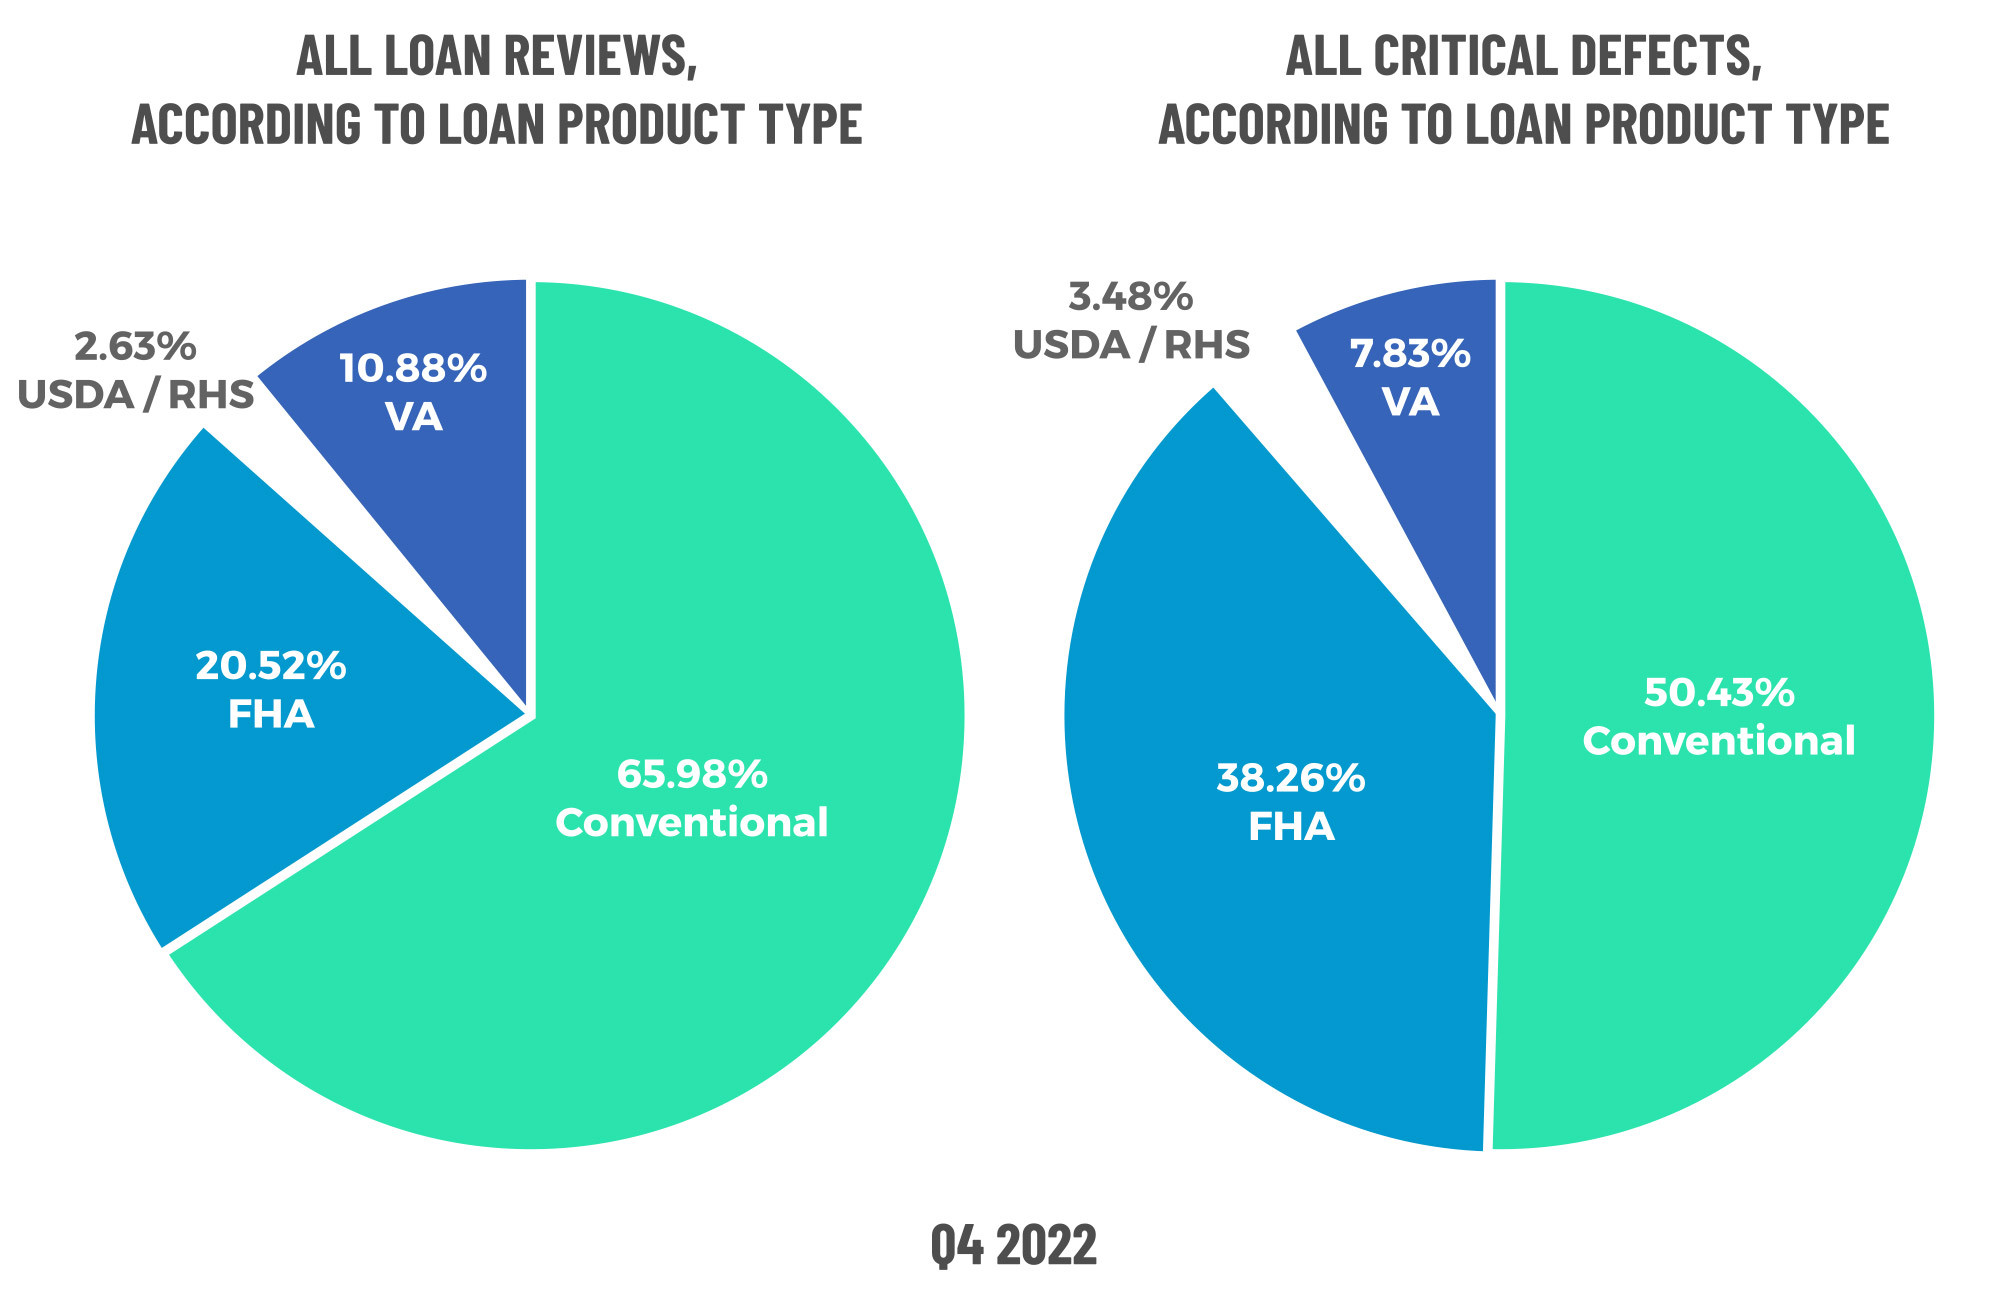
Figure 9 displays the loans reviewed and critical defects by loan type for Q4 2022.
Defects by Loan Product Type: CY 2022
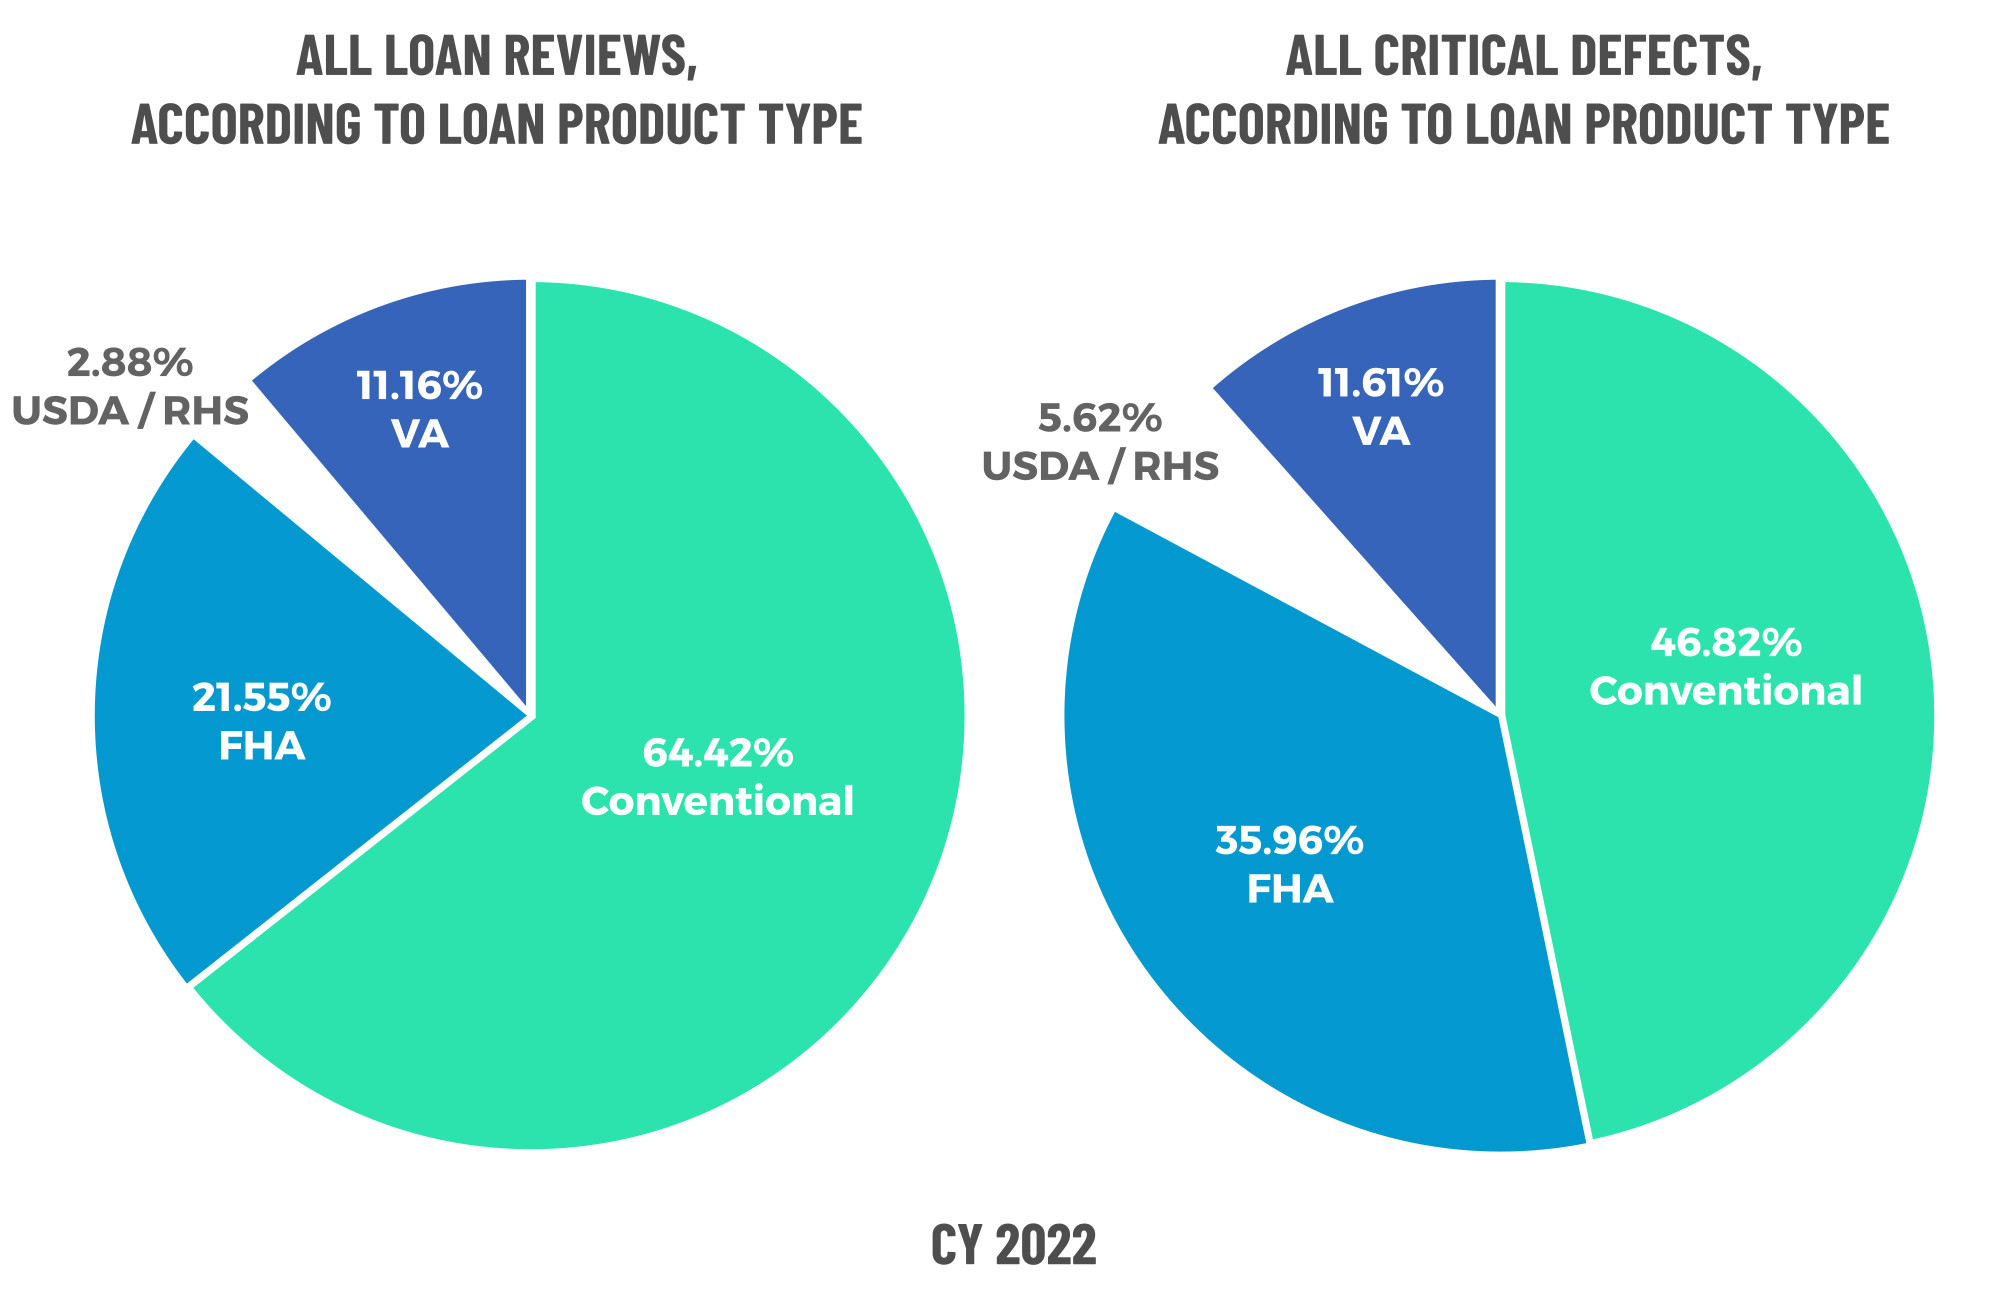
Figure 10 displays the loans reviewed and critical defects by loan type for CY 2022.
Economic Discussion
RISING HOMEOWNERSHIP COSTS
Residential real estate, including both home sales and mortgage financing, is the largest asset class in the US economy. Therefore, housing market data and trends are critical to understanding the larger economic environment. Using interest rate data between 2021 and today and an average loan amount of roughly $322,0002, the average mortgage payment is 50% higher today than it would have been 14-18 months ago. Not many borrowers can absorb that kind of increase in their monthly costs, which illustrates why mortgage lending volumes are down as much as they are.
Of course, there are layers to this risk, all of which translates to additional bad news for homeowners. The average homeowner's insurance premium increased by 12% in 2022, and that figure has risen as much as 57%3 in areas more susceptible to extreme weather events. In addition, property appreciation growth also means homeowners will pay significantly more property taxes going forward. Because property tax rates are so localized, it is difficult to get a picture nationally, but ATTOM data reports that property taxes went up 4% nationally in 2022, an increase that was twice as fast as in 20214. Thus, homeowners should brace for even larger increases as tax assessors complete their re-assessment process and home values are adjusted to reflect the heightened valuations the industry saw over most of 2021 and 2022. From a prospective buyer standpoint, the combination of increases in interest rates, insurance premiums and property taxes only makes the prospect of homeownership more expensive.
Of course, it is difficult to expect property values to hold up in the current environment, which brings its own set of concerns. Rising costs do more than slow down property appreciation. In many cases, it can trigger declines. When examining both credit risk and interest, the industry has only had to deal with interest rate risk over the past 24 months. Credit risk was virtually zero. However, the concern now is whether interest rate risk becomes a big enough issue that the industry now has to worry about credit risk also because loans are underwater due to property depreciation. It is a situation that bears close scrutiny.
LENDER PROFITABILITY
In last year's report, we noted that although volumes were up 19% over 2020, lender profitability was already heading in the opposite direction. Based on the annual statements from five publicly traded lenders, overall originations were down 63% year-over-year between 2021 and 20225. For context, on average, refinances comprised 75% of the volume in 2021 versus around 40% in 2022. Given that interest rates were still in the mid-3% range in Q1 2022, the industry can expect further pain.
Another area to examine is the change in the gain-on-sale margin, which is the primary metric that drives revenue and profitability at lenders and banks. Using the statements referenced above, the average gain-on-sale margin for these lenders decreased from 2.36% in 2021 to 1.87% in 2022, representing a 21% decline. Unsurprisingly, revenue also declined 69% year-over-year from $18.8 billion in 2021 to $5.8 billion in 2022.
This data illuminates the layered risks facing lenders in today's market. Higher rates are undoubtedly impacting volumes. At the same time, each origination dollar is worth less revenue to the lender, and most of the financial positivity of rising servicing values as a hedge against declining origination was realized in 2022. Thus, banks and lenders can count on less positive financial impact going forward.
LENDING CYCLE IMPACTS
There's always lots of talk about the cyclical nature of mortgage lending. As rates fall, refinances increase until something triggers a rise in interest rates. From there, lenders seek to cut costs as volumes and, eventually, profitability decline. The industry reorients itself to focus on purchase loans, HELOCs and new products, and as MSR values increase, lenders can raise cash by selling off a portion of those...which leads to where the industry currently is in the cycle. The strongest companies start to go shopping. M&A activity has increased across the board this year, and lenders planning to be stronger at the end of this cycle are looking for opportunities to expand their geographic footprint and/or loan officer base.
The road ahead is where lenders face the most risk, as the industry starts to see the fallout from the earlier parts of the cycle and experience the full impact of the refi boom ending. The two main parts of that are if/when property prices fall and the impact on delinquencies and foreclosures.
Property appreciation growth has slowed, rising 0.2% on a seasonally adjusted basis in Q4 2022 versus the 0.1% growth seen last quarter. However, it is worth noting that home prices declined by 1% in Q4 2022 on a non-seasonally adjusted basis6. Looking at Q1 2023, home prices grew 1% on both a seasonally and non-seasonally adjusted basis7.
On the default side, delinquencies did increase 12% to 3.96% in Q4, but that was on the back of Q3's historic low of 3.45%8. Moreover, the data reversed course in Q1 2023, declining to 3.56%9. In addition, foreclosure starts did increase by 115% from 2021 to 2022 but were also down 34% from 2019's pre-pandemic levels10. In real terms, last year's foreclosure starts represent roughly 0.5% of all housing units. At these levels, the industry is not approaching widespread losses.
Ultimately, the severity of the next phase of the lending cycle hinges on the Fed's ability to get inflation under control fast enough to slowly bring rates back down to more normal levels. If it takes a year or longer to battle inflation, the industry's recovery may take longer than lenders would like, given the interest rate increases that go along with bringing inflation in check.
REPURCHASE RISK
Repurchases are on the rise. Investors are well aware of the current environment the industry is experiencing and what could still lie ahead. Typically at this point in the cycle, lenders become more aggressive in their stance on losses so it would be normal to see increased focus on repurchases. Some of the language in the public filings referenced earlier warned of increased repurchase activity. One explicitly stated, "Investors are particularly aware of the conditions under which lenders must indemnify them against losses."
The real issue is the economics of repurchases in today's interest rate environment. Most lenders do not possess the financial capacity to hold a defective loan on their balance sheet for 30 years. Therefore, they almost always sell the loan into the scratch-and-dent market. Before the rapid increase in interest rates, a lender could expect to sell a performing loan with defects for around a 5-10% loss, translating into approximately $5,000 to $10,000 per $100,000 in origination balance. A non-performing scratch-and-dent loan would sell for a 10-20% loss.
With current interest rates more than double what they were in 2021, lenders can expect up to a 20% loss, or $20,000 per $100,000 in originated balance, on a fully performing loan just for the interest rate pair-off, which does not even take into account further discounts for the severity of the defects. That means much steeper losses on each repurchase, and some lenders may have trouble stomaching that financial burden.
Based on publicly available loan-level data from Fannie Mae, the agency averaged one loan repurchase request for every 600 originations for 2021, which is an increase from one loan repurchase out of 760 originations for 2020. While Fannie Mae has yet to complete its review of 2022 originations, experts are predicting similar repurchase-to-origination ratios11. This is why it is critically important for lenders to pay attention to defects. Repurchases in today's market have a much more significant financial impact than during a refinance boom when repurchases are often viewed simply as a cost of doing business.
PRODUCT MIX
One final item to note is that product mix has shifted back in favor of adjustable-rate mortgages (ARMs). The reasons for this are twofold, and the first is fairly obvious, in that the current average interest rate on a 5/1 ARM is roughly an entire percentage point lower than the average 30-year fixed rate.
The second reason for the rise in ARMs today is the extremely low rates during the pandemic. Before the pandemic, the average interest rate spread between a 30-year fixed loan and a 5/1 ARM was around 0.5%. During an eight-month period between April 2020 and February 2021, the industry saw negative spreads between these two products, meaning the ARM rate was higher than the 30-year fixed rate, so it is easy to see why ARM originations fell out of favor.
Now that the spreads have shifted back in favor of ARMs, lenders are increasingly adding these products back into their portfolios to help combat borrower resistance to current 30-year fixed interest rates. Thus, QC departments must work closely with the operations team as these products come online and perhaps increase their targeted and discretionary samples of these loan types to mitigate risks.
2 https://newslink.mba.org/mba-newslinks/2023/march/mba-newslink-tuesday-mar-21-2023/mba-reports-4q-imb-net-losses/
3 https://www.nytimes.com/2023/05/05/realestate/home-insurance-climate-change.html
4 https://www.attomdata.com/news/market-trends/home-sales-prices/attom-2022-property-tax-analysis/
5 Figures publicly available on https://www.sec.gov/edgar/searchedgar/companysearch
6 https://www.fanniemae.com/newsroom/fannie-mae-news/home-price-growth-decelerated-fourth-quarter
7 https://www.fanniemae.com/newsroom/fannie-mae-news/home-price-growth-first-quarter-2023
8 https://newslink.mba.org/mba-newslinks/2023/february/mba-newslink-friday-feb-17-2023/mba-4q-mortgage-delinquencies-increase/
9 https://www.mba.org/news-and-research/newsroom/news/2023/05/11/mortgage-delinquency-rate-in-first-quarter-2023-declines-to-second-lowest-level-in-mba-s-survey
10 https://www.attomdata.com/news/market-trends/foreclosures/attom-year-end-2022-u-s-foreclosure-market-report/
11 https://capitalmarkets.fanniemae.com/credit-risk-transfer/single-family-credit-risk-transfer/fannie-mae-single-family-loan-performance-data
Conclusion
In wrapping up the Q4/CY 2021 report, we wrote, "Despite a slight rise in the overall critical defect rate in Q4 2021, the entire year showed improved results over 2020. The numbers for Q1 2022 should be interesting, with the war in Ukraine starting towards the end of the quarter and the explosion in global inflation triggering US mortgage interest rates to rise. Lenders have their work cut out for them, and the economic environment is less than friendly overall, making Quality Control and Compliance teams more important than ever."
It is safe to say that those predictions have primarily proven correct. Though the industry has yet to emerge on the other side of the market downturn, there were some bright spots in 2022 from a loan quality perspective. Lenders have made a tremendous effort to shore up their processes after weathering the chaos during the latter months of 2021 and seem to be carrying those efforts into 2023. There are factors working against lenders, and the cost of originating bad loans (and the repurchase consequences) have skyrocketed with more pain expected in the near-term. Lenders must lend while taking measured risks in order to stay in business, and that makes appropriate quality control guiderails more important than ever. Quality Control personnel have the opportunity to make a huge financial impact for their firms, and vigilance is needed now more than ever.
About the ACES Mortgage QC Industry Trends Report
The ACES Mortgage QC Industry Trends Report represents a nationwide post-closing quality control analysis using data and findings derived from mortgage lenders utilizing the ACES Analytics benchmarking software.
This report provides an in-depth analysis of residential mortgage critical defects as reported during post-closing quality control audits. Data presented comprises net critical defects and is categorized in accordance with the Fannie Mae loan defect taxonomy.
About ACES
ACES Quality Management is the leading provider of enterprise quality management and control software for the financial services industry. The nation’s most prominent lenders, servicers and financial institutions rely on ACES Quality Management & Control® Software to improve audit throughput and quality while controlling costs, including:
- 4 of the top 5 and more than 50% of the top 50 independent mortgage lenders;
- 8 of the top 10 loan servicers;
- 11 of the top 30 banks; and
- 3 of the top 5 credit unions in the USA.
Unlike other quality control platforms, only ACES delivers Flexible Audit Technology, which gives independent mortgage lenders and financial institutions the ability to easily manage and customize ACES to meet their business needs without having to rely on IT or other outside resources. Using a customer-centric approach, ACES clients get responsive support and access to our experts to maximize their investment.
For more information, visit www.acesquality.com or call 1-800-858-1598.
Media Contact: Lindsey Neal | DepthPR for ACES | (404) 549-9282 | lindsey@depthpr.com
View all reports